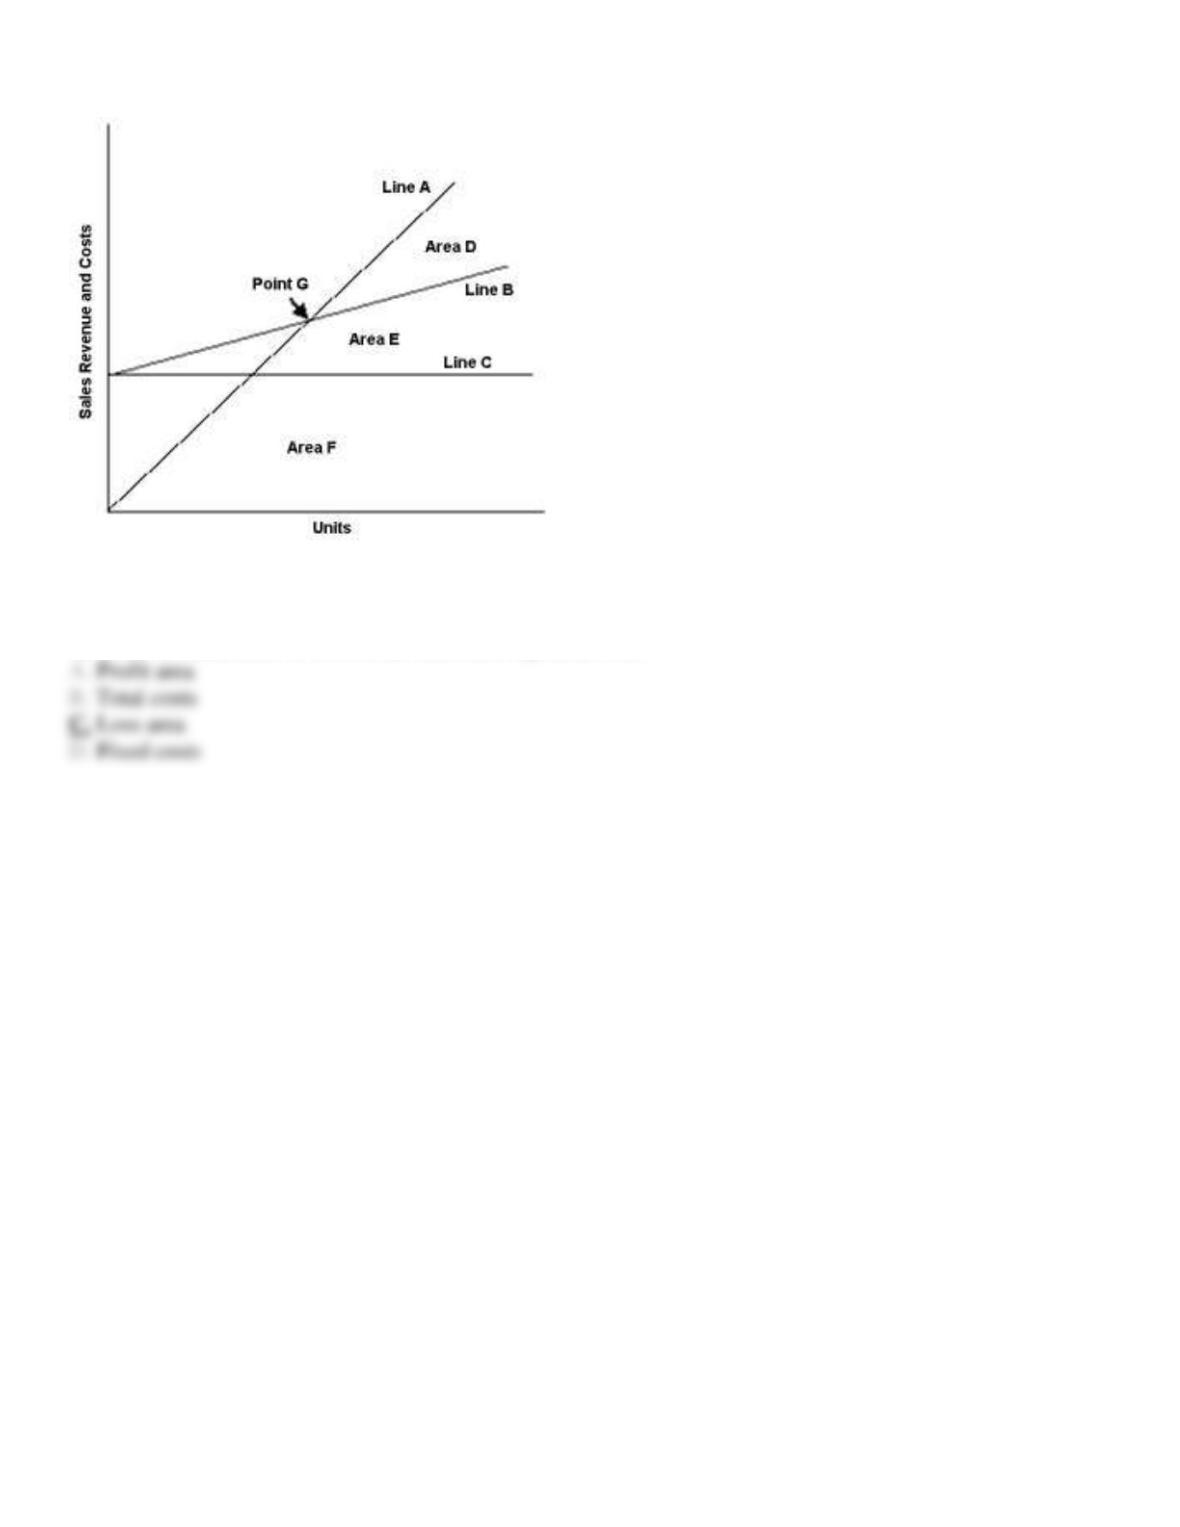
121. Exhibit 21-7
Use the cost-volume-profit graph below to answer the following question(s).
Refer to Exhibit 21-7. On the cost-volume-profit graph, the area between point G, the origin of the graph, and
the point at which Line B crosses the sales axis represents the:
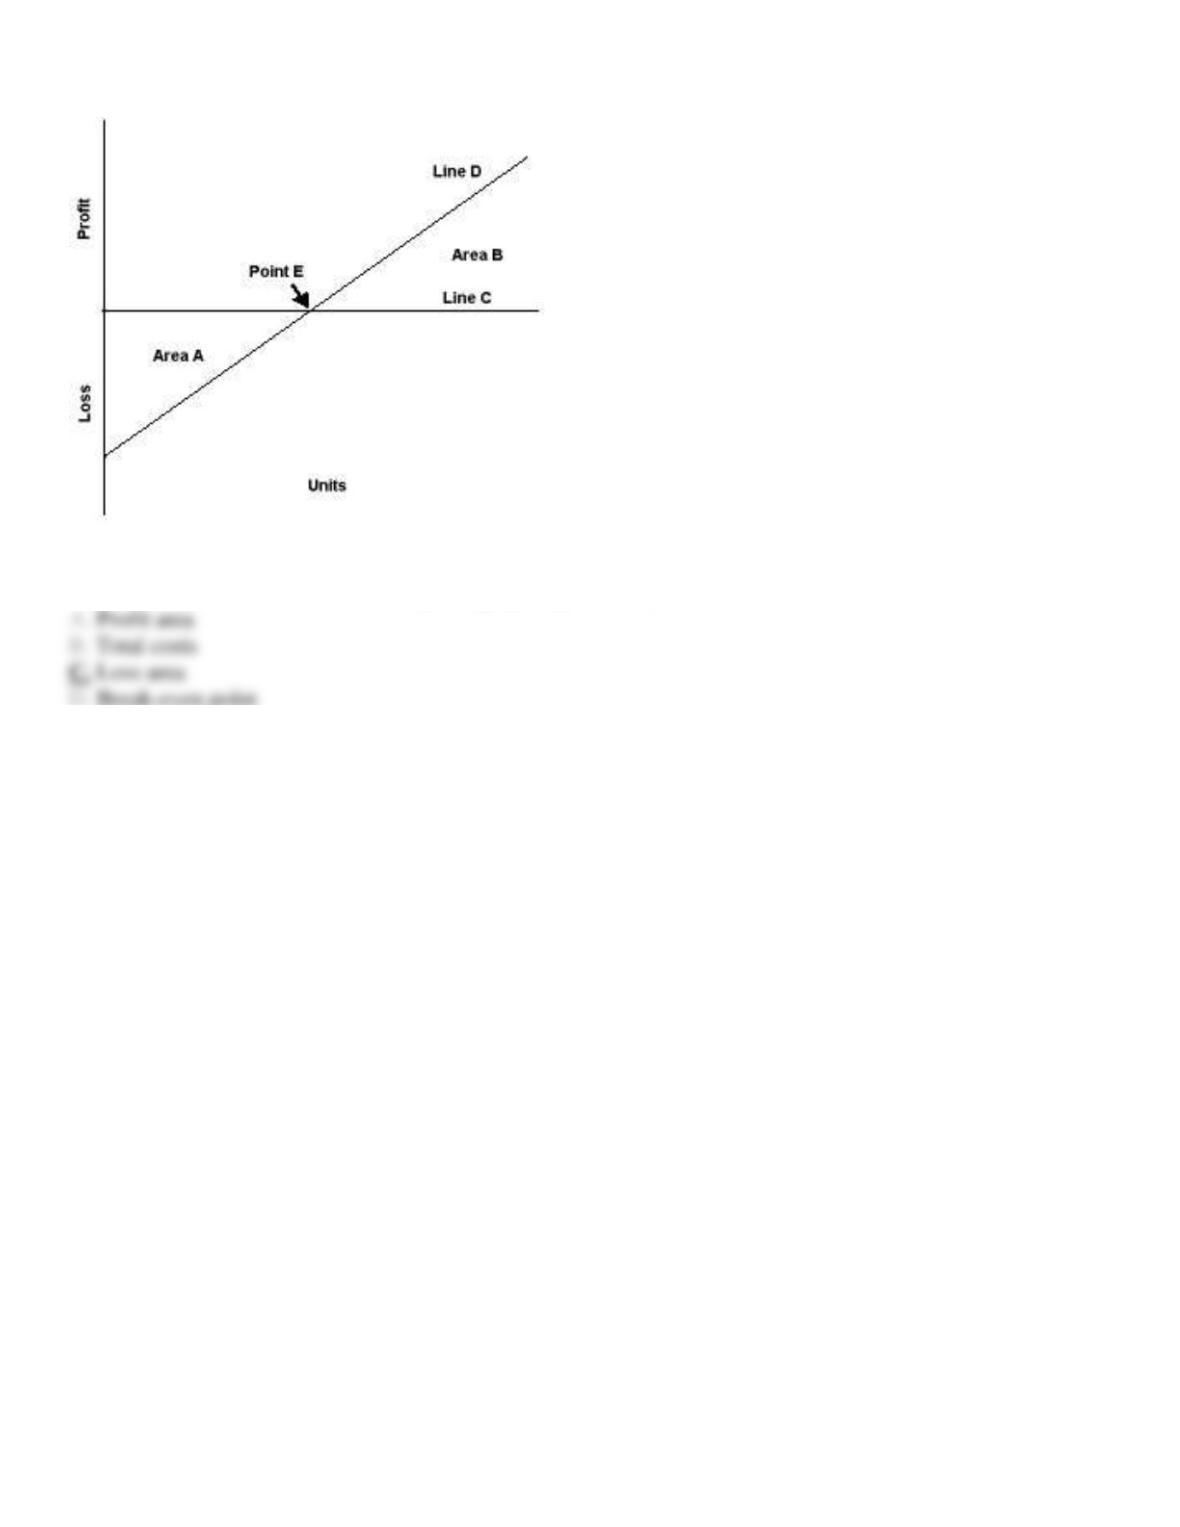
122. Exhibit 21-8
Use the profit graph below to answer the following question(s).
Refer to Exhibit 21-8. Area A on the profit graph represents the:
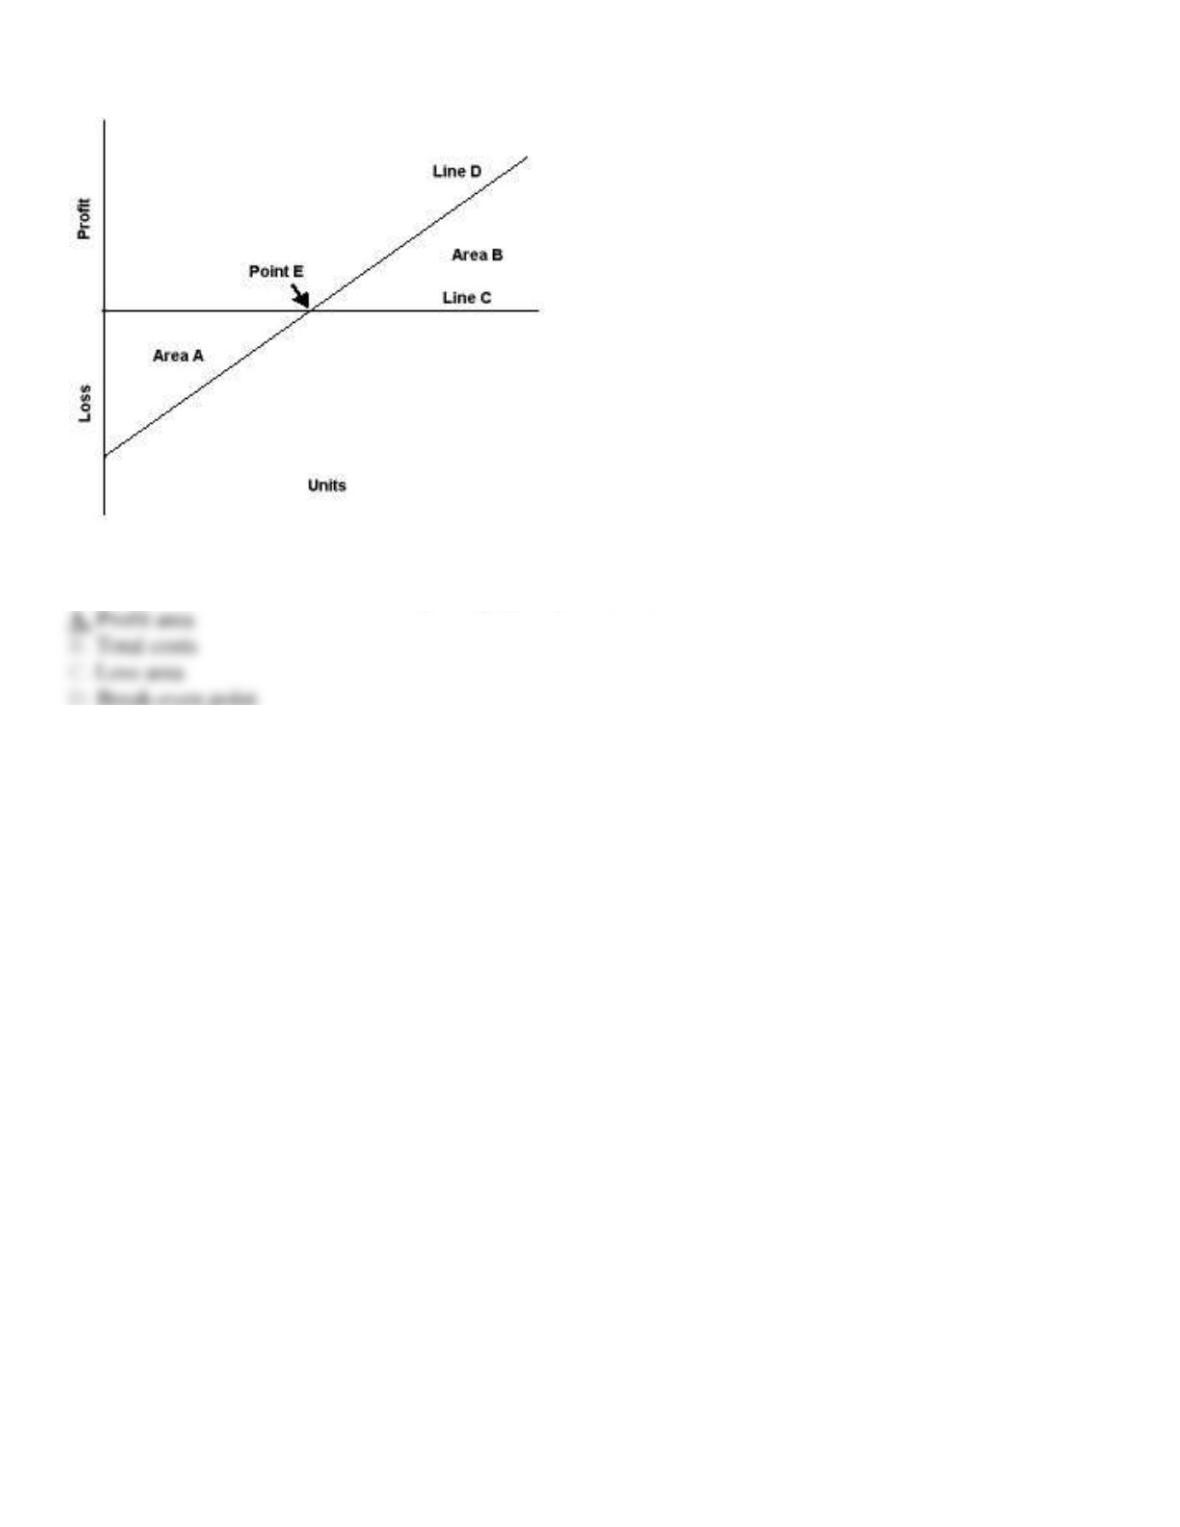
123. Exhibit 21-8
Use the profit graph below to answer the following question(s).
Refer to Exhibit 21-8. Area B on the profit graph represents the:
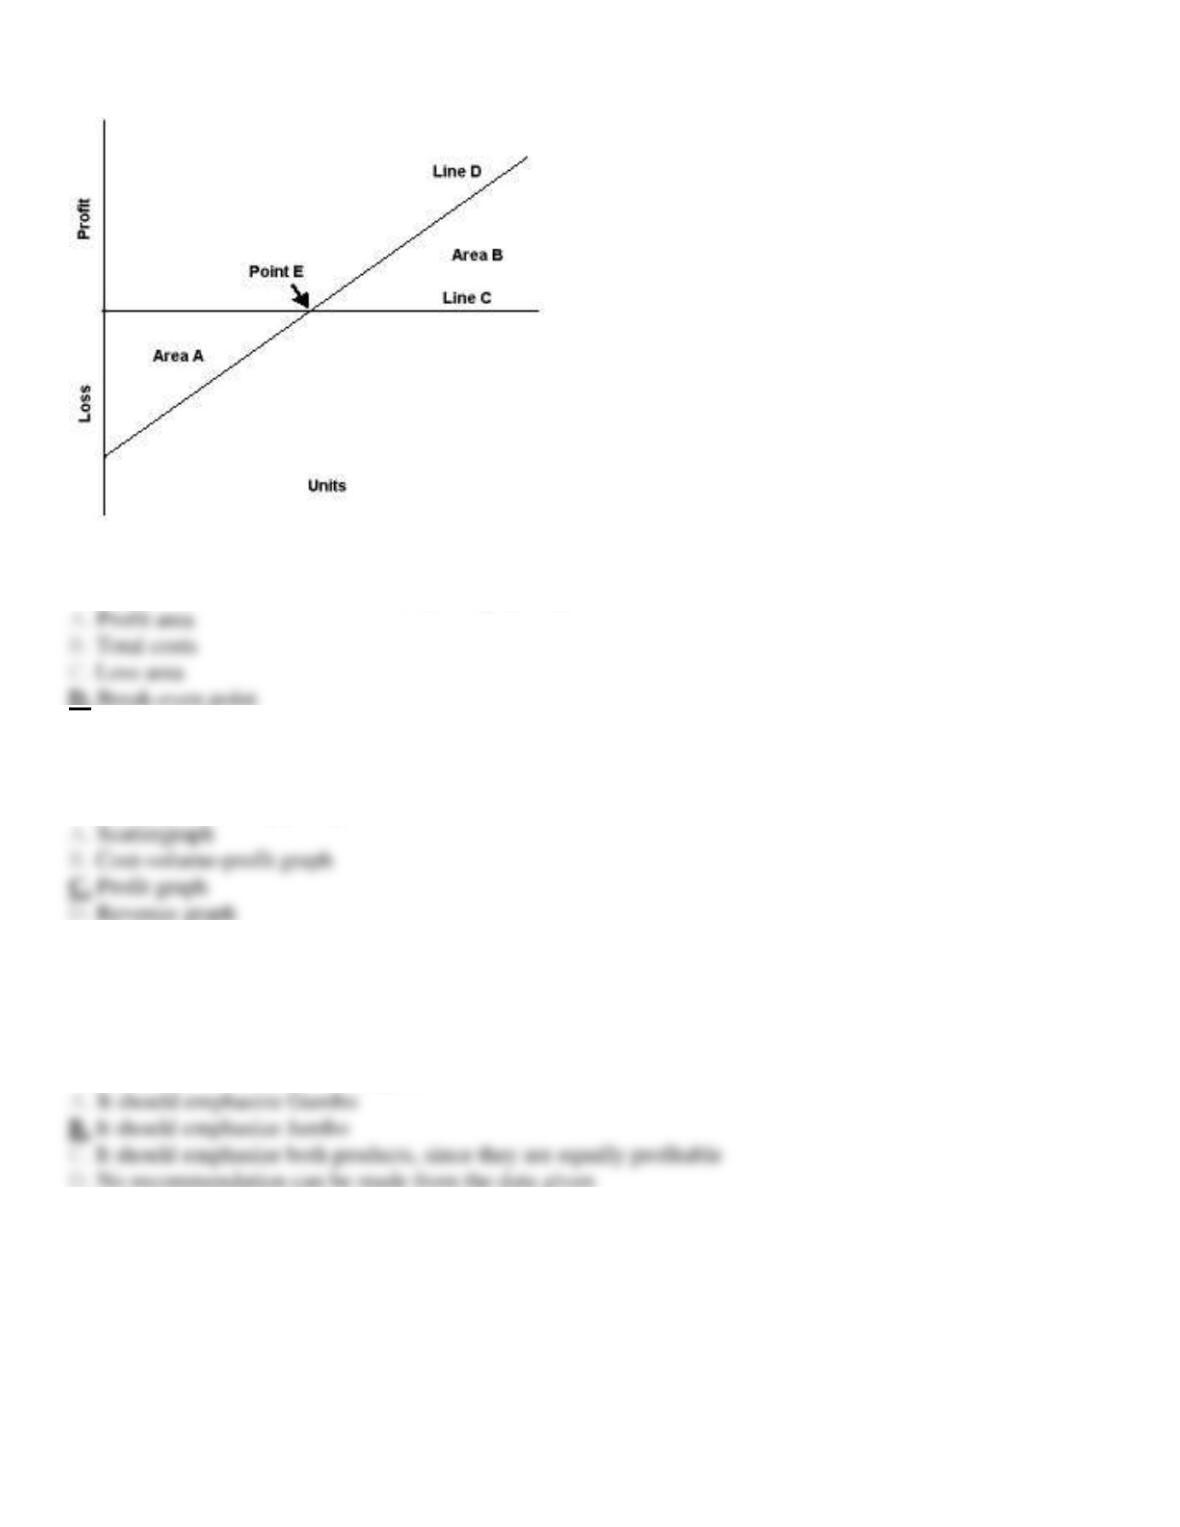
124. Exhibit 21-8
Use the profit graph below to answer the following question(s).
Refer to Exhibit 21-8. Point E on the profit graph represents the:
125. A graph that only plots profits and losses, and omits costs and revenues, is called a:
126. Jones Company sells two products, Gumbo and Jumbo. Gumbo has a 45% contribution margin and Jumbo
has a 55% contribution margin. Given these contribution margin percentages and assuming that other factors are
equal, what should Jones Company do?
127. Block Company sells three products, each with a different per-unit contribution margin. To compute Block
Company’s break-even point in units, it is necessary to know:
128. To maximize its profits, a company should pay the highest sales commissions on those products with the:
129. One method that a multi-product firm can employ to promote a high-contribution margin product is:
130. Sales mix refers to:
131. Total contribution margin will increase in a two-product firm if total units sold remain the same and:
132. McCammon Co. sells three products with the following sales and variable cost rates:
Product A
$250,000
30%
Product B
$200,000
40%
Product C
$150,000
45%

What is McCammon’s total contribution margin ratio at the current sales mix?
133. Johnston Co. sells three products with the following sales and variable cost rates:
Product 1
$12,000
61%
Product 2
$19,000
45%
Product 3
$ 8,000
70%
Assume that Johnston’s total fixed costs are $9,000. Using the current sales mix, what is Johnston’s break-even point?
134. Exhibit 21-9
Stella Signs sells two different products. Following are the monthly revenues and costs:
Sales
Variable
Revenue
Costs
Product A
$116,000
$ 40,600
Product B
$189,000
$103,950
Refer to Exhibit 21-9. Determine the total contribution margin ratio at the current sales mix.
135. Exhibit 21-9
Stella Signs sells two different products. Following are the monthly revenues and costs:
Sales
Variable
Revenue
Costs
Product A
$116,000
$ 40,600
Product B
$189,000
$103,950
Refer to Exhibit 21-9. Assume that Stella has fixed costs of $65,000. Using the current sales mix, what is Stella’s break-even point?
136. Maintaining low fixed costs and high variable costs rather than high fixed costs and low variable costs:
137. Operating leverage deals primarily with the relationship between:
138. As compared to a company with a low operating leverage, a company with a high operating leverage will:
139. Which of the following types of firms would typically have the lowest level of operating leverage?
140. Operating leverage is:
141. The following information is given for Kooskia Company:
Total
Variable
Units Produced
Fixed Costs
Costs per Unit
0-500
$20,000
$40
501-1,000
$27,000
$40
1,001-1,500
$34,000
$50
1,501-2,000
$41,000
$50
Compute the following items for Kooskia Company:
a.
What is the fixed cost per unit when 400 units are produced?
b.
What is the total variable cost when 300 units are produced?
c.
What is the fixed cost per unit when 1,250 units are produced?
d.
What is the total variable cost when 1,000 units are produced?
e.
What is the total cost per unit when 1,600 units are produced?
d.
What is the total cost when 900 units are produced?
142. Using the following information for Palmer Company, analyze the cost behavior between the total costs
and units produced for the six-month period. Use the high-low method to identify the variable cost rate and the
fixed cost portion of total costs.
Units
Month
Total Costs
Produced
January
$80,000
400
February
58,750
275
March
78,125
390
April
65,000
325
May
81,850
415
June
68,750
345
Total Costs
Units
High point-May
$81,850
415
Low point-February
58,750
275
Difference
$23,100
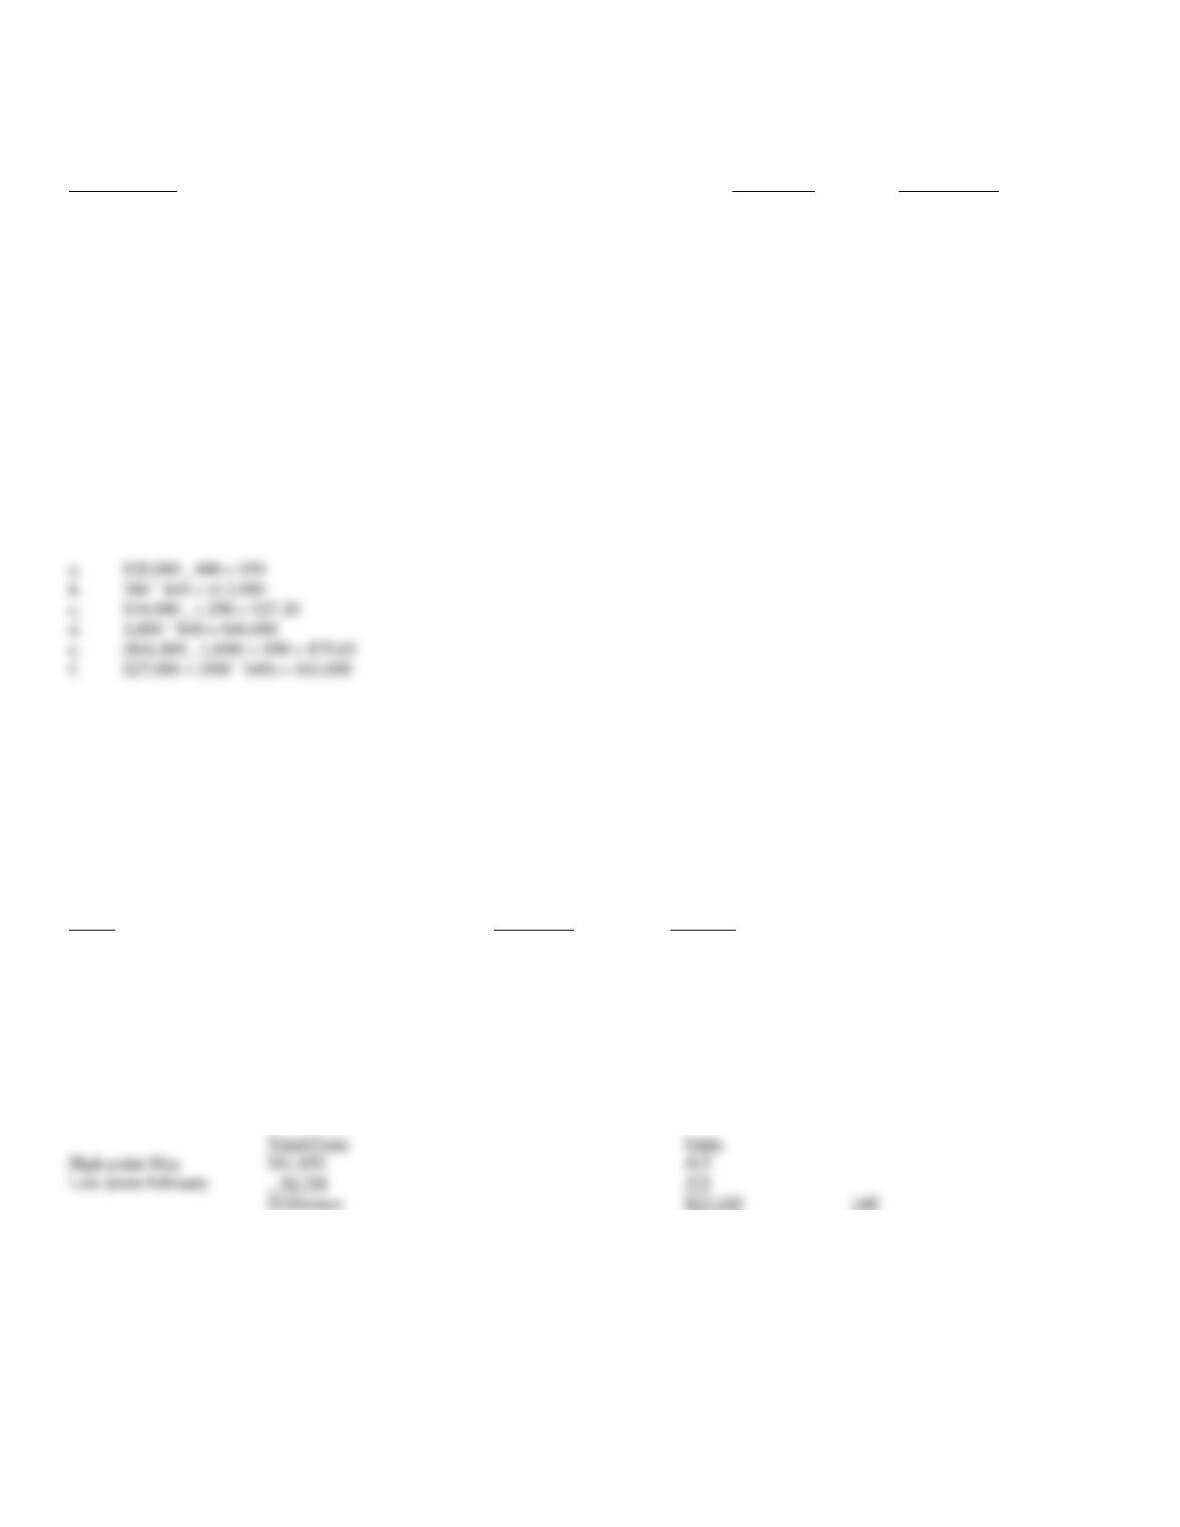
140
$20,000 ¸ 400 = $50
b.
300 ´ $40 = $12,000
c.
$34,000 ¸ 1,250 = $27.20
d.
1,000 ´ $40 = $40,000
($41,000 ¸ 1,600) + $50 = $75.63
$27,000 + (900 ´ $40) = $63,000
143. The following information has been compiled by the accounting department at Wallace Enterprises. The
manager, Thomas Hicks, wants you to calculate the variable cost rate and total fixed costs from the information
given. Mr. Hicks wants you to use the high-low method of analyzing these costs.
Total
Direct
Month
Maintenance Costs
Labor Hours
July
$190,000
38,400
August
160,000
30,000
September
280,000
60,000
October
260,000
52,000
November
130,000
25,000
December
210,000
44,000
Total
Direct
Maintenance Costs
Labor Hours
High point-September
$280,000
60,000
Low point-November
130,000
25,000
Difference
$150,000
35,000
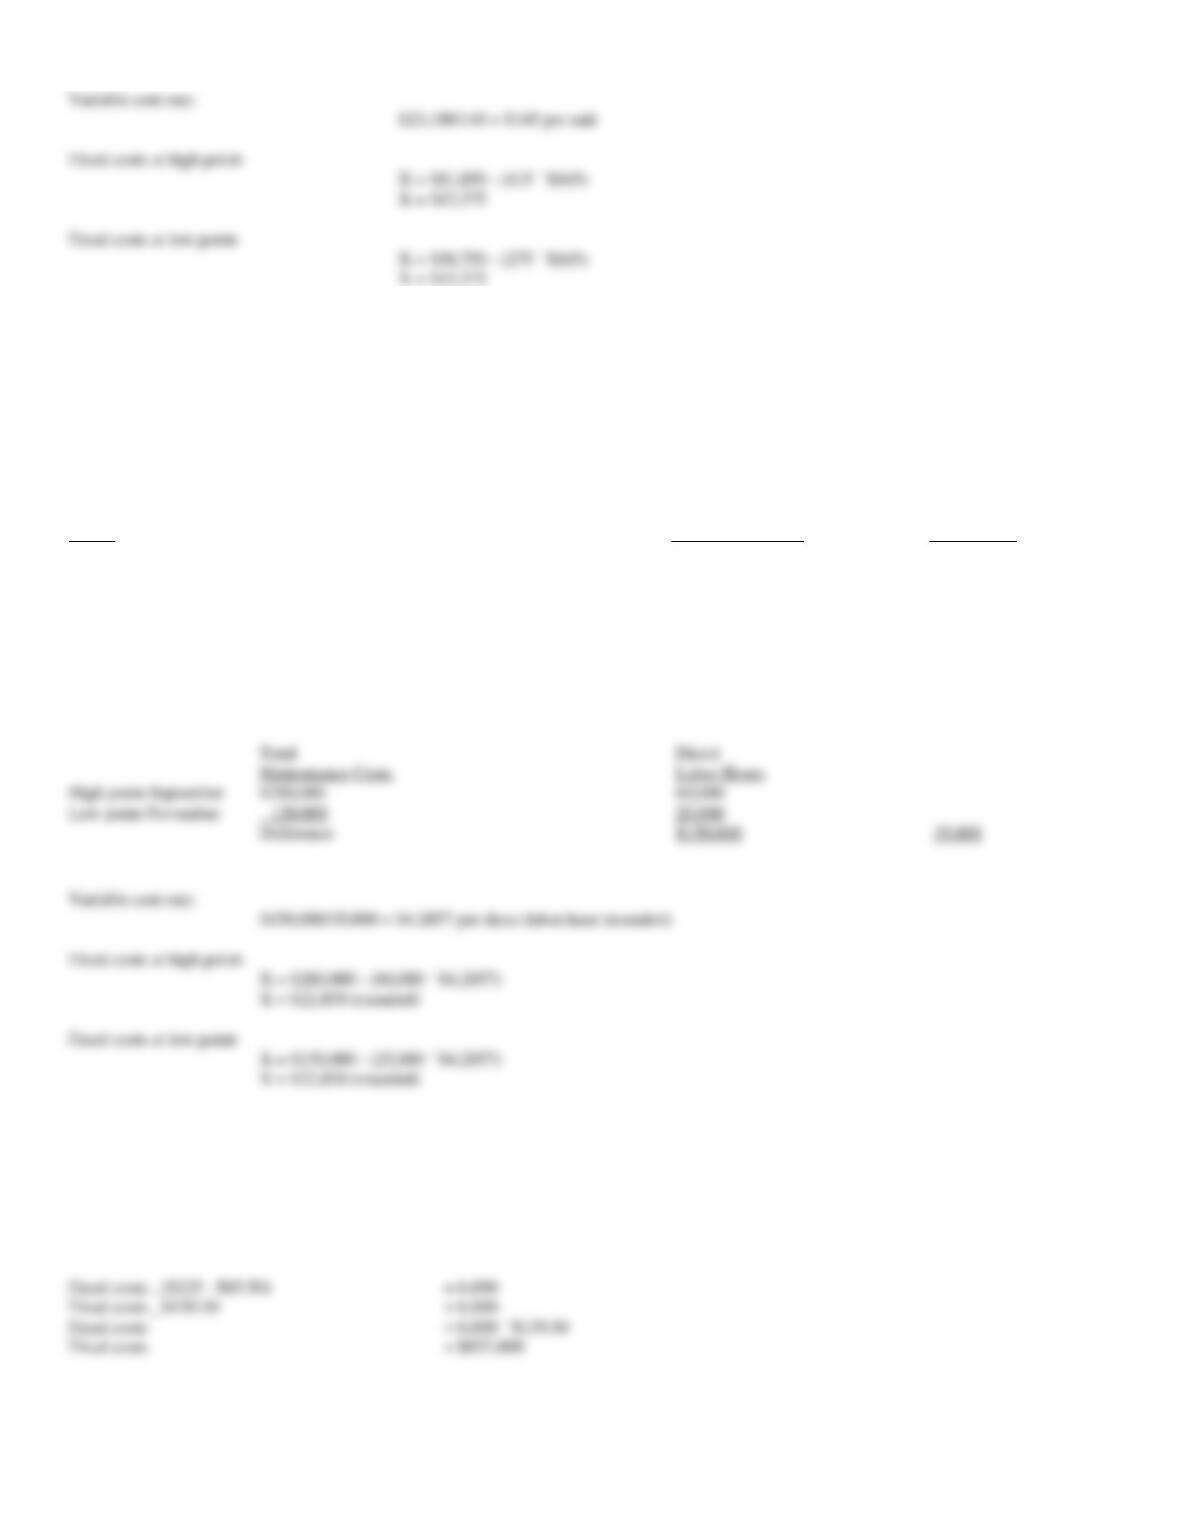
Variable cost rate:
Fixed costs at high point:
Fixed costs at low point:
144. Last month CMC Corporation had to sell 6,000 units to reach the break- even point. The selling price was
$225 per unit and variable costs were $85.50 per unit. What were fixed costs for the month?
Fixed costs ¸ ($225 – $85.50)
= 6,000
Fixed costs ¸ $139.50
= 6,000
Variable cost rate:
Fixed costs at high point:
X = $13,375
Fixed costs at low point:
X = $13,375
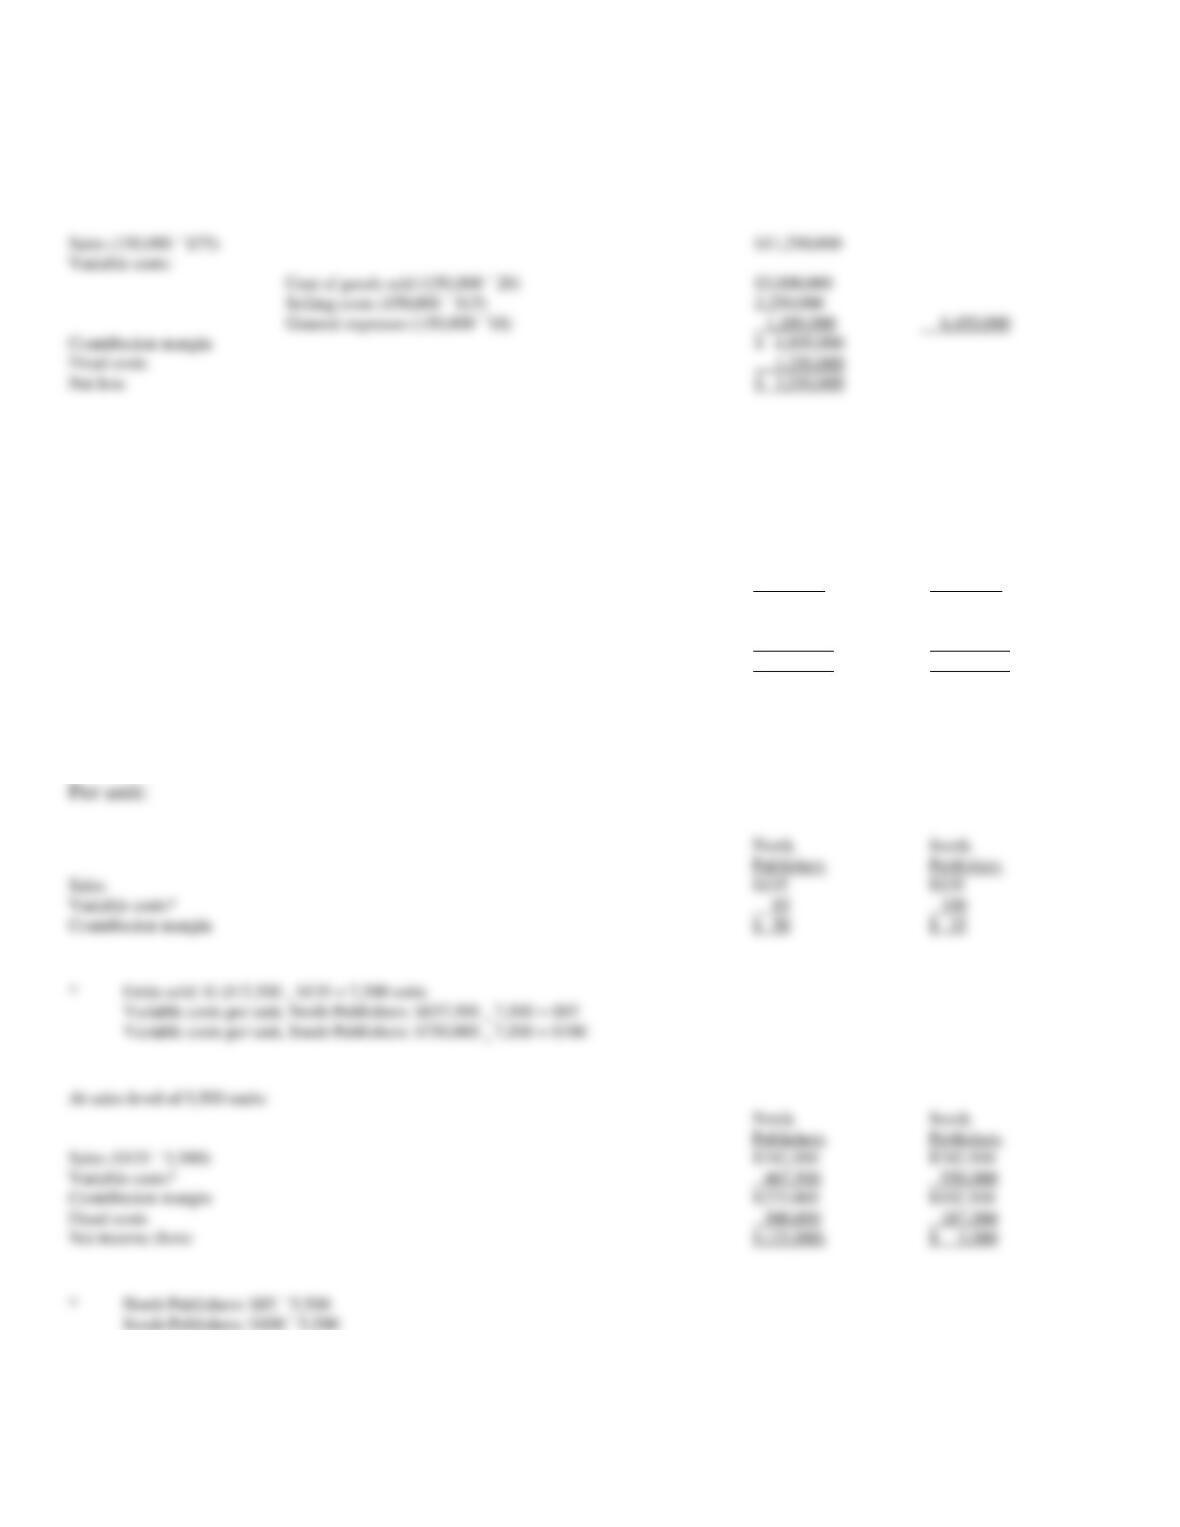
145. During the past year, United Memories sold 150,000 units. Each of these units was sold at a price of $75.
At the end of the year, the accounting department identified the costs per unit to be: $20 in materials, $15 for
selling costs, and $8 for general expenses. Fixed costs for the year were $1,250,000. The president of United
Memories wants to know what the contribution margin and net income were for the year.
146. The following data is available for North Publishers and South Publishers:
North
South
Publishers
Publishers
Sales ($135 per unit)
$1,012,500
$1,012,500
Variable costs
637,500
750,000
Fixed costs
300,000
187,500
Net income
$ 75,000
$ 75,000
What will be the profit or loss for each company if the sales level drops to 5,500 units?
North
South
Publishers
Publishers
Sales
$135
$135
Variable costs*
100
Contribution margin
$ 50
$ 35
*
Units sold: $1,012,500 ¸ $135 = 7,500 units
Variable costs per unit, North Publishers: $637,500 ¸ 7,500 = $85
Variable costs per unit, South Publishers: $750,000 ¸ 7,500 = $100
North
South
Publishers
Publishers
Sales ($135 ´ 5,500)
$742,500
$742,500
Variable costs*
467,500
550,000
Contribution margin
$275,000
$192,500
Fixed costs
300,000
187,500
Net income (loss)
$ (25,000)
$ 5,000
*
North Publishers: $85 ´ 5,500
South Publishers: $100 ´ 5,500
Sales (150,000 ´ $75)
$11,250,000
Variable costs:
Cost of goods sold (150,000 ´ 20)
$3,000,000
Selling costs (150,000 ´ $15)
2,250,000
General expenses (150,000 ´ $8)
1,200,000
6,450,000
Contribution margin
$ 4,800,000
Fixed costs
1,250,000
Net loss
$ 3,550,000
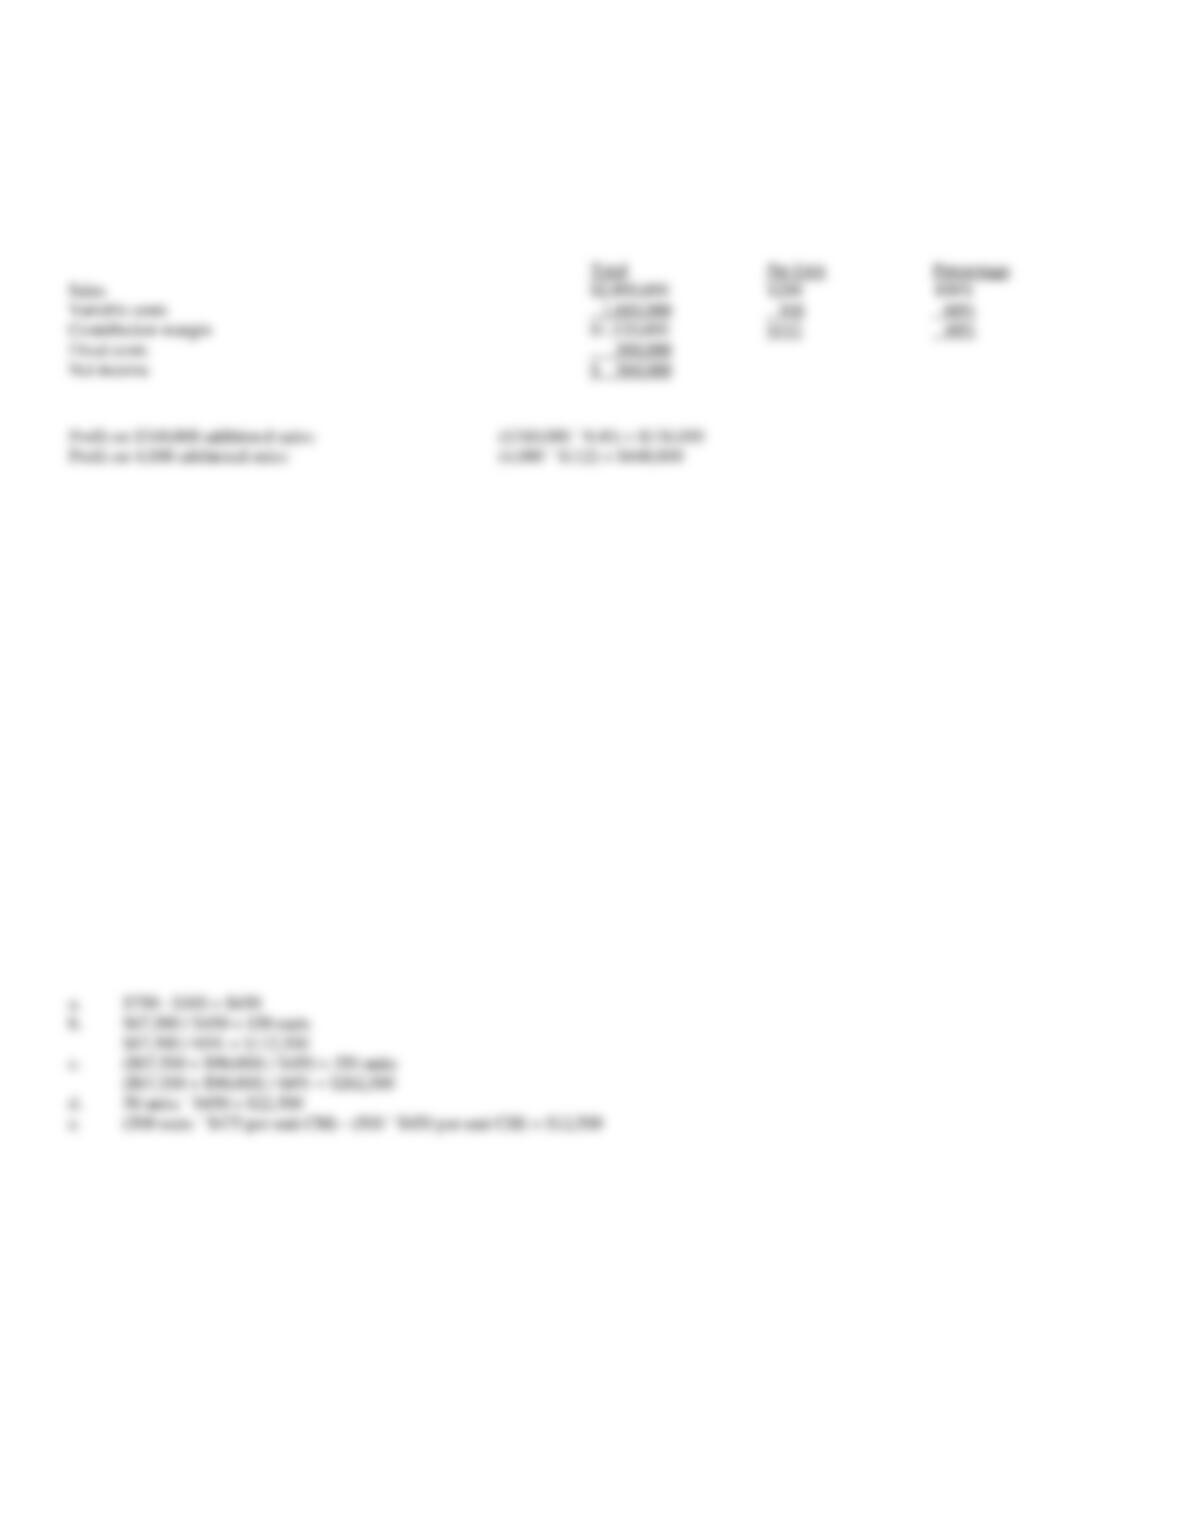
147. Winslow Company sold 10,000 swing sets this past year at $280 each. The company incurred expenses of
$560,000 for rent, administrative salaries, and insurance for the building. The cost per unit for Winslow was
$168. The CEO, Ms. Dunlop, wants to know what the contribution margin was for the year as a percent of sales,
how much profit would be earned with an additional $340,000 in sales, and what the profit would be on an
additional 4,000 units in sales.
148. Rockin’ H makes and sells saddles. The following information is from Rockin’ H’s 2012 records:
Sales price per unit
$ 750
Variable cost per unit
$ 300
Total fixed costs
$67,500
Sales volume in units
500
Rockin’ H expects all the information above to be the same in 2013. For 2013, determine:
a.
Rockin’ H’s unit contribution margin.
b.
Rockin’ H’s break-even point in units and sales dollars.
c.
The sales volume, in units and dollars, to achieve a target profit of $90,000.
d.
If Rockin’ H can increase sales by 50 units above the 2012 sales, what would be the increase in net income (from the 2012 net income)?
e.
If Rockin’ H can reduce variable costs by $25 and sales volume remains at the 2012 level, what would be the increase in net income (from
the 2012 net income)?
a.
$750 – $300 = $450
b.
$67,500 / $450 = 150 units
$67,500 / 60% = $112,500
c.
($67,500 + $90,000) / $450 = 350 units
($67,500 + $90,000) / 60% = $262,500
d.
50 units ´ $450 = $22,500
e.
(500 units ´ $475 per unit CM) – (500 ´ $450 per unit CM) = $12,500
Total
Per Unit
Percentage
Sales
$2,800,000
$280
100%
Variable costs
1,680,000
168
60%
Contribution margin
$1,120,000
$112
40%
Fixed costs
560,000
Net income
$ 560,000
Profit on $340,000 additional sales:
($340,000 ´ 0.40) = $136,000
Profit on 4,000 additional units:
(4,000 ´ $112) = $448,000
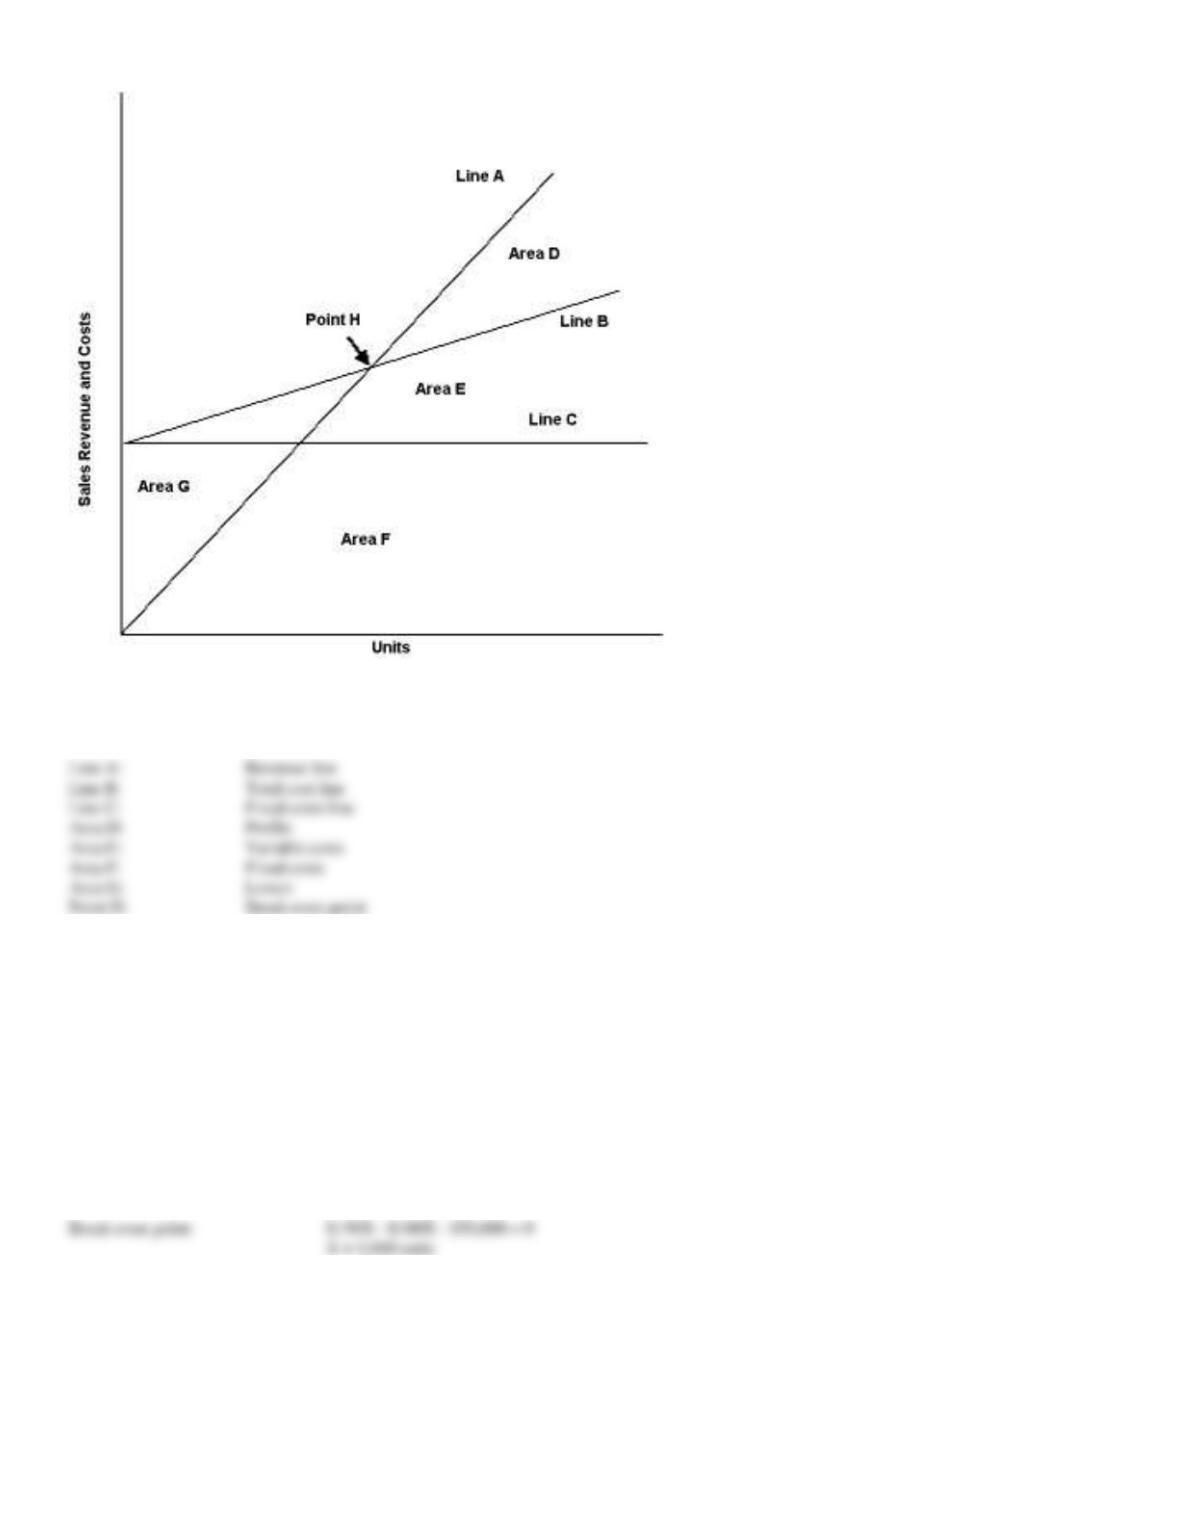
149. Identify the indicated lines, areas, and point on the following graph.
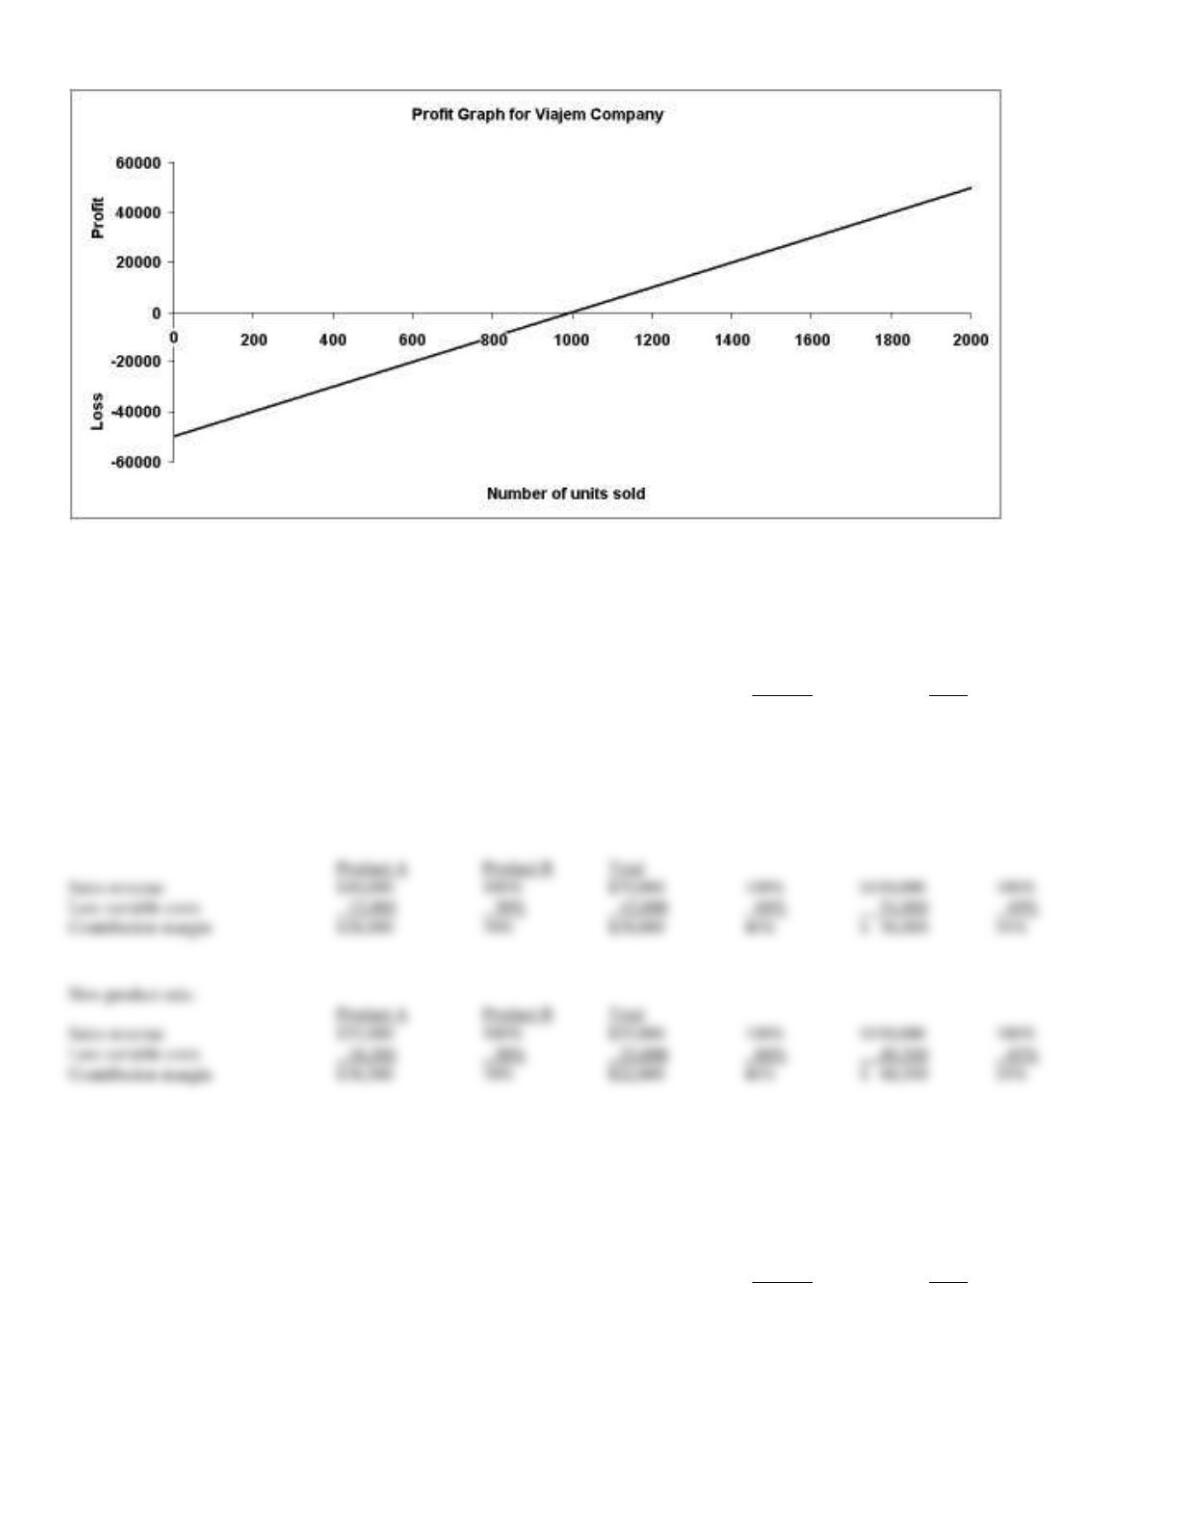
150. Given the following information, draw a profit graph for Viajem Company.
Fixed costs:
$50,000
Variable costs per unit:
$ 100
Sales revenue per unit:
$ 150
Break-even point:
$150X – $100X – $50,000 = 0
Line A:
Revenue line
Line B:
Total cost line
Line C:
Fixed costs line
Area D:
Profits
Area F:
Fixed costs
Area G:
Losses
Point H:
Break-even point
151. Slaby Motors sells two different products. Following are the monthly revenues and costs:
Sales
Variable
Revenue
Costs
Product A
$40,000
$12,000
Product B
$70,000
$42,000
Determine the total contribution margin ratio at the current sales mix and the total contribution margin ratio if the sales mix changes to 50% for each
product. (Assume that total sales revenue and variable cost rate stay the same.)
152. Slaby Motors sells two different products. Following are the monthly revenues and costs:
Sales
Variable
Revenue
Costs
Product A
$40,000
$12,000
Product B
$70,000
$42,000
Product A
Product B
Total
Sales revenue
$40,000
100%
$70,000
100%
$110,000
100%
Less variable costs
12,000
30%
42,000
60%
54,000
49%
Contribution margin
$28,000
70%
$28,000
40%
$ 56,000
51%
Product A
Product B
Total
Sales revenue
$55,000
100%
$55,000
100%
$110,000
100%
Less variable costs
16,500
30%
33,000
60%
49,500
45%
Contribution margin
$38,500
70%
$22,000
40%
$ 60,500
55%
If fixed costs are equal to $40,000, determine the break-even point at the current sales mix and the break-even point if the sales mix changes to 50%
for each product. (Assume that total sales revenue and variable cost rate stay the same.)