90. Exhibit 21-5
The following is a partial income statement for Duncan Corporation for 2011:
Duncan Corporation
Projected Income Statement
For the Year Ended December 31,
2011
Sales revenue (750 units at $20)
$15,000
Manufacturing cost of goods sold:
Direct materials used
$2,250
Direct labor
2,100
Variable manufacturing overhead
2,650
Fixed manufacturing overhead
750
7,750
Gross margin
$ 7,250
Selling expenses:
Variable costs
$1,100
Fixed costs
950
Administrative expenses:
Variable costs
900
Fixed costs
620
Total selling and administrative expenses
3,570
Operating income
$ 3,680
Refer to Exhibit 21-5. How many units of its product will Duncan Corporation have to sell to break even?
91. Exhibit 21-5
The following is a partial income statement for Duncan Corporation for 2011:
Duncan Corporation
Projected Income Statement
For the Year Ended December 31,
2011
Sales revenue (750 units at $20)
$15,000
Manufacturing cost of goods sold:
Direct materials used
$2,250
Direct labor
2,100
Variable manufacturing overhead
2,650
Fixed manufacturing overhead
750
7,750
Gross margin
$ 7,250
Selling expenses:
Variable costs
$1,100
Fixed costs
950
Administrative expenses:
Variable costs
900
Fixed costs
620
Total selling and administrative expenses
3,570
Operating income
$ 3,680
Refer to Exhibit 21-5. What will be Duncan Corporation’s operating income if sales volume increases by 40 percent?
92. As activity level increases within the relevant range, per-unit fixed costs usually will:
93. As activity level increases within the relevant range, total variable costs usually will:
94. When all other factors remain constant, which of the following is true?
95. When other factors remain constant, a decrease in fixed costs:
96. When other factors remain constant, an increase in variable costs:
97. When other factors remain constant, a decrease in sales price:
98. If two firms have the same sales prices for their merchandise once fixed costs are covered, the firm with a
higher variable cost rate will have:
99. An increase in sales price would:
100. If the fixed costs relative to a specific product increase while the variable costs and sales price remain
constant, the break-even point will:
101. Increasing the selling price and decreasing sales volume will increase profit if:
102. As fixed costs increase, the break-even point in units will:
103. A company’s break-even point would change if there were an increase in:
104. At a break-even point of 600 units sold, the variable costs were $600 and the fixed costs were $300. What
will the sale of each additional unit contribute to profit before income taxes?
105. Company X and Company Y each have a break-even point of 2,000 units. If Company X has higher fixed
costs but lower variable costs, what will be the effect of an increase in sales volume, for both companies, to
2,200 units?
106. If a company’s total fixed costs decreased by $6,000 and its contribution margin increased by $12,000, net
income would:
107. Collins Co. earned a profit of $2,000 in January. The company has estimated that sales will increase by
$13,500 in February. Assume that fixed costs for January were $3,000 (and are not expected to change) and the
variable cost ratio is 40%. What is the expected profit for the next month?
108. After the break-even point is reached, a firm that has a per-unit contribution margin of $20 will have a
$500 increase in profits when sales increase by:
109. Stanley Company manufactures and sells one product for $200 per unit. The variable costs per unit are
$140, and monthly total fixed costs are $7,500. Last month Stanley sold 100 units and expects sales to remain
110. Everclean Company cleans draperies. It charges $90 to clean a full-size drape, and its variable and fixed
costs are $55 per drape and $10,000 per year, respectively. Given these data, if Everclean’s variable costs were
reduced to $50 per drape, how many drapes would the firm have to clean to break even?
111. Everclean Company cleans draperies. It charges $90 to clean a full-size drape, and its variable and fixed
costs are $55 per drape and $10,000 per year, respectively. Given these data, if Everclean’s fixed costs increased
to $15,000, how many drapes must the firm clean to earn $60,000?
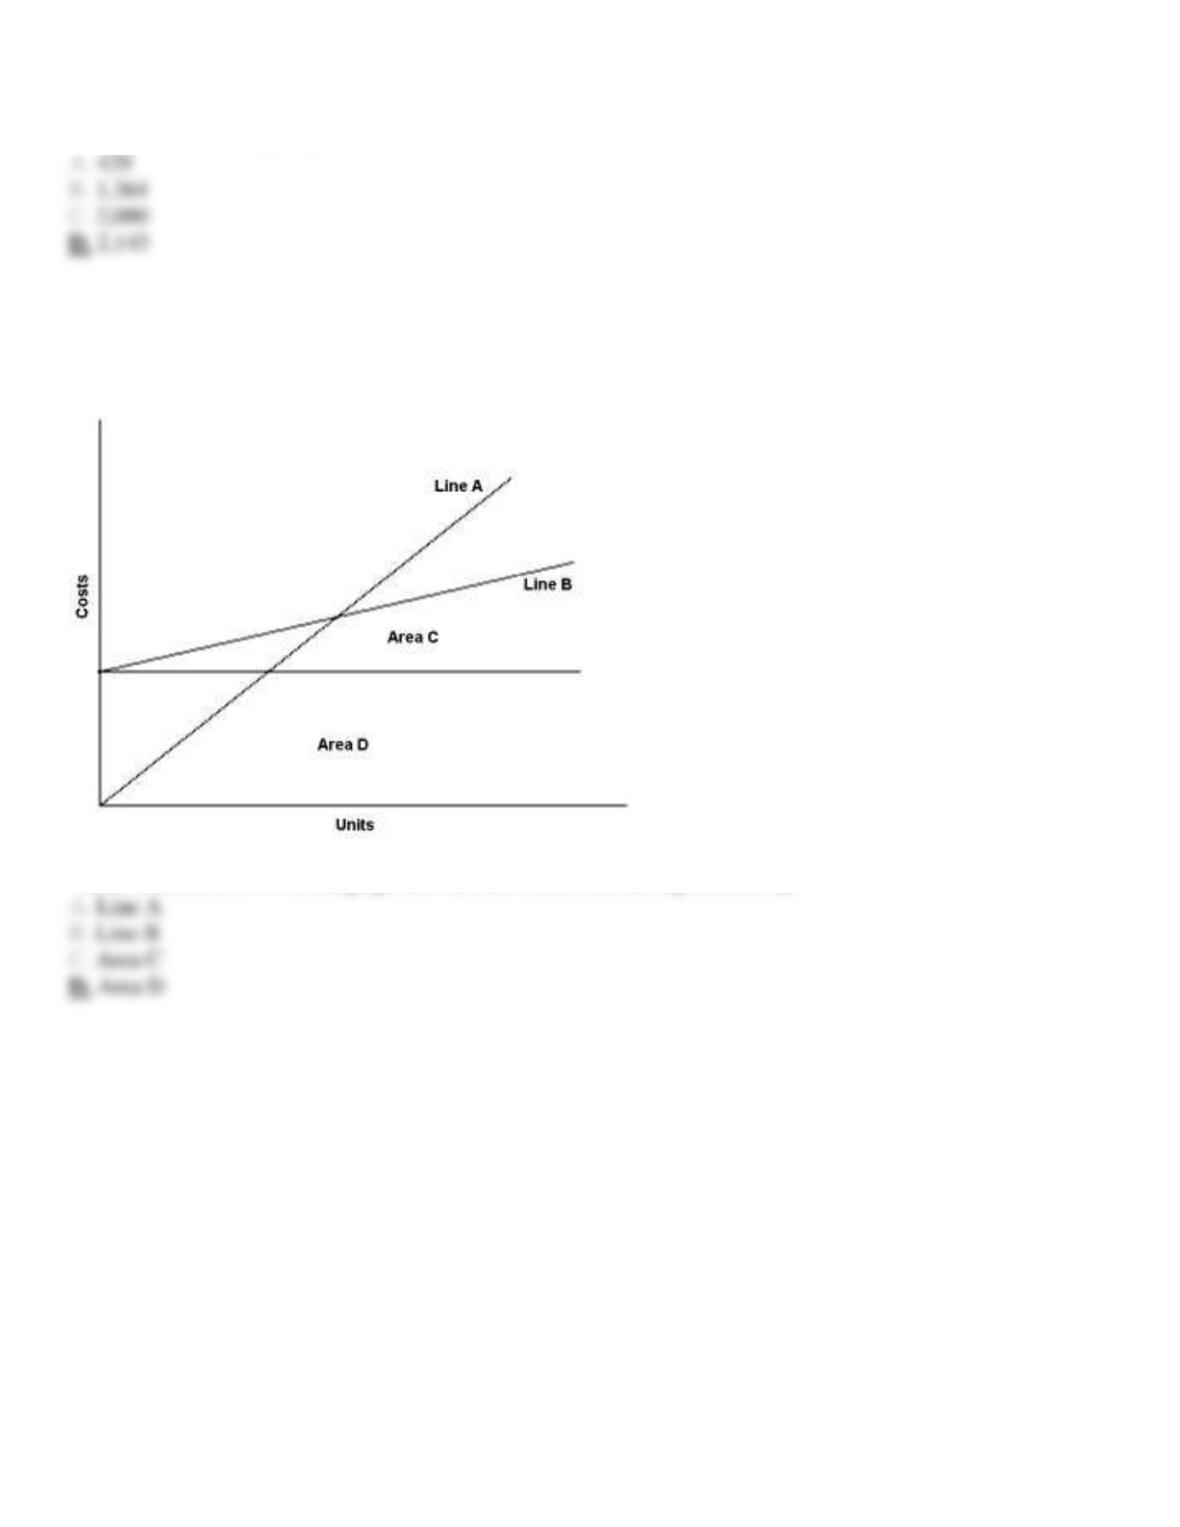
112. Exhibit 21-6
The graph below illustrates various cost behavior patterns in XYZ Company.
Refer to Exhibit 21-6. In the graph above, total fixed costs are represented by:
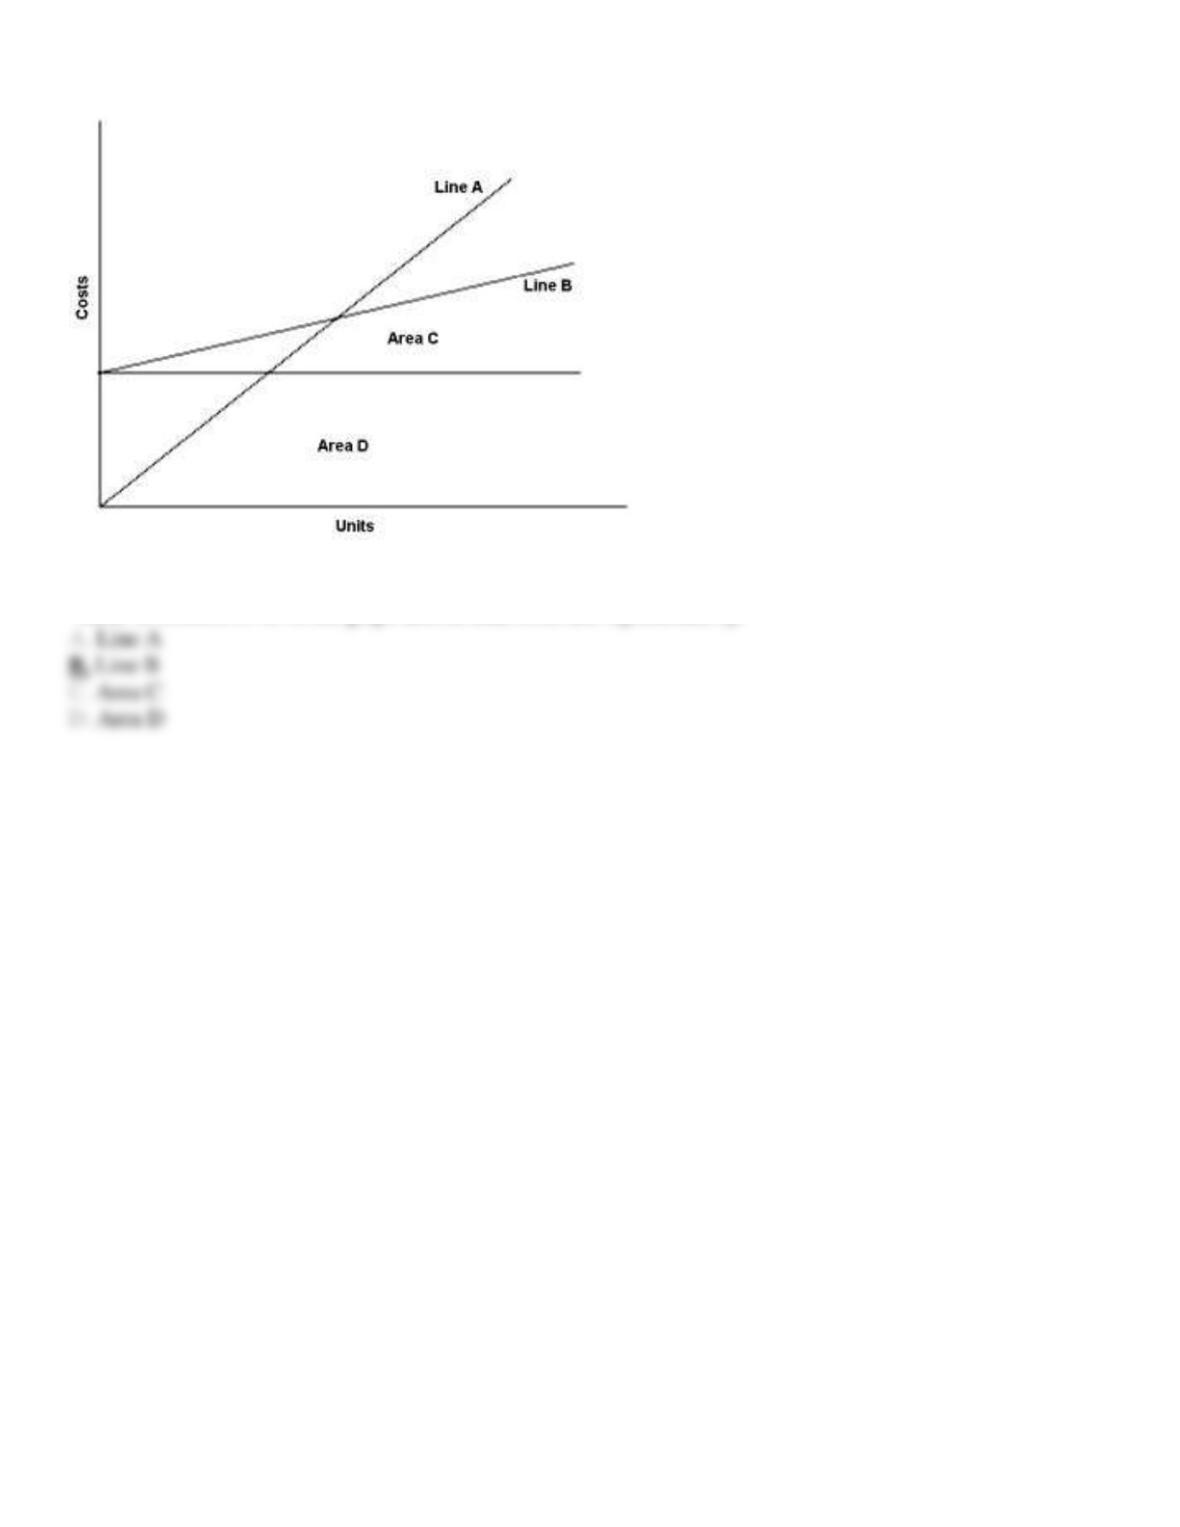
113. Exhibit 21-6
The graph below illustrates various cost behavior patterns in XYZ Company.
Refer to Exhibit 21-6. In the graph above, total costs are represented by:
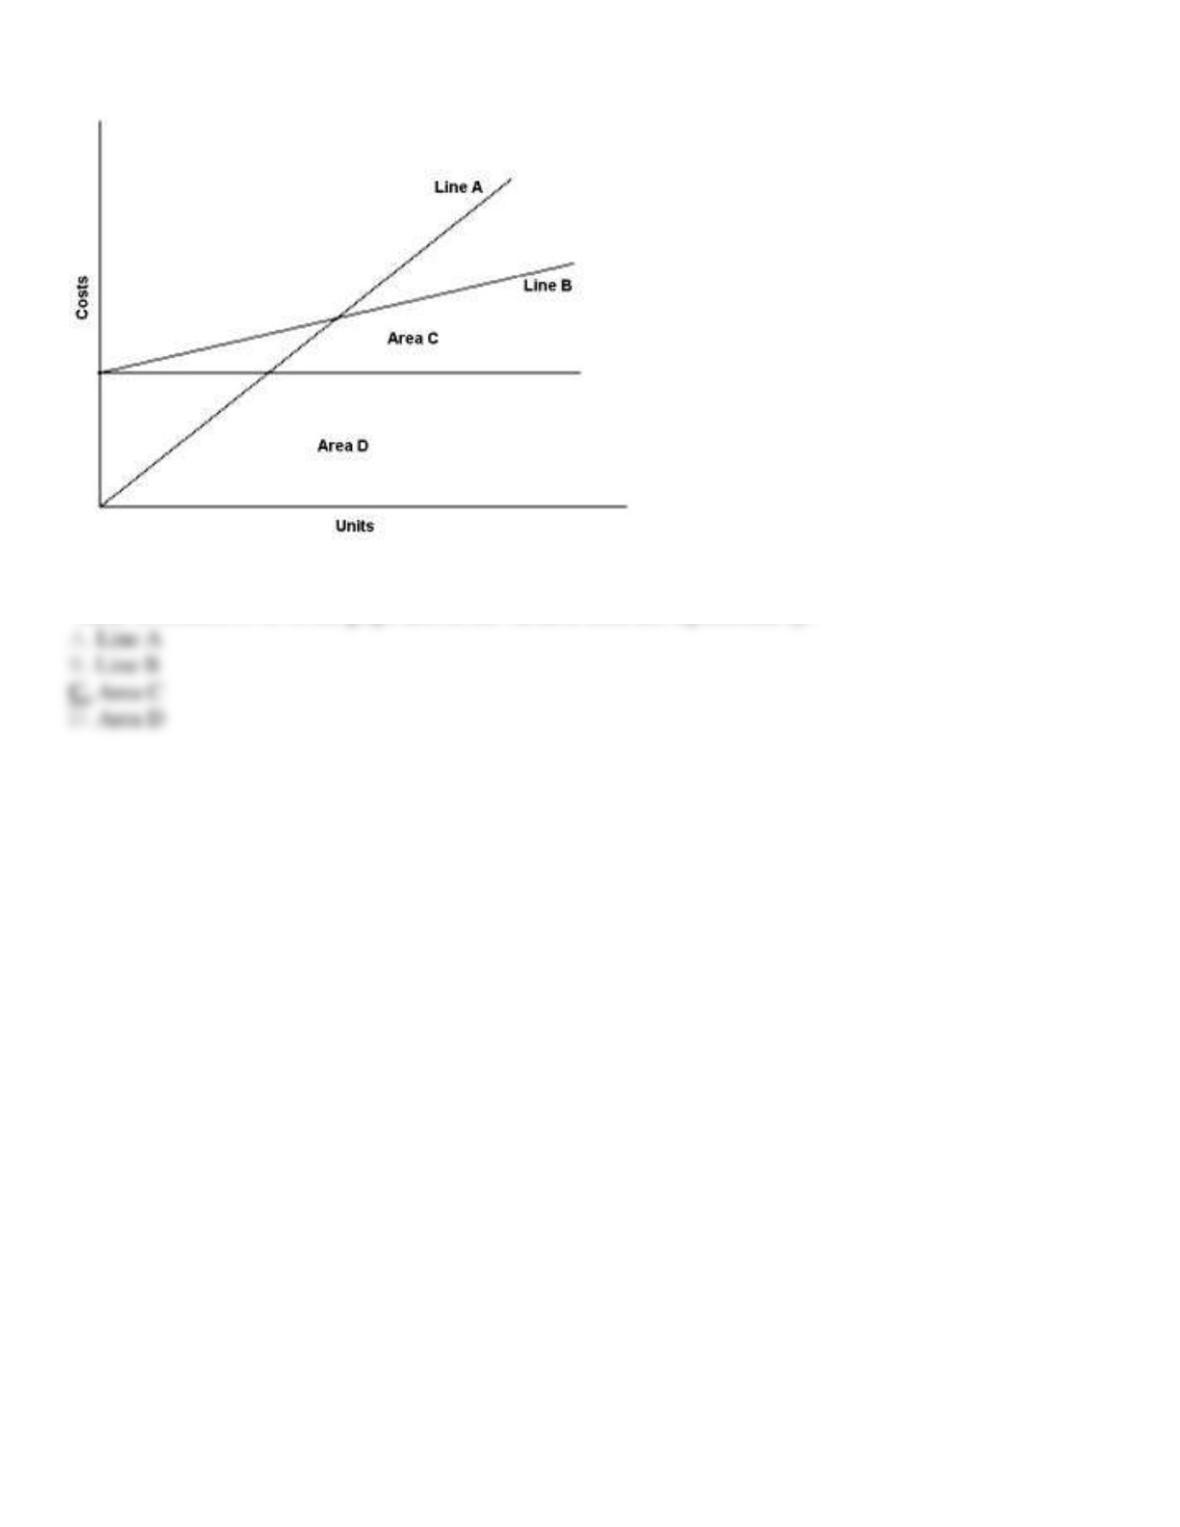
114. Exhibit 21-6
The graph below illustrates various cost behavior patterns in XYZ Company.
Refer to Exhibit 21-6. In the graph above, the variable costs are represented by:
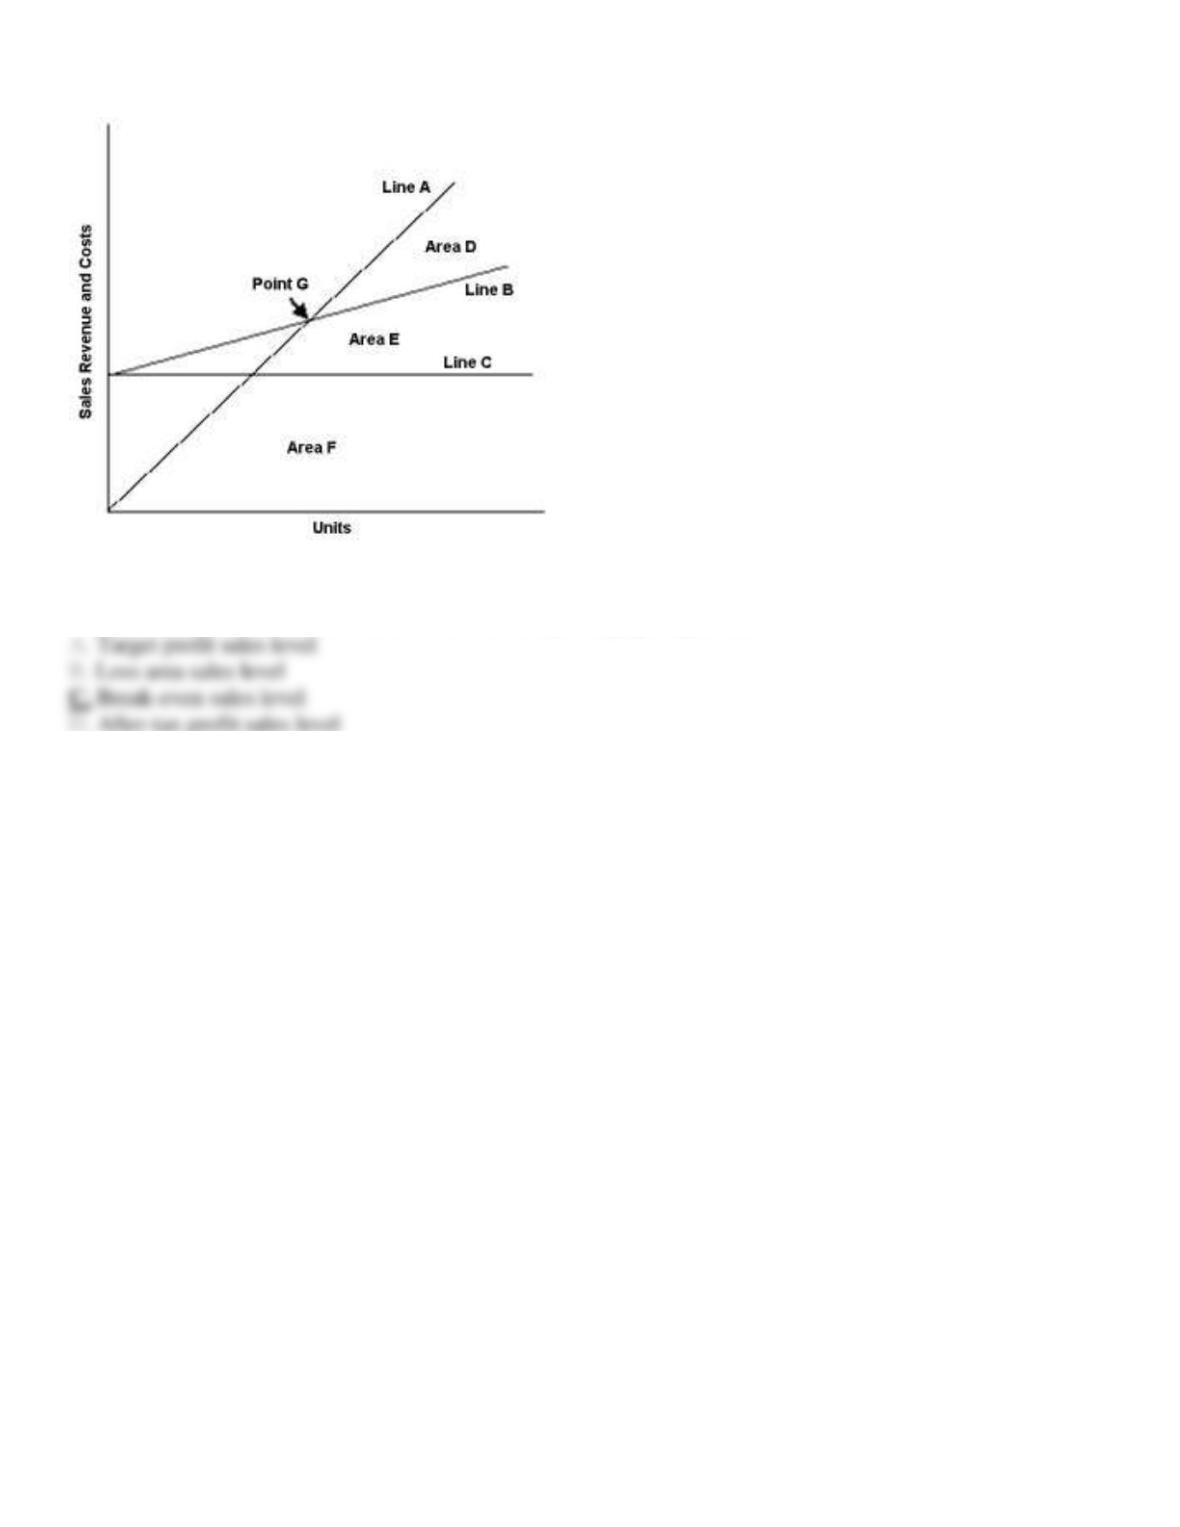
115. Exhibit 21-7
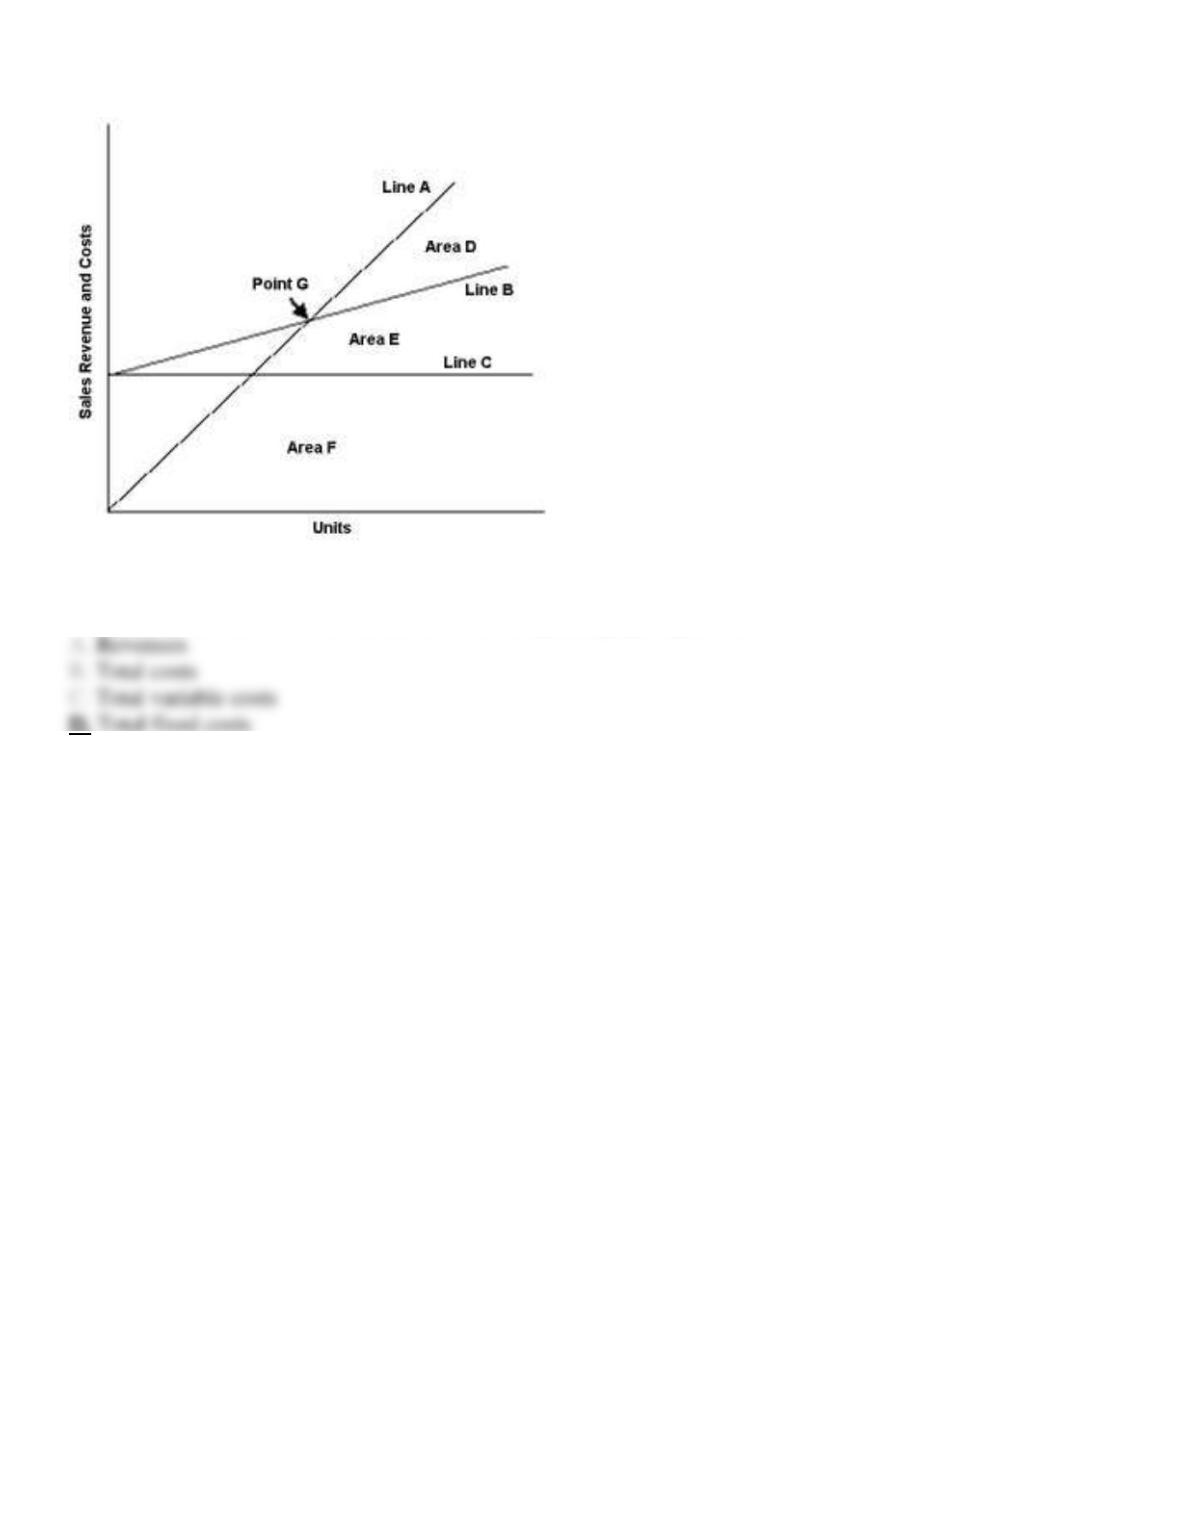
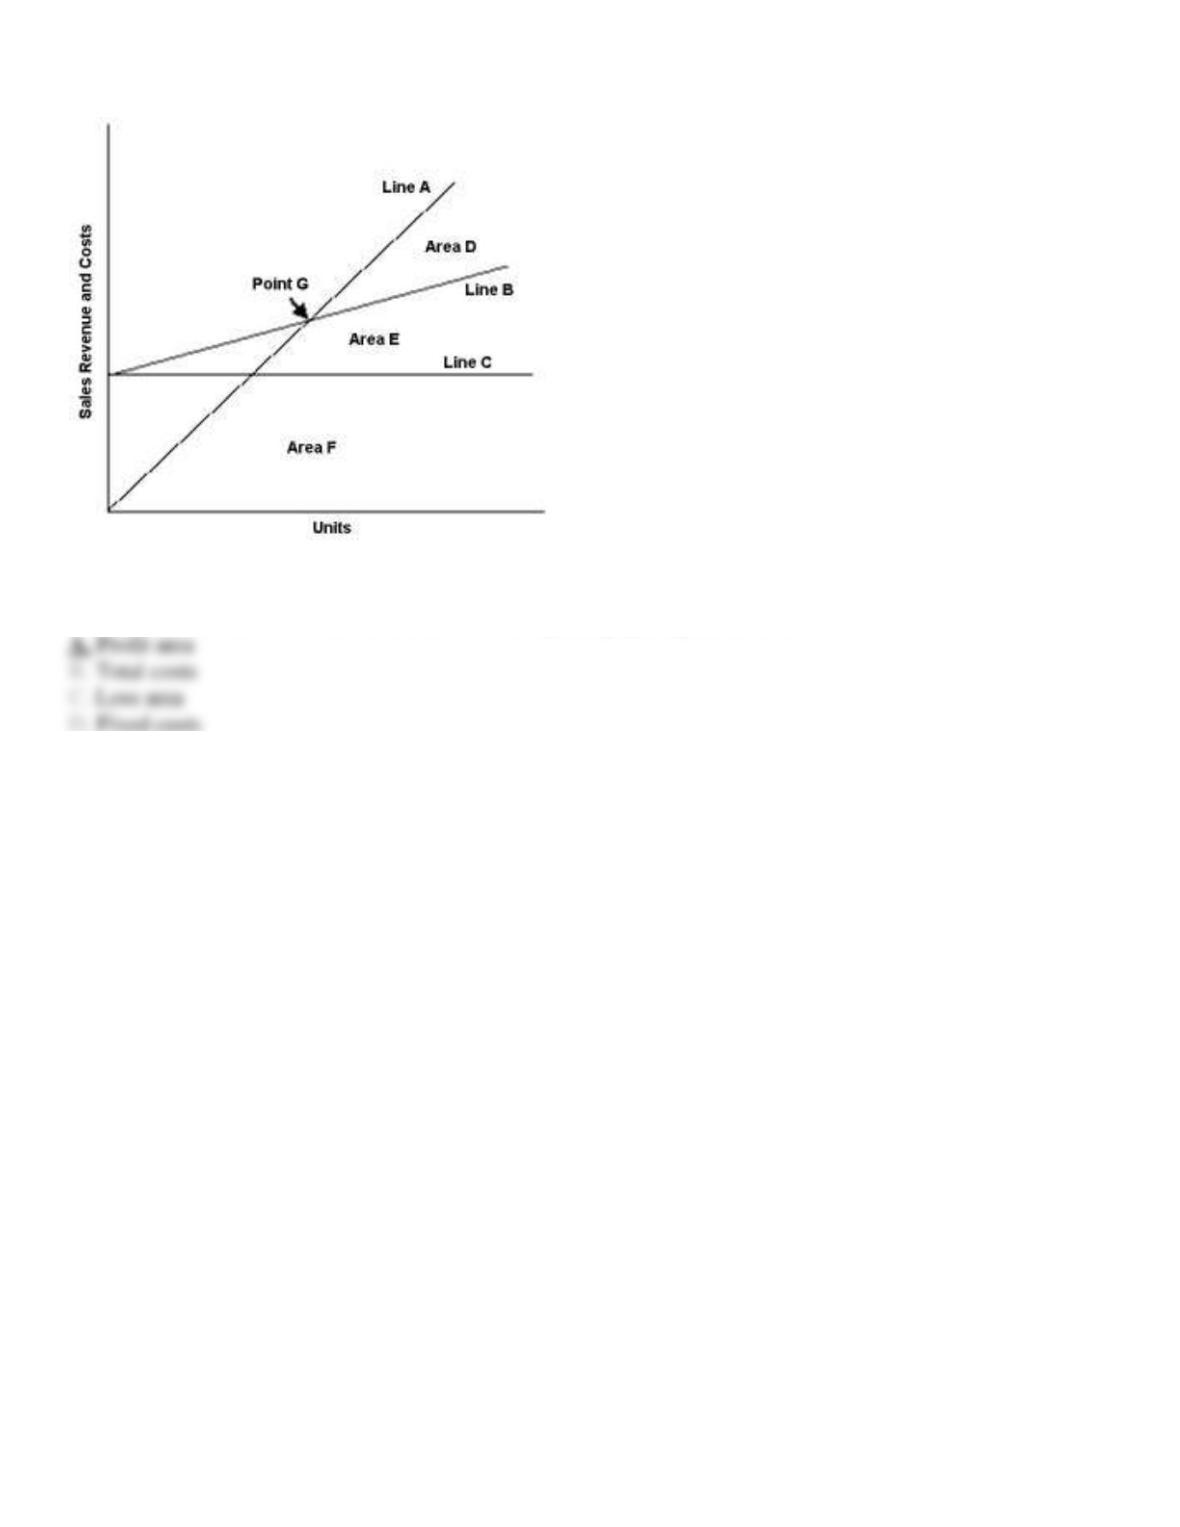
Use the cost-volume-profit graph below to answer the following question(s).
Refer to Exhibit 21-7. Point G on the cost-volume-profit graph represents the:
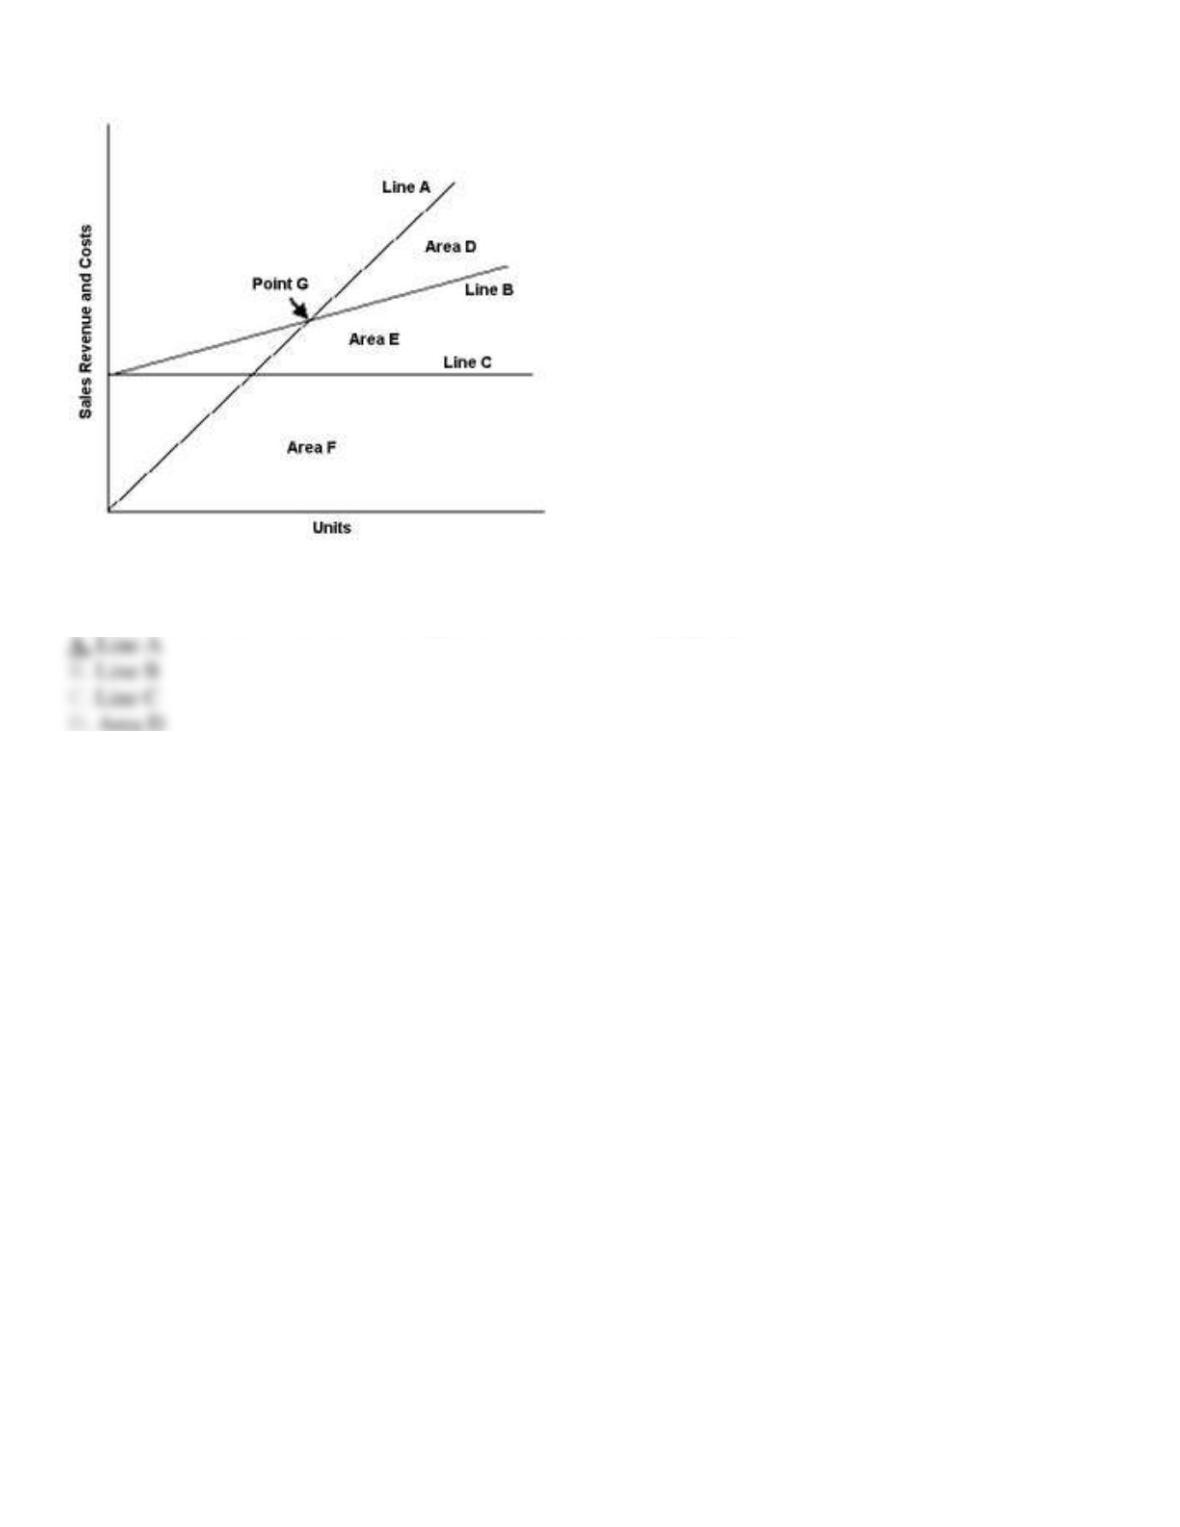
116. Exhibit 21-7
Use the cost-volume-profit graph below to answer the following question(s).
Refer to Exhibit 21-7. Revenues are represented on the C-V-P graph by:
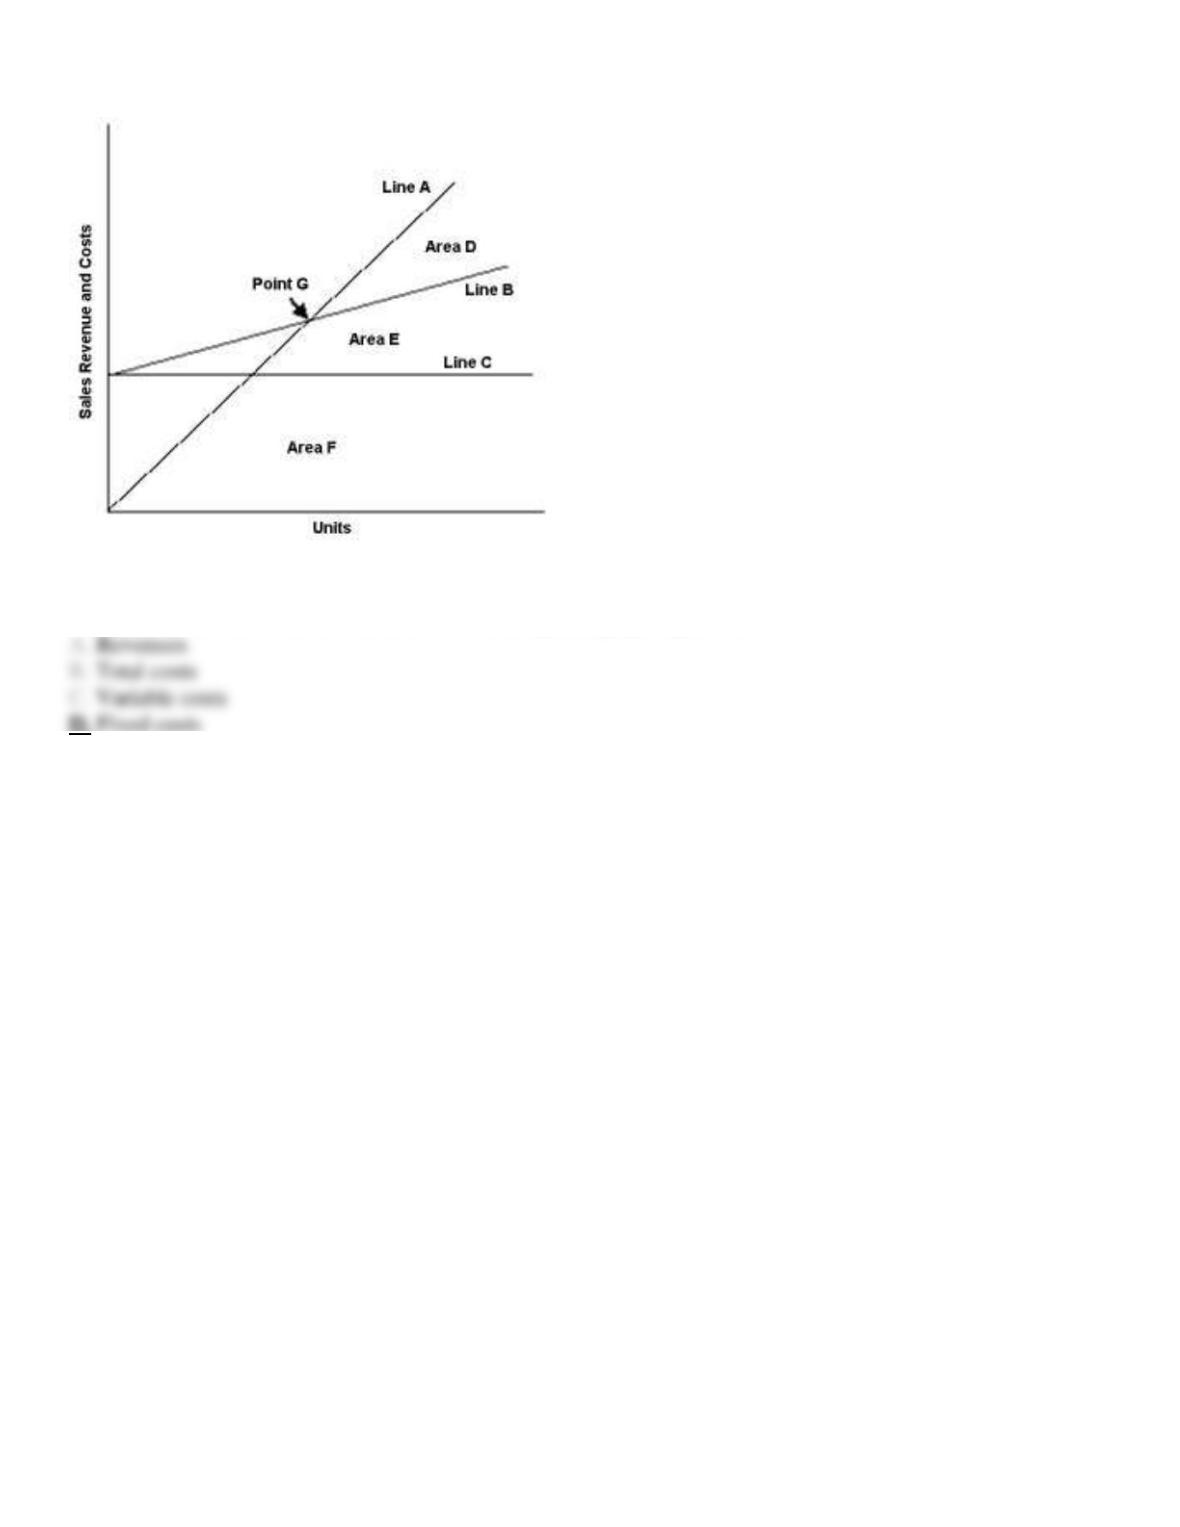
117. Exhibit 21-7
Use the cost-volume-profit graph below to answer the following question(s).
Refer to Exhibit 21-7. Line C on the cost-volume-profit graph represents the:
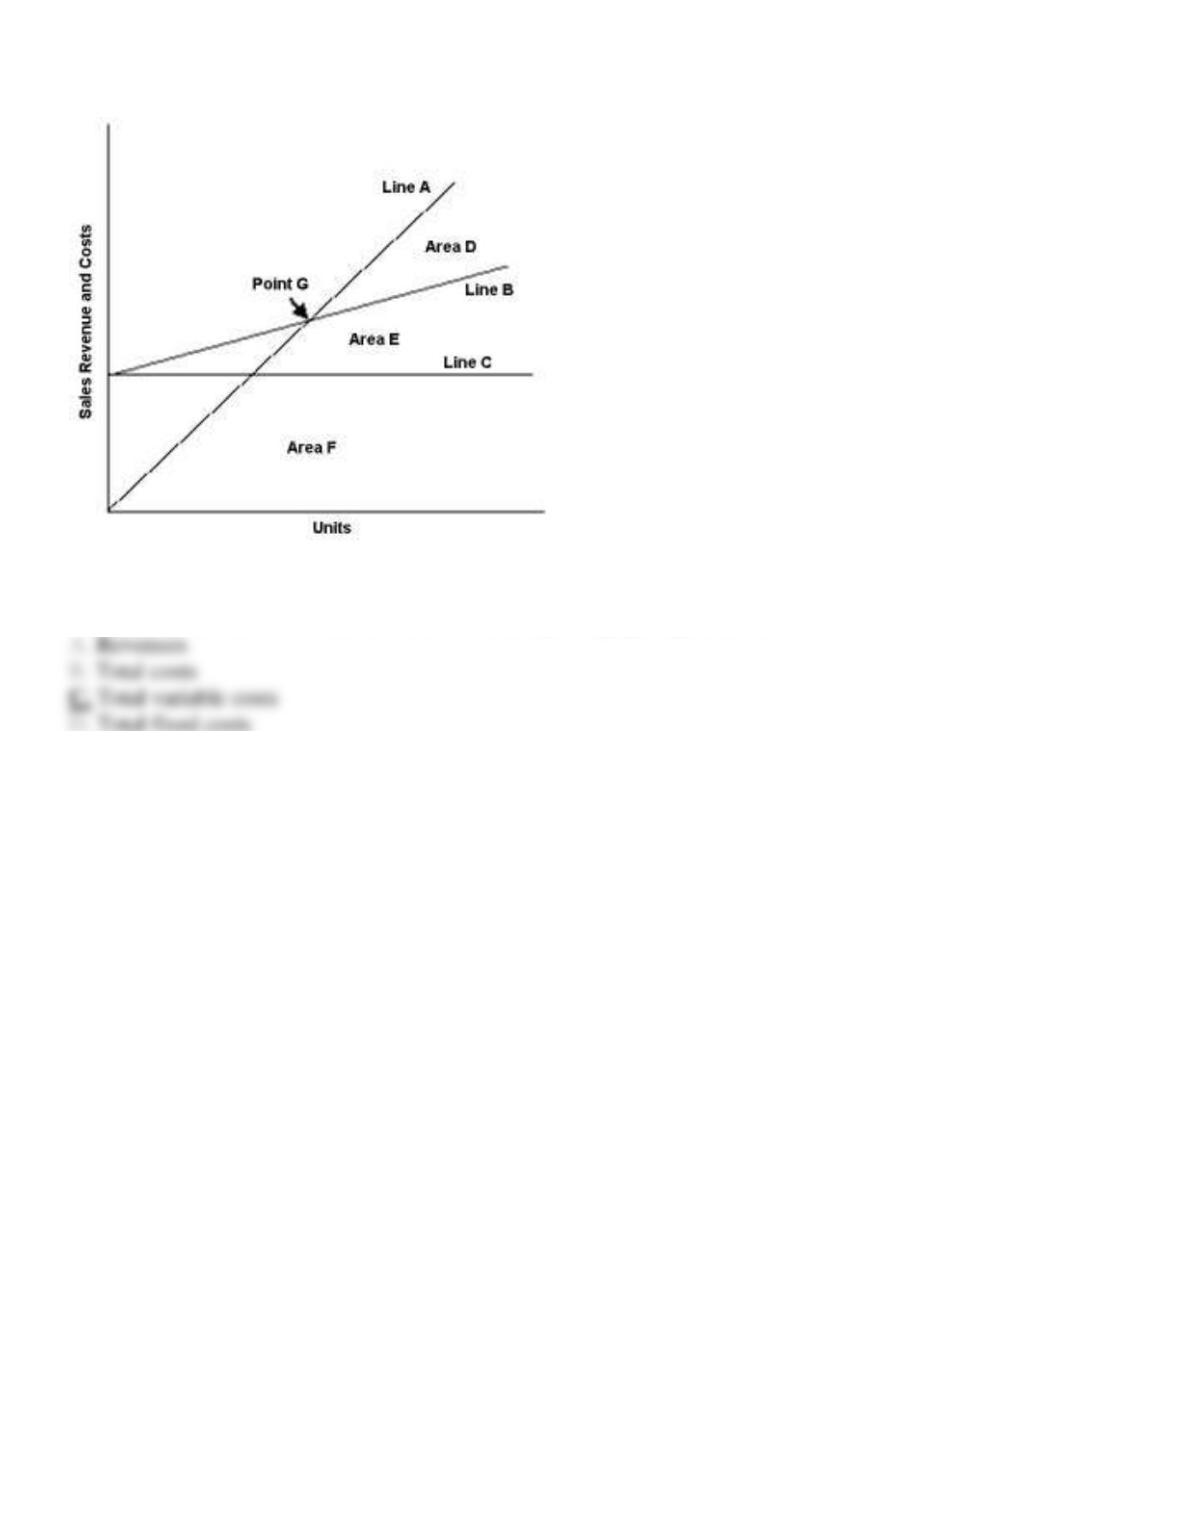
118. Exhibit 21-7
Use the cost-volume-profit graph below to answer the following question(s).
Refer to Exhibit 21-7. Area E on the cost-volume-profit graph represents the:
119. Exhibit 21-7
Use the cost-volume-profit graph below to answer the following question(s).
Refer to Exhibit 21-7. Area F on the cost-volume-profit graph represents the:
120. Exhibit 21-7
Use the cost-volume-profit graph below to answer the following question(s).
Refer to Exhibit 21-7. Area D on the cost-volume-profit graph represents the: