Income Inequality and Poverty
Multiple Choice – Section 00: Introduction
1. In the United States, labor earnings are about what percent of total income?
a. 75 percent
b. 70 percent
c. 67 percent
d. 50 percent
2. In the U.S. economy, labor earnings make up about
a. one–half of total income.
b. two–thirds of total income.
c. three-fourths of total income.
d. nine-tenths of total income.
4942 Income Inequality and Poverty
3. Which of the following is most likely to occur when the government enacts policies to make the
distribution of income more equal?
a. a more efficient allocation of resources
b. a distortion of incentives
c. unchanged behavior
d. All of the above are correct.
4. The invisible hand of the marketplace acts to allocate resources
a. efficiently but does not necessarily ensure that resources are allocated fairly.
b. both fairly and efficiently.
c. fairly but does not necessarily ensure that resources are allocated efficiently.
d. neither fairly nor efficiently.
Income Inequality and Poverty 4943
5. The marketplace allocates resources
a. fairly.
b. efficiently.
c. to those desiring them least.
d. both efficiently and equitably.
6. When the government redistributes income to achieve greater equality, it
a. distorts incentives.
b. improves efficiency.
c. focuses on middle income brackets.
d. relies on foreign aid to help balance the budget.
4944 Income Inequality and Poverty
7. Government programs that take money from high-income people and give it to low-income people
typically
a. improve economic efficiency by reducing poverty.
b. reduce economic efficiency because they distort incentives.
c. have no effect on economic efficiency because they both reduce poverty and distort incentives.
d. sometimes improve, sometimes reduce, and sometimes have no effect on economic efficiency.
8. When the government enacts policies to redistribute income,
a. the objective is to enhance efficiency and a side effect is that the allocation of resources
becomes more equal.
b. the objective is to enhance efficiency and a side effect is that the allocation of resources
becomes less equal.
c. the objective is to enhance equality and a side effect is that the allocation of resources becomes
more efficient.
d. the objective is to enhance equality and a side effect is that the allocation of resources becomes
less efficient.
Income Inequality and Poverty 4945
9. Which of the following is correct?
a. Governments can never improve market outcomes.
b. Governments can sometimes improve market outcomes.
c. Governments can always improve market outcomes.
d. Government can never make the income distribution more equal.
10. Which of the Ten Principles of Economics do governments run into when they redistribute
income to achieve greater equality?
a. Trade can make everyone better off.
b. The cost of something is what you give up to get it.
c. People face trade-offs.
d. Markets are usually a good way to organize economic activity.
4946 Income Inequality and Poverty
11. Which two of the Ten Principles of Economics are illustrated in this chapter?
a. A country’s standard of living depends on its ability to produce goods & People face tradeoffs.
b. Prices rise when the government prints too much money & Governments can sometimes
improve market outcomes.
c. Governments can sometimes improve market outcomes & People face tradeoffs.
d. People face tradeoffs & Prices rise when the government prints too much money .
12. A government‘s policy of redistributing income makes the income distribution
a. more equal, distorts incentives, alters behavior, and makes the allocation of resources more
efficient.
b. more equal, distorts incentives, alters behavior, and makes the allocation of resources less
efficient.
c. less equal, distorts incentives, alters behavior, and makes the allocation of resources more
efficient.
d. less equal, distorts incentives, alters behavior, and makes the allocation of resources less
efficient.
Income Inequality and Poverty 4947
Multiple Choice – Section 01:
The Measurement of Inequality
1. Governments enact policies to
a. make the distribution of income more efficient.
b. make the distribution of income more equal.
c. maximize the use of the welfare system.
d. minimize the use of in-kind transfers.
2. Which of the following is not a question that economists try to answer when measuring the
distribution of income?
a. How many people live in poverty?
b. How often do people receive a raise at work?
c. How often do people move among income classes?
d. What problems arise in measuring the amount of inequality?
4948 Income Inequality and Poverty
3. Economists study poverty and income inequality to answer which of the following questions?
a. What are people’s wages?
b. How does labor-force experience affect wages?
c. How much inequality is there in society?
d. How do people adjust their behavior due to taxation?
4. Comparing the United States household income distribution to other countries is
a. easy, because data is available for all countries in the world.
b. easy, because some countries collect data on expenditures instead of incomes.
c. problematic, because international agreements require countries to standardize their income
accounting procedures.
d. problematic, because countries collect data in different ways.
Income Inequality and Poverty 4949
5. The income distribution in the United States shows that the income share of the top fifth of all
families is
a. over 60 percent.
b. around 21 percent.
c. more than 12 times the income of the bottom fifth.
d. less than 10 times the income of the bottom fifth.
6. Based on data from 2011, the top fifth of all families received approximately what percent of all
income in the United States?
a. 83 percent
b. 49 percent
c. 41 percent
d. 21 percent

4950 Income Inequality and Poverty
7. Based on U.S. income data from 2011, the bottom fifth of all families received approximately what
percent of all income?
a. 48.9 percent
b. 21.3 percent
c. 8.6 percent
d. 3.8 percent
8. Based on U.S. income data from 2011, the top fifth of all families received
a. about 3.8 percent more than the bottom fifth.
b. about 49 percent more than the bottom fifth.
c. approximately 5 times more income than the bottom fifth.
d. more than 12 times more income than the bottom fifth.
Income Inequality and Poverty 4951
9. The 2011 U.S. distribution of income shows that the top 20 percent of all families have
a. more than twelve times the income of the bottom 20 percent.
b. more than six times the income of the bottom 20 percent.
c. more than 100 percent more income than the bottom 20 percent.
d. the same share of income as the bottom 20 percent.
10. The 2011 U.S. distribution of income shows that the top 5 percent of families have approximately
what share of income?
a. 4 percent
b. 9 percent
c. 21 percent
d. 49 percent

4952 Income Inequality and Poverty
11. The 2011 U.S. distribution of income shows that the top 20 percent of families have
approximately what share of income?
a. 20 percent
b. 35 percent
c. 50 percent
d. 80 percent
12. The 2011 U.S. distribution of income shows that the top 5 percent of families earn approximately
how much income per year?
a. $170,000 and over
b. $205,000 and over
c. $250,000 and over
d. $325,000 and over
Income Inequality and Poverty 4953
13. In 2011, what percentage of U.S. families had income levels below $75,000?
a. 20 percent
b. 40 percent
c. 60 percent
d. 80 percent
14. In 2011, what percentage of U.S. families had income levels above $115,866?
a. 10 percent
b. 20 percent
c. 60 percent
d. 80 percent
4954 Income Inequality and Poverty
15. If income were equally distributed among households,
a. each household’s relative share of income would increase.
b. each household’s relative share of income would decrease.
c. the top fifth of households would have 50 percent of the income.
d. 50 percent of the households would receive exactly 50 percent of the income.
16. U.S. income data over the last 75 years suggests that the distribution of income
a. has gradually become more equal over the entire time period.
b. has gradually become less equal over the entire time period.
c. gradually became less equal until about 1970, then became more equal from 1970 to 2011.
d. gradually became more equal until about 1970, then became less equal from 1970 to 2011.
Income Inequality and Poverty 4955
17. Since about 1970 in the U.S.,
a. decreases in the wages of unskilled workers, relative to skilled workers, have led to increased
inequality in family incomes.
b. increases in the wages of unskilled workers, relative to skilled workers, have led to increased
equality in family incomes.
c. inequality in family incomes has increased, despite increases in the wages of unskilled workers
relative to skilled workers.
d. inequality in family incomes has decreased, despite increases in the wages of skilled workers
relative to unskilled workers.
18. When we examine historical data on income inequality in the U.S., we see that the distribution of
income gradually became
a. more equal between 1935 and 2011.
b. more equal between 1935 and 1973, but that trend reversed itself between 1973 and 2011.
c. more unequal between 1935 and 1973, but that trend reversed itself between 1973 and 2011.
d. more unequal between 1935 and 2011.
4956 Income Inequality and Poverty
19. Which of the following does not explain the rise in income inequality in the United States from
1970 to 2011?
a. Changes in technology.
b. An increase in minimum wages.
c. A reduction in the demand for unskilled labor.
d. Increased international trade with low-wage countries.
20. The lack of progress in reducing the poverty rate since the early 1970s is most closely related with
which of the following factors?
a. increasing income inequality
b. a reduction in the poverty line
c. rapid economic growth
d. a reduction in international trade
Income Inequality and Poverty 4957
21. Which of the following explains the rise in income inequality in the United States from 1970 to
2011?
a. An increase in minimum wages.
b. An increase in the demand for skilled labor.
c. An increase in the demand for unskilled labor.
d. Reduced international trade with low-wage countries.
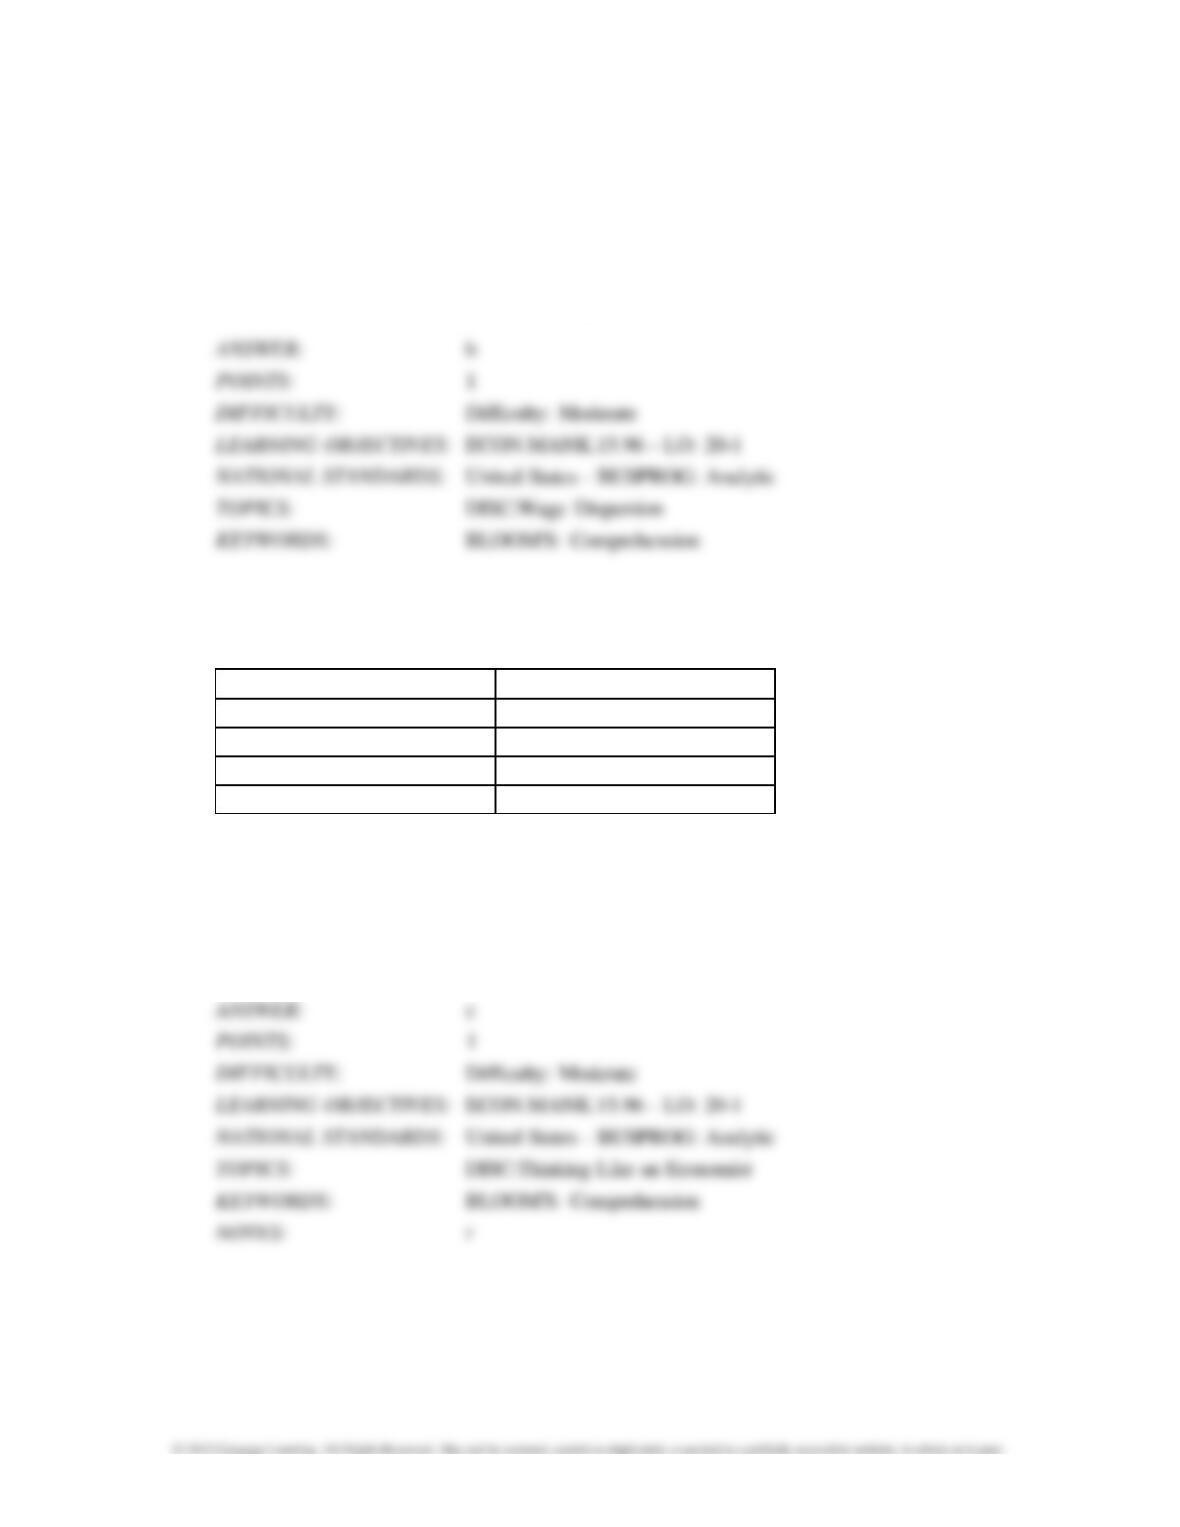
Table 20-1
The following table shows the distribution of income in Marysville.
Group
Annual Family Income
Top Quartile (25%)
$90,000 and over
Second Quartile
$60,000 to $89,999
Third Quartile
$30,000 to $59,999
Bottom Quartile
Under $30,000
22. Refer to Table 20–1. Seventy-five percent of all families have incomes below what level?
a. $30,000
b. $60,000
c. $90,000
d. There is insufficient information to answer this question.
4958 Income Inequality and Poverty
23. Refer to Table 20-1. Seventy-five percent of all families have incomes above what level?
a. $30,000
b. $60,000
c. $90,000
d. There is insufficient information to answer this question.
24. Refer to Table 20–1. Fifty percent of all families have incomes below what level?
a. $30,000
b. $60,000
c. $90,000
d. There is insufficient information to answer this question.
Income Inequality and Poverty 4959
25. Refer to Table 20-1. If the poverty line were $23,021, what would be the poverty rate?
a. less than 25%
b. between 25% and 50%
c. between 50% and 75%
d. There is insufficient information to answer this question.
26. Refer to Table 20-1. If the poverty line was $31,852, what would be the poverty rate?
a. less than 25%
b. between 25% and 50%
c. between 50% and 75%
d. There is insufficient information to answer this question.
4960 Income Inequality and Poverty
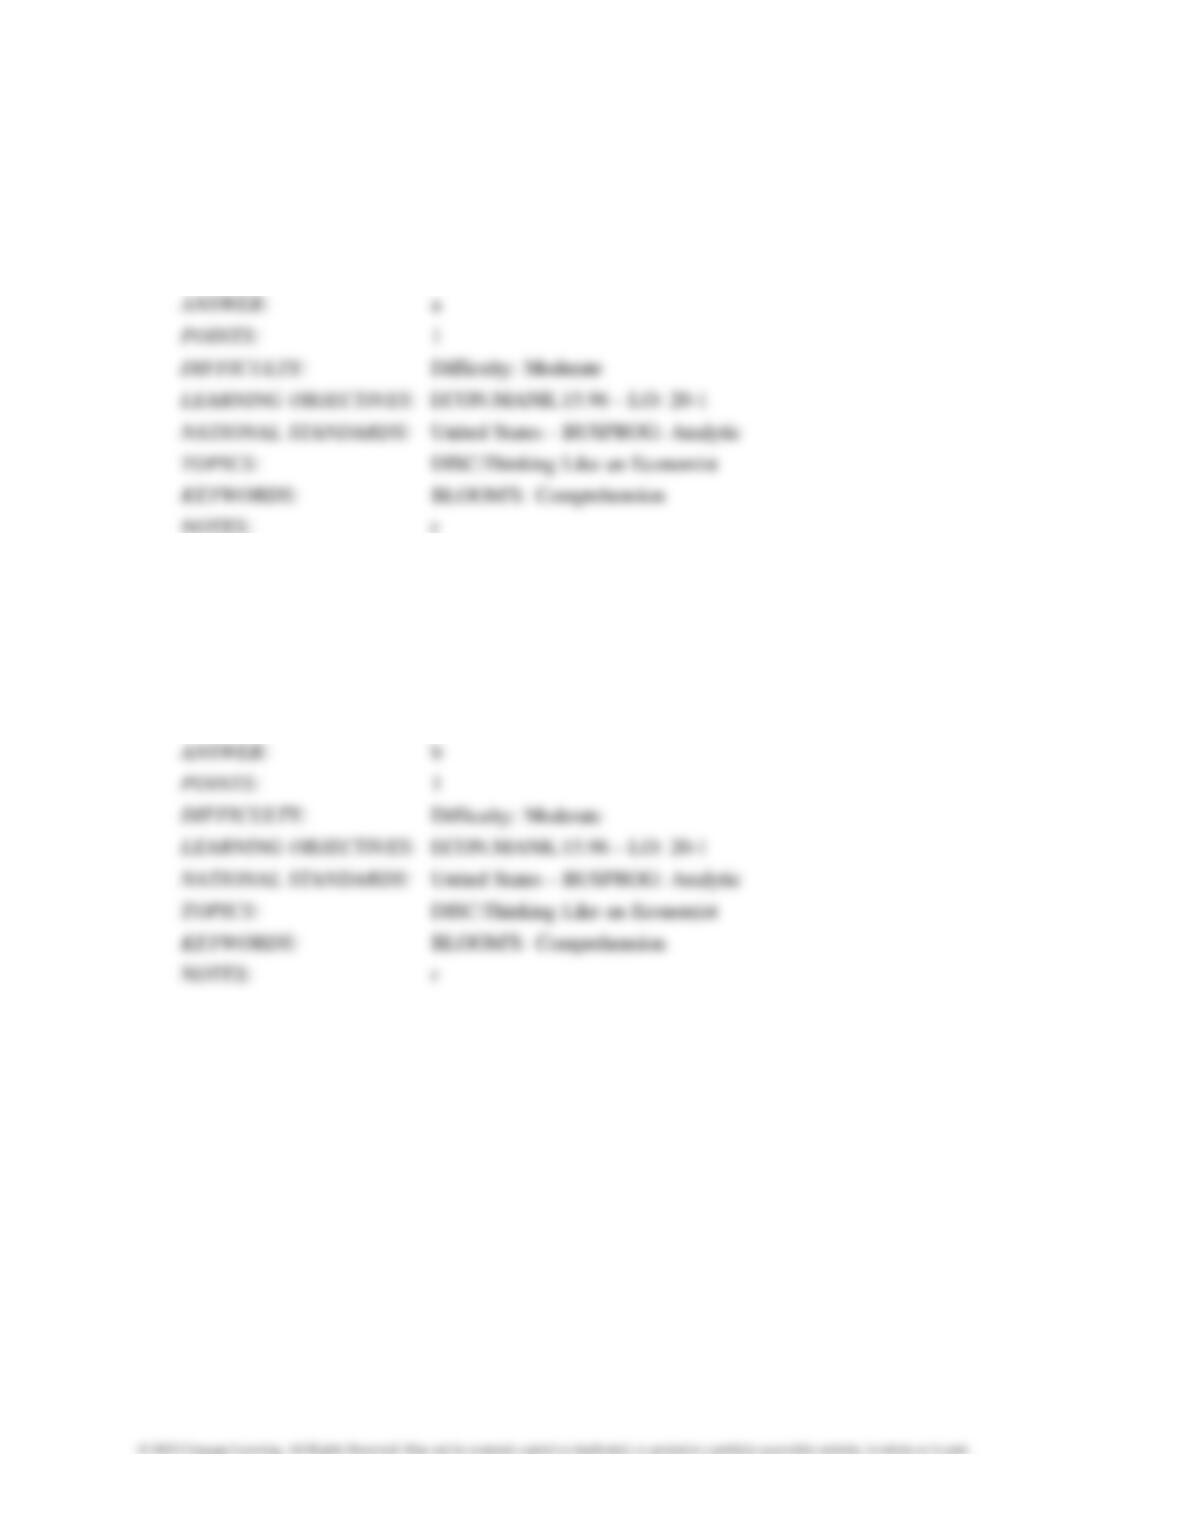
Table 20-2
Percentage of Before-Tax Income Received by Families in Hapland
Group
Percentage of Family Income
in 2000
Percentage of Family Income
in 1950
Top Fifth
50.7
45.9
Fourth Fifth
26.9
25.8
Middle Fifth
12.1
13.6
Second Fifth
6.2
7.2
Bottom Fifth
4.1
5.5
27. Refer to Table 20-2. According to the table, from 1950 to 2000, the Hapland income distribution
became
a. less equal.
b. more equal.
c. more equal at the lowest level of income but less equal at highest level of income.
d. less equal at the lowest level of income but more equal at highest level of income.