Income Inequality and Poverty 4981
63. The poverty rate is
a. a measure of income inequality across families.
b. the percentage of the population whose family income falls below a specified level.
c. an absolute level of income set by the federal government for each family size.
d. measured by the number of in–kind transfers that a family receives.
64. In 2011, the poverty rate in the United States was
a. 5.9 percent.
b. 11.1 percent.
c. 15.0 percent.
d. 22.4 percent.
65. Over the past 50 years, the U.S. poverty rate was at its lowest level in
a. 1973.
b. 1980.
c. 1990.
d. 2008.
4982 Income Inequality and Poverty
66. Since 1959 when the official data on the poverty rate began, the poverty rate was at its highest in
a. 1959.
b. 1968.
c. 1977.
d. 1986.
67. A commonly-used gauge of poverty is the
a. income inequality rate.
b. average income rate.
c. poverty rate.
d. social inequality rate.
68. The percentage of families with incomes below the poverty line
a. is defined as the 10 percent of U.S.households with the lowest incomes.
b. is known as the poverty rate.
c. is known as the unemployment rate.
d. rises as the general income level rises.
Income Inequality and Poverty 4983
69. Measures of poverty that fail to account for the value of in-kind transfers
a. understate the actual poverty rate.
b. have little effect on the validity of reported poverty rates.
c. are generally more reliable measures of actual poverty rates.
d. overstate the actual poverty rate.
70. Since the early 1970s, average incomes have
a. increased, which has reduced the poverty rate.
b. increased, while the poverty rate increased slightly.
c. decreased, while the poverty rate has remained unchanged.
d. remained unchanged, while the poverty rate has decreased.
71. In 2011, the poverty rate in the United States was 15 percent. This means that 15 percent
a. of the population had a total family income that fell below the poverty line.
b. of the population had a total family income that was above the poverty line.
c. of the population had a total family income below $10,000.
d. of the population had a total family income above $50,000.
4984 Income Inequality and Poverty
72. The poverty line in the country of Inequalia is $10,000. The distribution of income for Inequalia is
as follows:
Number of Families Income
200 less than $5,000
300 between $5,000 and $10,000
500 between $10,000 and $15,000
700 between $15,000 and $20,000
100 over $20,000
The poverty rate in Inequalia is
a. 11.1 percent.
b. 16.7 percent.
c. 27.8 percent.
d. 55.5 percent.
Income Inequality and Poverty 4985
73. The poverty line in the country of Inequalia is $7,800. The distribution of income for Inequalia is
as follows:
Number of Families Income
200 less than $5,000
300 between $5,000 and $10,000
500 between $10,000 and $15,000
700 between $15,000 and $20,000
300 over $20,000
The poverty rate in Inequalia is
a. 7.8 percent.
b. between 10 percent and 25 percent.
c. between 25 percent and 50 percent.
d. 39 percent.

4986 Income Inequality and Poverty
74. The distribution of income for Inequalia is as follows:
Number of Families Income
200 less than $5,000
300 between $5,000 and $10,000
500 between $10,000 and $15,000
700 between $15,000 and $20,000
300 over $20,000
If the poverty rate in Inequalia is 25 percent, what is the poverty line in Inequalia?
a. $5,000
b. $10,000
c. $15,000
d. $20,000
Income Inequality and Poverty 4987
75. The poverty line in the country of Dismal is $20,000. The distribution of income for Dismal is as
follows:
Number of Families Income
1,000 less than $10,000
2,000 between $10,000 and $20,000
2,000 between $20,000 and $30,000
800 between $30,000 and $40,000
200 over $40,000
The poverty rate in Dismal is
a. 16.7 percent.
b. 33.3 percent.
c. 50 percent.
d. 83.3 percent.
4988 Income Inequality and Poverty
76. The distribution of income for Dismal is as follows:
Number of Families Income
1,000 less than $10,000
2,000 between $10,000 and $20,000
2,000 between $20,000 and $30,000
800 between $30,000 and $40,000
200 over $40,000
If the poverty rate in Dismal is 50 percent, what is the poverty line in Dismal?
a. $10,000.
b. $20,000.
c. $30,000.
d. $40,000.
Income Inequality and Poverty 4989
77. The distribution of income for Dismal is as follows:
Number of Families Income
1,000 less than $10,000
2,000 between $10,000 and $20,000
2,000 between $20,000 and $30,000
800 between $30,000 and $40,000
200 over $40,000
If the poverty rate in Dismal is about 17 percent, what is the poverty line in Dismal?
a. $10,000.
b. $20,000.
c. $30,000.
d. $40,000.
4990 Income Inequality and Poverty
78. The distribution of income for Danville is as follows:
Number of Families Income
500 less than $15,000
600 between $15,000 and $20,000
1,000 between $20,000 and $25,000
700 between $25,000 and $30,000
500 over $30,000
If the poverty rate in Danville is 33.3 percent, what is the poverty line in Danville?
a. $15,000.
b. $20,000.
c. $25,000.
d. $30,000.
Income Inequality and Poverty 4991
79. The poverty line in the country of Abbyville is $15,000. The distribution of income for Abbyville is
as follows:
Number of Families Income
300 less than $15,000
500 between $15,000 and $20,000
900 between $20,000 and $25,000
600 between $25,000 and $30,000
200 over $30,000
The poverty rate in Abbyville is
a. 12 percent.
b. 32 percent.
c. 50 percent.
d. 68 percent.
4992 Income Inequality and Poverty
80. The distribution of income for Abbyville is as follows:
Number of Families Income
300 less than $15,000
500 between $15,000 and $20,000
900 between $20,000 and $25,000
600 between $25,000 and $30,000
200 over $30,000
If the poverty rate in Abbyville is 12 percent, what is the poverty line in Abbyville?
a. $15,000.
b. $20,000.
c. $25,000.
d. $30,000.
Income Inequality and Poverty 4993
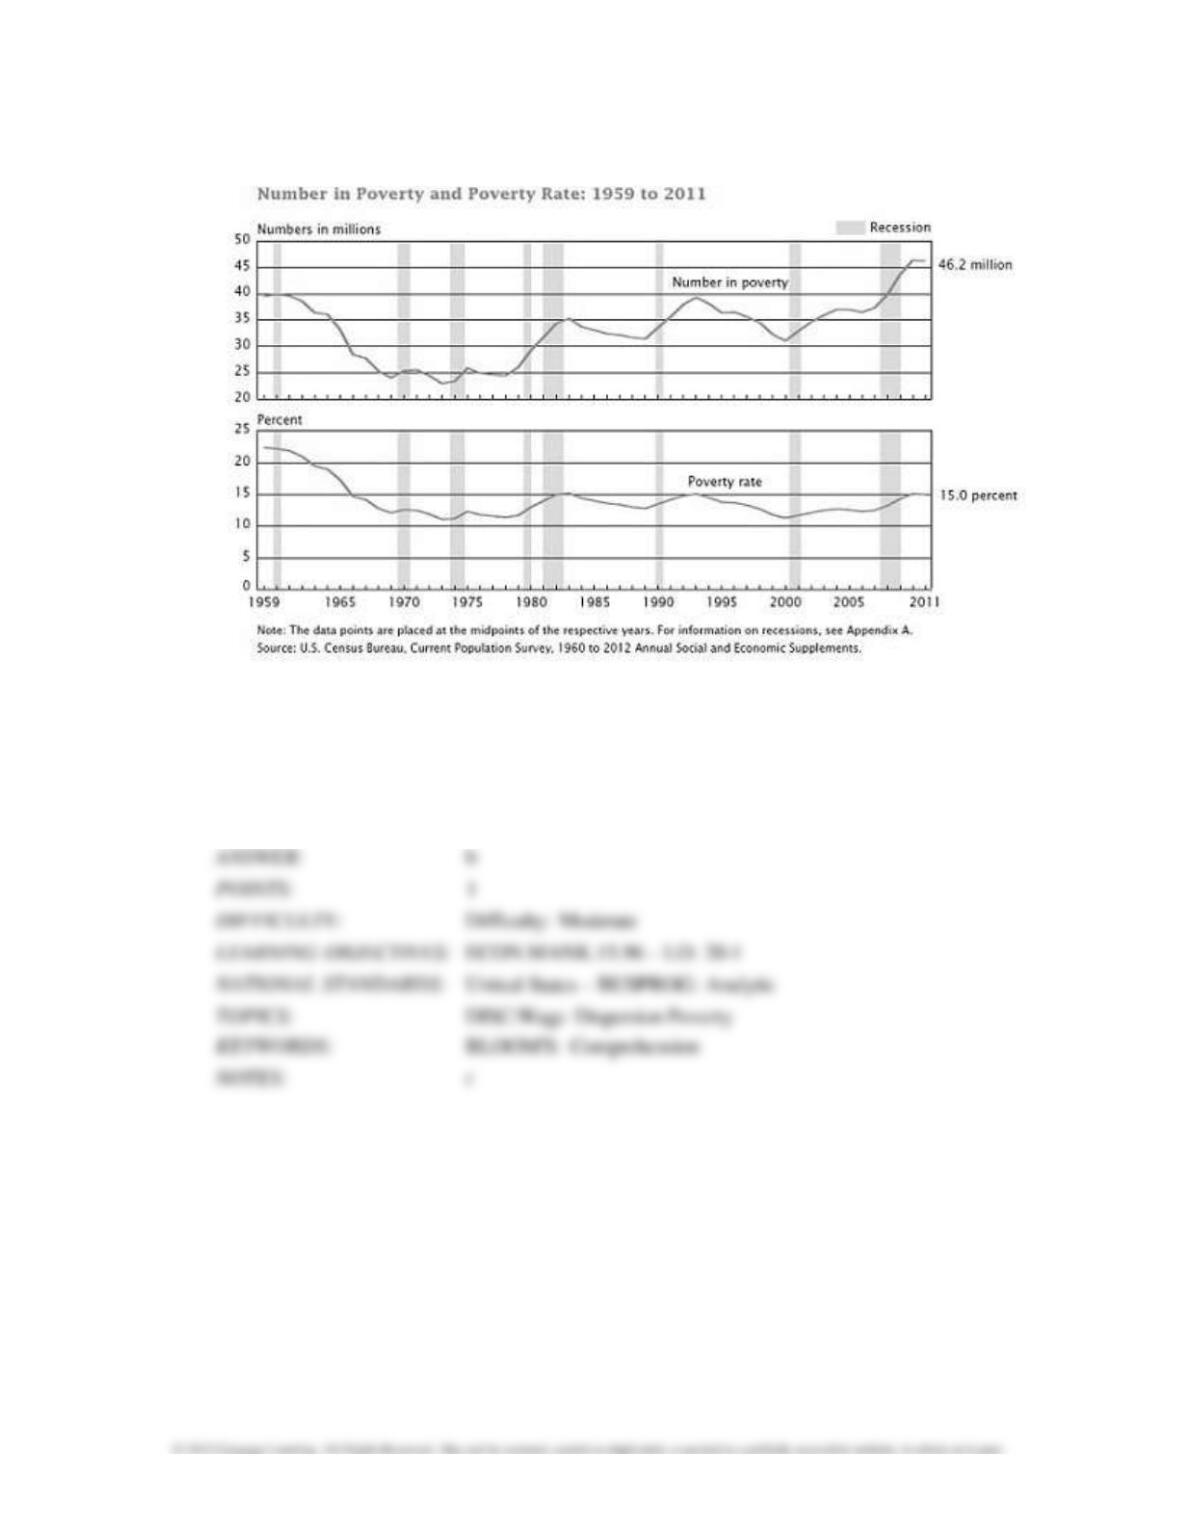
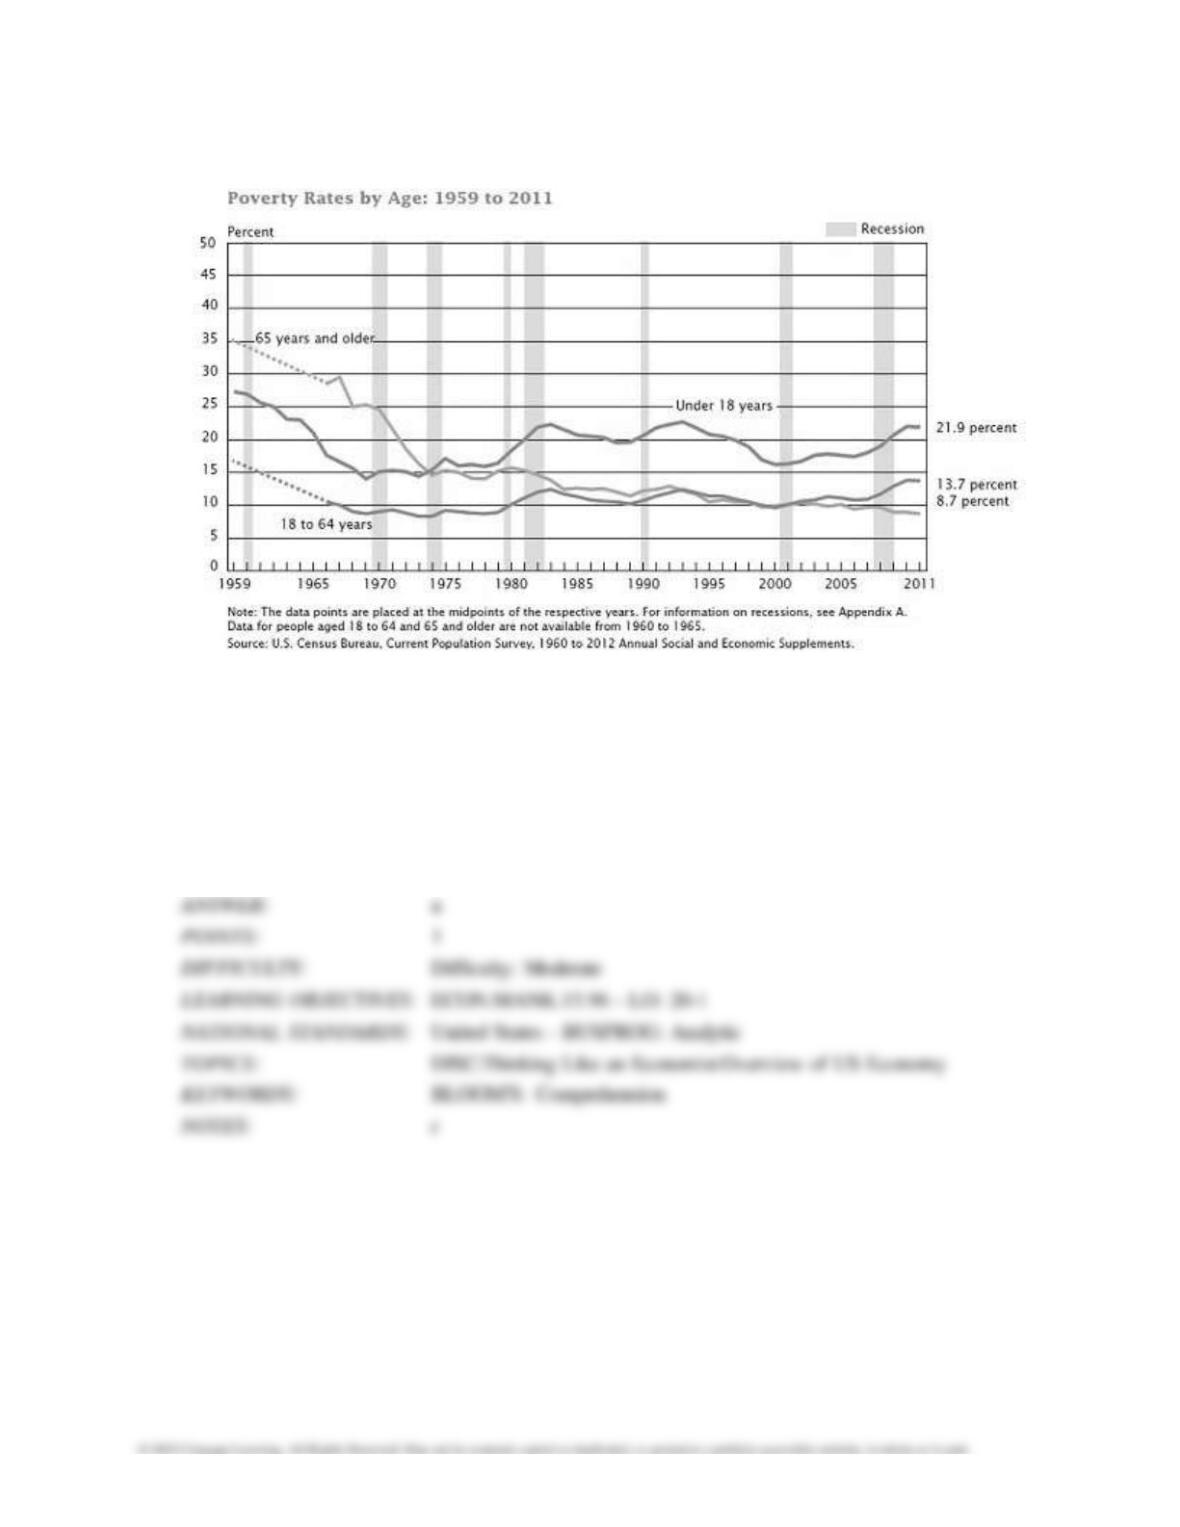
Figure 20-1 Number of Poor
81. Refer to Figure 20-1. Between 1959 and 2011 the poverty rate has
a. increased overall.
b. decreased overall.
c. stayed the same overall.
d. moved in the opposite direction of the number of people in poverty.
4994 Income Inequality and Poverty
82. Refer to Figure 20-1. The absolute number of people in poverty
a. is higher in 2011 than in 1959.
b. is lower in 2011 than in 1959.
c. has not changed between 1959 and 2011.
d. has steadily decreased between 1959 and 2011.
83. Refer to Figure 20-1. Between 1965 and 2011, during recessions (the shaded bars) the number
of individuals in poverty has
a. increased.
b. decreased.
c. not changed.
d. decreased and then increased.
Income Inequality and Poverty 4995
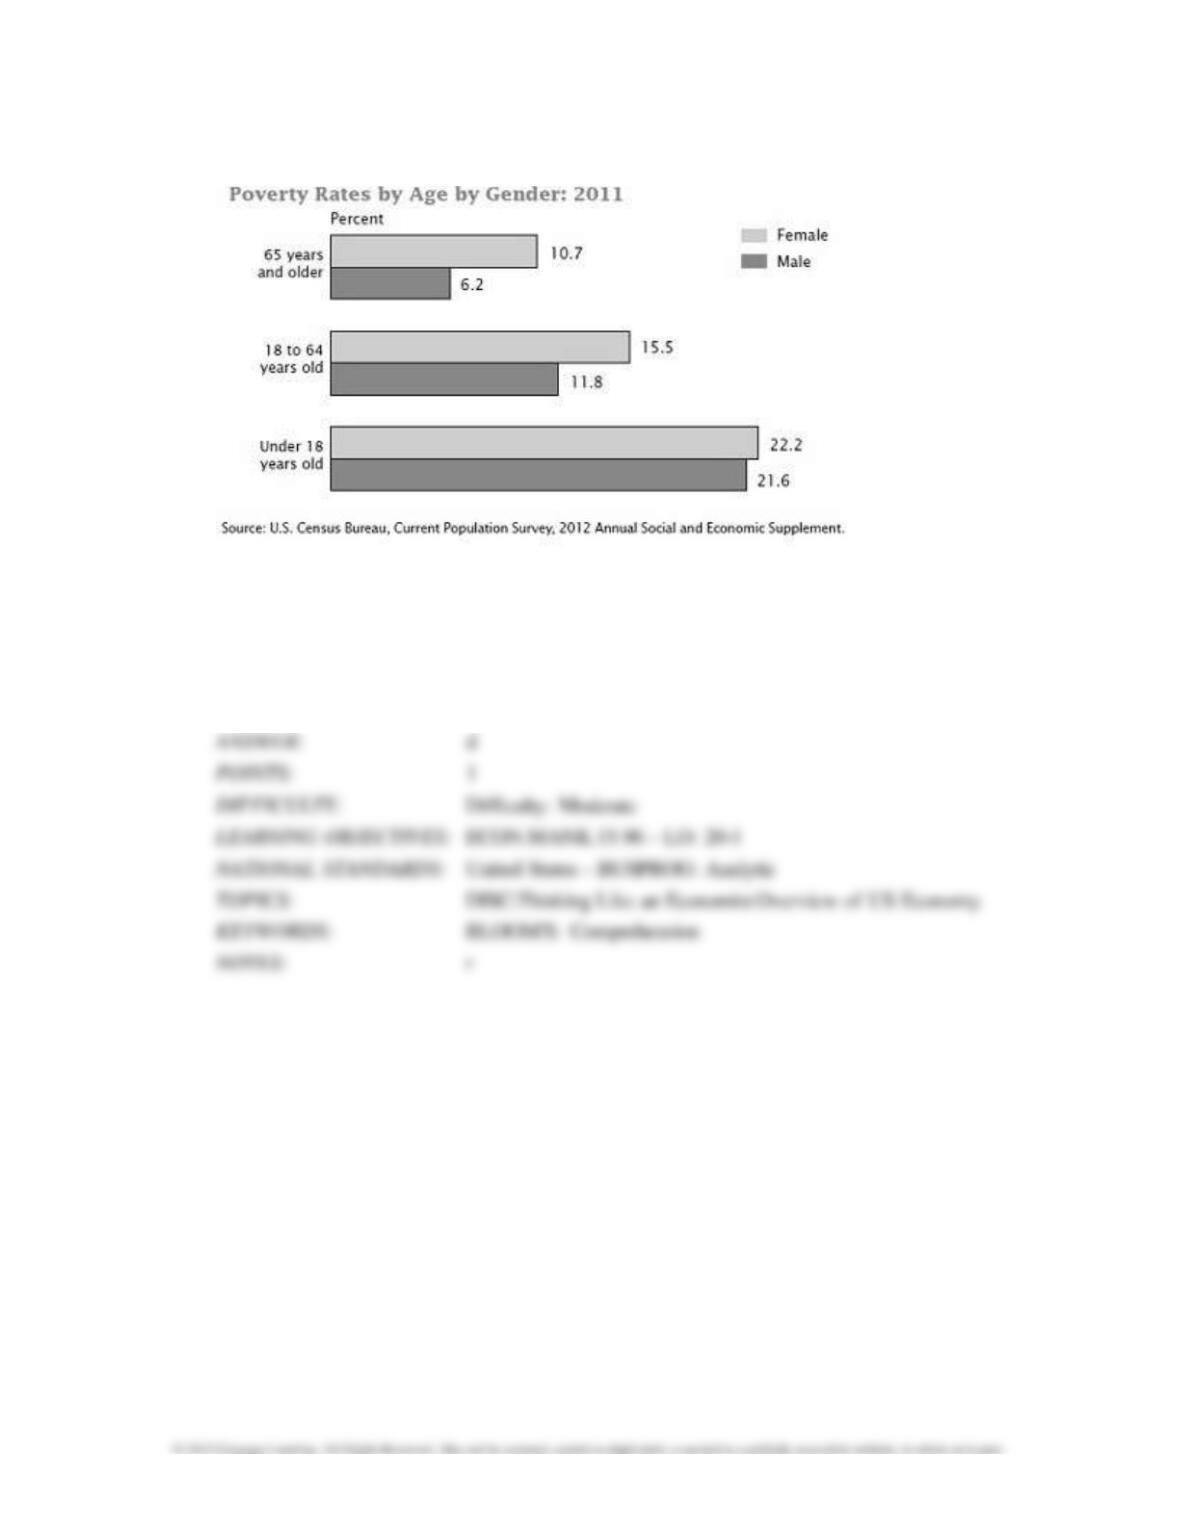
Figure 20-2
84. Refer to Figure 20-2. Which of the following is consistent with the data reported in the figure?
a. The female poverty rate is higher for all age groups than the male poverty rate.
b. The disparity between male and female poverty increases with age.
c. Neither a nor b are correct.
d. Both a and b are correct.
4996 Income Inequality and Poverty
Figure 20-3
85. Refer to Figure 20-3. Which of the following is consistent with the data reported in the figure?
a. Policies to reduce elderly (65 years and older) poverty rates since 1959 seem to have been
effective.
b. The age group suffering the highest poverty rate in recent years has been 18 to 64 year olds.
c. Policies to reduce youth (under 18 years) poverty rates since 1959 seem to have been
effective.
d. All of the above are correct.

Income Inequality and Poverty 4997
86. Refer to Figure 20-3. In 2011, the percent of children under age 18 in poverty is
a. higher than both the percentage of adults aged 18 to 64 and the percentage of elderly aged 65
years and over in poverty.
b. higher than the percentage of adults aged 18 to 64 but is lower than the percentage of elderly
aged 65 years and over in poverty.
c. lower than both the percentage of adults aged 18 to 64 and the percentage of elderly aged 65
years and over in poverty.
d. lower than the percentage of adults aged 18 to 64 but is higher than the percentage of elderly
aged 65 years and over in poverty.
87. Refer to Figure 20-3. In 1968, the percent of adults aged 18 to 64 years in poverty is
a. higher than both the percentage of children under age 18 and the percentage of elderly aged 65
and over in poverty.
b. higher than the percentage of children under age 18 but is lower than the percentage of elderly
aged 65 and over in poverty.
c. lower than both the percentage of children under age 18 and the percentage of elderly aged 65
and over in poverty.
d. lower than the percentage of children under age 18 but is higher than the percentage of elderly
aged 65 and over in poverty.
4998 Income Inequality and Poverty
88. Refer to Figure 20-3. In 2011, the percent of adults between ages 18 and 64 in poverty is
a. higher than both the percentage of children under age 18 and the percentage of elderly aged 65
and over in poverty.
b. higher than the percentage of children under age 18 but is lower than the percentage of elderly
aged 65 and over in poverty.
c. is lower than the percentage of children under age 18 but is higher than the percentage of
elderly aged 65 and over in poverty.
d. is lower than the percentage of children under age 18 and is equal to the percentage of elderly
aged 65 and over in poverty.
89. Refer to Figure 20-3. In 1968, the percent of children under age 18 in poverty is
a. higher than both the percentage of adults aged 18 to 64 and the percentage of elderly aged 65
and over in poverty.
b. higher than the percentage of adults aged 18 to 64 but is lower than the percentage of elderly
aged 65 and over in poverty.
c. lower than both the percentage of adults aged 18 to 64 and the percentage of elderly aged 65
and over in poverty.
d. lower than the percentage of adults aged 18 to 64 but is higher than the percentage of elderly
aged 65 and over in poverty.
Income Inequality and Poverty 4999
90. Refer to Figure 20-3. In 1968, the percent of elderly aged 65 and over in poverty is
a. higher than both the percentage of adults aged 18 to 64 and the percentage of children under
age 18 in poverty.
b. higher than the percentage of adults aged 18 to 64 but is lower than the percentage of children
under age 18 in poverty.
c. lower than both the percentage of adults aged 18 to 64 and the percentage of children under
age 18 in poverty.
d. is lower than the percentage of adults aged 18 to 64 but is higher than the percentage of
children under age 18 in poverty.
91. Refer to Figure 20-3. In 2011, the percent of elderly aged 65 and over in poverty is
a. higher than both the percentage of adults aged 18 to 64 and the percentage of children under
age 18 in poverty.
b. higher than the percentage of adults aged 18 to 64 but is lower than the percentage of children
under age 18 in poverty.
c. lower than both the percentage of adults aged 18 to 64 and the percentage of children under
age 18 in poverty.
d. lower than the percentage of children under age 18 but is equal to the percentage of adults
aged 18 to 64 in poverty.
5000 Income Inequality and Poverty
92. Refer to Figure 20-3. Which of the following best describes the poverty rates by age from 1965
to 2011?
a. The poverty rates by age have declined for all age groups.
b. The percentage of people living in poverty has consistently been highest for the elderly aged 65
and over and lowest for adults aged 18 to 64.
c. The percentage of children under age 18 and the percentage of adults aged 18 to 64 have
maintained a similar trend while the percentage of elderly aged 65 and over has decreased
significantly.
d. The poverty rates by age have increased for all age groups.
93. In 2011, the poverty line for a family of four in the U.S. was
a. $60,974.
b. $23,021.
c. $20,988.
d. $17,642.