Income Inequality and Poverty 5001
94. The poverty line is adjusted each year to reflect changes in the
a. number of people currently on public assistance.
b. level of prices.
c. nutritional content of an “adequate” diet.
d. size of a family.
95. The federal government sets the poverty line at roughly
a. five times the cost of providing an adequate diet.
b. four times the cost of providing an adequate diet.
c. three times the cost of providing an adequate diet.
d. two times the cost of providing an adequate diet.
96. The income level below which families are said to be poor is known as the
a. income maintenance threshold.
b. poverty line.
c. bottom quintile of the income distribution.
d. minimum wage.
5002 Income Inequality and Poverty
97. The poverty rate is the percentage of the population that have a family income level below the
a. income maintenance threshold.
b. poverty line.
c. bottom quintile of the income distribution.
d. minimum wage.
98. If the U.S. government determines that the cost of feeding an urban family of four is $7,500 per
year, then the official poverty line for a family of that type is
a. $7,500.
b. $15,000.
c. $22,500.
d. $30,000.
Income Inequality and Poverty 5003
99. If the U.S. government determines that the cost of feeding an urban family of four is $5,200 per
year, then the official poverty line for a family of that type is
a. $10,400.
b. $15,600.
c. $20,800.
d. $26,000.
100. The US government sets the poverty line equal to approximately
a. three times the cost of providing subsidized housing.
b. three times the cost of providing an adequate diet.
c. the minimum wage for a single person working 40 hours per week and 50 weeks per year.
d. the cost of providing food, shelter, and health care expenses for a family of four.
101. The calculation of the poverty line includes adjustments for
a. energy costs.
b. child care costs.
c. the level of prices.
d. the Earned Income Tax Credit.
5004 Income Inequality and Poverty
102. Which of the following statements is not correct?
a. The poverty line is an absolute level of income set by the federal government below which a
family is considered to be in poverty.
b. The poverty line is approximately equal to three times the cost of providing an adequate diet.
c. The poverty line is adjusted annually to reflect changes in price levels.
d. The poverty line is adjusted semiannually to reflect changes in fuel prices.
Income Inequality and Poverty 5005
Table 20–11
Poverty Thresholds in 2011, by Size of Family and Number of Related Children Under
18 Years [Dollars]
Related children under 18 years
Size of family
unit
None
One
Two
Three
Four
Five
Six
Seven
Eight
or
more
One person
(unrelated
individual)
Under 65
years
11,702
65 years and
over
10,788
Two persons
15,063
15,504
Householder
under 65
years
13,596
15,446
Householder
65 years and
over
Three
persons
17,595
18,106
18,123
Four persons
23,201
25,581
22,811
22,891
Five persons
27,979
28,386
27,517
26,844
26,434
Six persons
32,181
32,309
31,643
31,005
30,056
29,494
Seven
persons
37,029
37,260
36,463
35,907
34,872
33,665
32,340
Eight persons
41,414
41,779
41,027
40,368
39,433
38,247
37,011
36,697
Nine persons
or more
49,818
50,059
49,393
48,835
47,917
46,654
45,512
45,229
43,487
Source: U. S. Bureau of the Census, Current Population Survey.
5006 Income Inequality and Poverty
103. Refer to Table 20-11. What is the poverty line for a family of six with three children?
a. $29,494
b. $31,005
c. $32,181
d. $26,844
104. Refer to Table 20-11. What is the poverty line for a family of eight with two children?
a. $18,123
b. $36,463
c. $41,027
d. $43,487
Income Inequality and Poverty 5007
105. Refer to Table 20-11. What is the poverty line for a family of three with one child?
a. $17,595
b. $18,106
c. $18,123
d. $22,891
106. Refer to Table 20–11. What is the poverty line for a 75–year–old individual?
a. $10,788
b. $11,702
c. $13,596
d. $15,446
5008 Income Inequality and Poverty
107. Refer to Table 20-11. What is the poverty line for a family with one 35–year-old adult and one
child?
a. $11,702
b. $15,446
c. $15,504
d. $18,106
108. Refer to Table 20-11. What is the poverty line for a family with one 68–year-old adult and one
child?
a. $10,788
b. $15,446
c. $15,504
d. $18,106
Income Inequality and Poverty 5009
109. The poverty line is
a. established by the federal government.
b. approximately equivalent to three times the cost of providing an adequate diet.
c. an absolute level of income below which a family is deemed to be in poverty.
d. All of the above are correct.
110. Poverty is found to be correlated with
a. age and race but not family composition.
b. race only.
c. race and family composition but not age.
d. age, race, and family composition.
5010 Income Inequality and Poverty
111. Measuring poverty using an absolute income scale like the poverty line can be misleading
because
a. income measures do not include the value of in-kind transfers.
b. money is more highly valued by the rich than by the poor.
c. the poor are not likely to participate in the labor market.
d. income measures are not adjusted for the effects of labor-market discrimination.
112. Which of the following statements is correct?
a. The poverty line is a relative standard.
b. More families are pushed above the poverty line as economic growth pushes the entire income
distribution upward.
c. Increasing income inequality reduces poverty.
d. Economic growth, by definition, affects all families equally.
Income Inequality and Poverty 5011
113. Which of the following groups has the highest poverty rate?
a. blacks
b. Asians
c. children (under age 18)
d. female households, no spouse present
114. Which of the following groups has the lowest poverty rate?
a. blacks
b. Asians
c. children (under age 18)
d. female households, no spouse present
5012 Income Inequality and Poverty
115. Which of the following is not correct?
a. Poverty is correlated with race.
b. Poverty is correlated with age.
c. Poverty is correlated with family composition.
d. All of the above are correct.
116. The poverty rate for female households with no spouse present is approximately
a. 10 percent.
b. 20 percent.
c. 30 percent.
d. 40 percent.
Income Inequality and Poverty 5013
117. Based on U.S. data for 2011, the poverty rate is the highest for which group of people?
a. children
b. married couples
c. female-headed households, no spouse present
d. the elderly
Table 20–12
Income Inequality in 2010 in the United States by Race
The values in the table reflect the percentages of pre-tax-and-transfer income.
Race
Bottom Fifth
Second Fifth
Middle Fifth
Fourth Fifth
Top Fifth
Top 5%
Asian
3.0%
8.9%
15.3%
24.5%
48.3%
19.0%
Black
2.7
7.9
14.2
23.6
51.6
21.4
Hispanic
3.5
9.0
14.7
23.3
49.4
20.6
White
3.6
8.8
14.9
23.4
49.3
21.0
Source: US Census Bureau
118. Refer to Table 20-12. According to the information in the table, which race had the most
income inequality in 2010?
a. Asian
b. Black
c. Hispanic
d. White
5014 Income Inequality and Poverty
119. In comparison to the average poverty rate,
a. children and the elderly are more likely to be poor.
b. children and the elderly are less likely to be poor.
c. children are more likely to be poor, but the elderly are less likely to be poor.
d. children are less likely to be poor, but the elderly are more likely to be poor.
Income Inequality and Poverty 5015
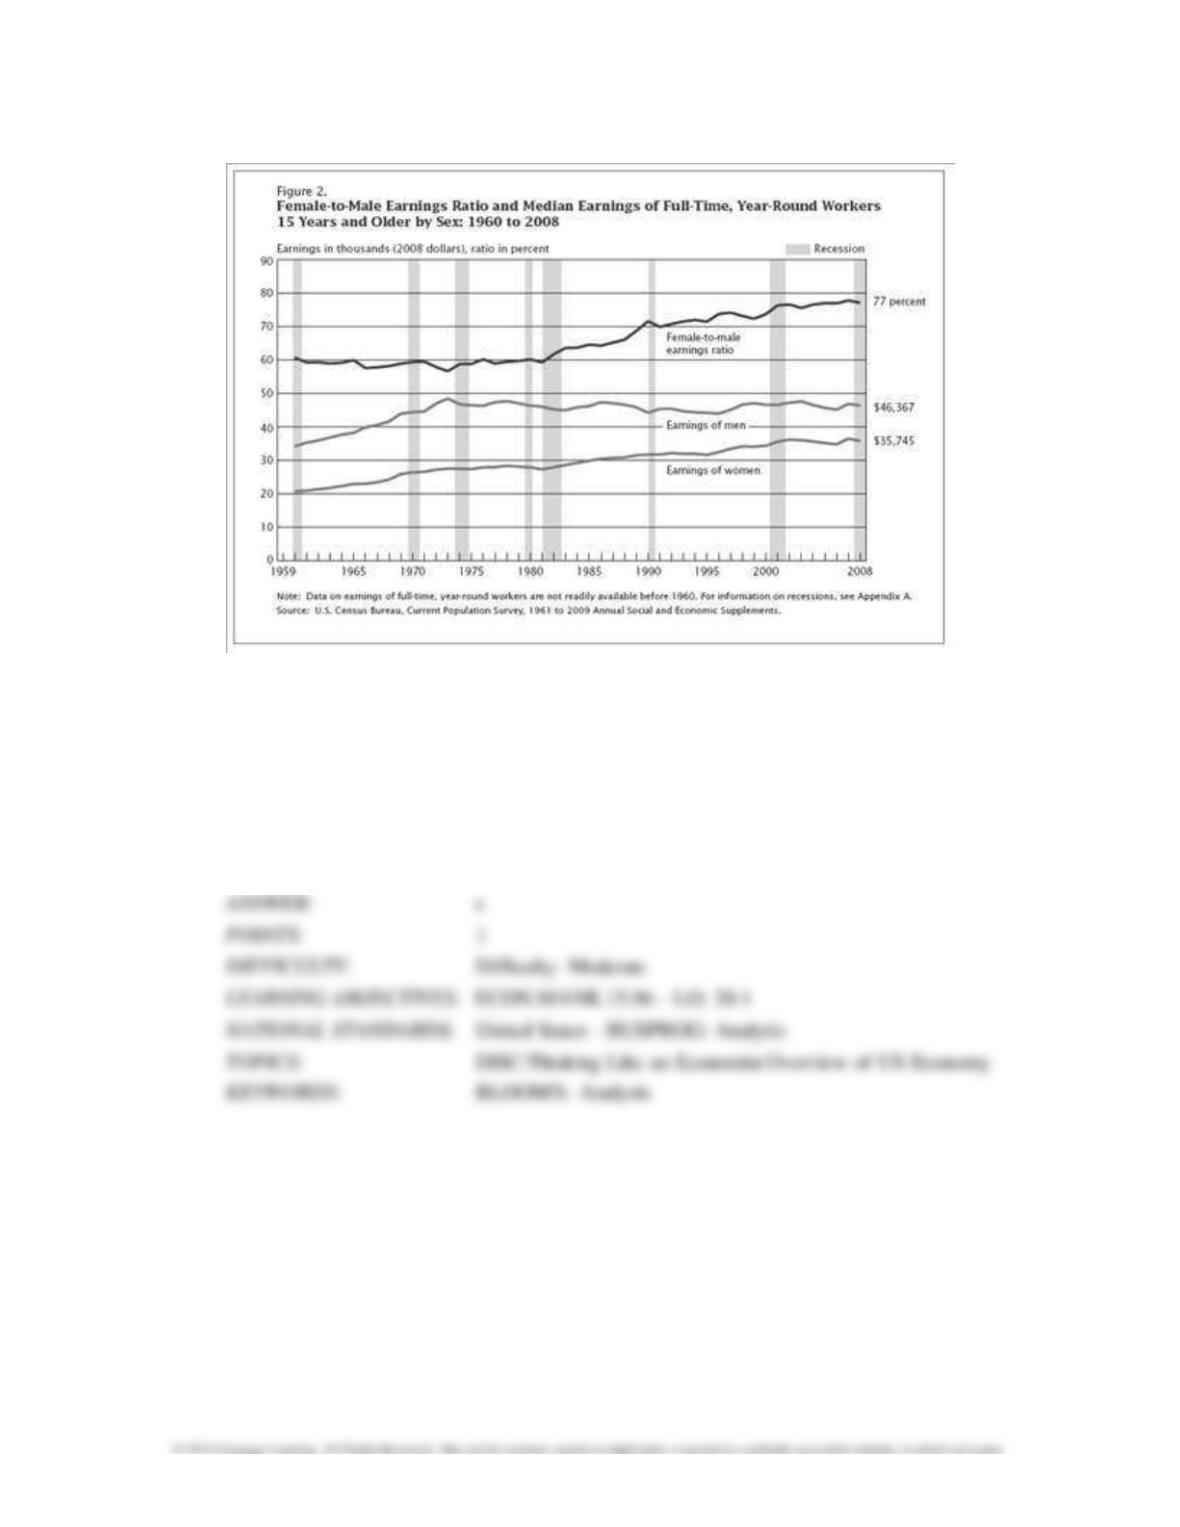
Figure 20-4
120. Refer to Figure 20-4. The ratio of female-to–male earnings has increased steadily from about
1980 to 2008 because the earnings of men
a. increased steadily but by approximately half of the increase in the earnings of women.
b. decreased while the earnings of women increased.
c. stayed relatively constant while the earnings of women increased.
d. decreased by substantially more than the decrease in the earnings of women.
5016 Income Inequality and Poverty
121. Which of the following represents a problem in measuring inequality?
a. Measurements of income distributions typically include in-kind transfers, which distort the
measure of inequality.
b. A normal life–cycle pattern causes inequality in the income distribution but may not reflect
inequality in living standards.
c. Transitory income is a better measure of inequality than permanent income.
d. Both a and b are correct.
122. Which of the following is not correct?
a. Poverty is long-term problem for relatively few families.
b. Measurements of income inequality usually do not include in-kind transfers.
c. Measurements of income inequality use lifetime incomes rather than annual incomes.
d. Measurements of income inequality would be more meaningful if they reflected permanent
rather than current income.
Income Inequality and Poverty 5017
123. If the value of in-kind transfers are taken into account, the number of families living in poverty
in the United States would
a. increase by about 1 percent.
b. decrease by about 1 percent.
c. decrease by about 5 percent.
d. decrease by about 10 percent.
124. In–kind transfers
a. are cash payments given to the poor from the government.
b. are available to citizens of all income levels, but usually only sought by the poor.
c. are non–monetary items given to the poor.
d. include food stamps, but not housing vouchers or medical services.
5018 Income Inequality and Poverty
125. Government vouchers to purchase food, also known as food stamps, are an example of
a. an in-kind transfer.
b. life–cycle income.
c. a negative income tax.
d. permanent income.
126. In-kind transfers are transfers to the poor
a. in the form of goods and services rather than cash.
b. in the form of goods, services, and cash.
c. from private charitable organizations only.
d. from the federal government only.
Income Inequality and Poverty 5019
127. The statement that “measures of the distribution of income are based on money income” relates
to which problem in measuring inequality?
a. in-kind transfers
b. economic life cycle
c. transitory versus permanent income
d. economic mobility
128. When considering a person’s standard of living, data on the income distribution and the poverty
rate may provide an incomplete picture because the poor may
a. receive in-kind transfers.
b. be lending to smooth their income over their life cycle.
c. be saving to smooth their income due to a drop in transitory income.
d. under-report their income.
5020 Income Inequality and Poverty
129. Suppose the average value of in-kind transfers increases by $2,000 from 2013 to 2014. The
poverty rate
a. is more likely to understate the true level of poverty.
b. is more likely to overstate the true level of poverty.
c. will increase by $2,000 divided by the poverty level.
d. Both b and c are correct.
130. The normal life cycle pattern of income
a. contributes to more inequality in the distribution of annual income and to more inequality in
living standards.
b. contributes to more inequality in the distribution of annual income, but it does not necessarily
contribute to more inequality in living standards.
c. contributes to less inequality in the distribution of annual income and to less inequality in living
standards.
d. has no effect on either the distribution of annual income or on living standards.