Unemployment 6853
111.
Refer to Table 28-2. The labor–force participation rate of Aridia in 2012 was
a. 50%.
b. 53.3%.
c. 56.25%.
d. 88.9%.
112.
Refer to Table 28-2. The labor-force participation rate of Aridia
a.
increased both from 2010 to 2011 and from 2011 to 2012.
b.
increased from 2010 to 2011 but decreased from 2011 to 2012.
c.
decreased from 2010 to 2011 but increased from 2011 to 2012.
d.
decreased both from 2010 to 2011 and from 2011 to 2012.
6854 Unemployment
Table 28-3
2009 Labor Data for Baltivia
Number of adults
20,000
Number of adults who are paid employees
8,000
Number of adults who work in their own businesses
1,600
Number of adults who are unpaid workers in a family member’s business
1,000
Number of adults who were temporarily absent from their jobs because of an earthquake
400
Number of adults who were waiting to be recalled to a job from which they had been laid
off
200
Number of adults who do not have a job, are available for work, and have tried to find a
job
within the past four weeks
1,400
Number of adults who do not have a job, are available for work, but have not tried to find
a
job within the past four weeks
780
Number of adults who are full-time students
3,000
Number of adults who are homemakers or retirees
3,620
113.
Refer to Table 28-3. How many people were employed in Baltivia in 2009?
a. 9,600
b. 10,600
c. 11,000
d. 11,200
114.
Refer to Table 28-3. How many people were unemployed in Baltivia in 2009?
a. 1,400
b. 1,600
c. 2,000
d. 2,780
115.
Refer to Table 28-3. How many people were in Baltivia’s labor force in 2009?
a. 11,000
b. 12,600
c. 13,380
d. 20,000
116.
Refer to Table 28-3. How many adults were not in Baltivia’s labor force in 2009?
a. 4,400
b. 6,620
c. 7,400
d. 8,690
117.
Refer to Table 28–3. What was Baltivia’s unemployment rate in 2009?
a. 8.0%
b.
12.7%
c.
15.9%
d.
22.1%
118.
Refer to Table 28-3. What was Baltivia’s labor-force participation rate in 2009?
a.
55%
b.
63%
c.
66.9%
d.
87.3%
119.
According to 2012 data on the U.S. population, which of the following was correct for the adult
population of prime
working age, ages 25-54?
a.
Black males had higher labor-force participation rates and lower unemployment rates
compared to white
males.
b.
Black males had both higher labor-force participation rates and higher unemployment rates
compared to
white males.
c.
Black males had both lower labor-force participation rates and lower unemployment rates
compared to white
males.
d.
Black males had lower labor-force participation rates and higher unemployment rates
compared to white
males.
120.
According to 2012 data on the U.S. population, which of the following was correct for the adult
population of prime
working age, ages 25-54?
a.
Black females had higher labor-force participation rates and lower unemployment rates
compared to white
females.
b.
Black females had similar labor-force participation rates and higher unemployment rates
compared to white
females.
c.
Black females had both lower labor-force participation rates and lower unemployment rates
compared to
white females.
d.
Black females had lower labor-force participation rates and higher unemployment rates
compared to white
females.
121.
According to 2012 data on the U.S. population, which of the following was correct?
a.
Adults of prime working age (ages 25–54) had both higher labor-force participation rates and
higher rates of
unemployment compared to teenagers.
b.
Adults of prime working age (ages 25–54) had higher labor-force participation rates and lower
rates of
unemployment compared to teenagers.
c.
Adults of prime working age (ages 25–54) had both lower labor-force participation rates and
lower rates of
unemployment compared to teenagers.
d.
Adults of prime working age (ages 25–54) had lower labor-force participation rates and higher
rates of
unemployment compared to teenagers.
122.
According to 2012 data on the U.S. population, which of the following groups of adults of prime
working age (ages
25–54) had the highest labor-force participation rate?
a.
white males
b.
white females
c.
black males
d.
black females

123.
According to 2012 data on the U.S. population, which of the following groups of adults of prime
working age (ages
25–54) had the lowest labor-force participation rate?
a.
white males
b.
white females
c.
black males
d.
black females
124.
According to 2012 data on the U.S. population, which of the following groups of adults of prime
working age (ages
25–54) had the highest unemployment rate?
a.
white males
b.
white females
c.
black males
d.
black females
125.
According to 2012 data on the U.S. population, which of the following groups of adults of prime
working age (ages
25–54) had the lowest unemployment rate?
a.
white males
b.
white females
c.
black males
d.
black females
126.
According to 2012 data on the U.S. population, which of the following groups of teenagers (ages
16–19) had the
highest labor-force participation rate?
a.
white males
b.
white females
c.
black males
d.
black females
127.
According to 2012 data on the U.S. population, which of the following groups of teenagers (ages
16–19) had the
lowest labor-force participation rate?
a.
white males
b.
white females
c.
black males
d.
black females
128.
According to 2012 data on the U.S. population, which of the following groups of teenagers (ages
16–19) had the
highest unemployment rate?
a.
white males
b.
white females
c.
black males
d.
black females
129.
According to 2012 data on the U.S. population, which of the following groups of teenagers (ages
16–19) had the
lowest unemployment rate?
a.
white males
b.
white females
c.
black males
d.
black females
130.
Which of the following is correct?
a.
The labor-force participation rate of women has increased in part due to smaller families.
b.
The labor-force participation rate of men has decreased in part due to men retiring younger
and living longer.
c.
Both a and b are correct.
d.
Neither a nor b is correct.
Unemployment 6863
Table 28-4
2010 Labor Data for Adults (ages 16 and older) in Meditor
Males not in labor force
45 million
Females not in labor force
35 million
Males unemployed
5 million
Females unemployed
5 million
Males employed
85 million
Females employed
65 million
131.
Refer to Table 28-4. What is the adult population in Meditor?
a.
90 million
b.
160 million
c.
230 million
d.
240 million
132.
Refer to Table 28-4. What is the adult labor force in Meditor?
a.
90 million
b.
150 million
c.
160 million
d.
230 million
133.
Refer to Table 28-4. What is the adult unemployment rate in Meditor?
a. 4.2%
b.
6.25%
c.
6.7%
d.
10%
134.
Refer to Table 28-4. What is the adult labor-force participation rate in Meditor?
a. 37.5%
b. 62.5%
c. 66.7%
d. 95.8%
135.
Refer to Table 28–4. What is the adult male population in Meditor?
a.
50 million
b.
90 million
c.
130 million
d.
135 million
136.
Refer to Table 28-4. What is the adult male labor force in Meditor?
a.
50 million
b.
85 million
c.
90 million
d.
130 million
137.
Refer to Table 28-4. What is the adult male unemployment rate in Meditor?
a.
3.7%
b.
5.0%
c.
5.6%
d.
5.9%
138.
Refer to Table 28-4. What is the adult male labor-force participation rate in Meditor?
a. 37%
b. 63%
c. 66.7%
d. 96.3%
139.
Refer to Table 28-4. What is the adult female population in Meditor?
a.
40 million
b.
70 million
c.
100 million
d.
105 million
140.
Refer to Table 28-4. What is the adult female labor force in Meditor?
a.
40 million
b.
65 million
c.
70 million
d.
100 million
141.
Refer to Table 28-4. What is the adult female unemployment rate in Meditor?
a.
4.8%
b.
5.0%
c.
7.1%
d.
7.7%
142.
Refer to Table 28-4. What is the adult female labor-force participation rate in Meditor?
a. 38.1%
b. 61.9%
c. 66.7%
d. 95.2%
Table 28-5
Labor Force Statistics by Age
Suppose people in the adult population in a small country are classified based on their age.
Labor Force Status
less than 55
55 and older
Number employed
400,000
100,000
Number unemployed
25,000
7,000
Number in Population
600,000
200,000
143.
Refer to Table 28-5. In the proper order, which age group has the highest unemployment rate
and which has the
highest participation rate?
a.
under 55, under 55
b.
under 55, 55 and older
c.
55 and older, under 55
d.
55 and older, 55 and older
144.
Refer to Table 28-5. Suppose that the natural rate of unemployment is 5% for those under 55
and 3% for those
55 and older. The cyclical unemployment rate for those under 55 is
a.
0.88% which is greater than the cyclical unemployment rate for those 55 and older.
b.
0.88% which is less than the cyclical unemployment rate for those 55 and older.
c.
-0.83% which is greater than the cyclical unemployment rate for those 55 and older.
d.
-0.83% which is less than the cyclical unemployment rate for those 55 and older.
145.
The deviation of unemployment from its natural rate is called
a.
the normal rate of unemployment.
b.
deviant unemployment.
c.
cyclical unemployment.
d.
fluctuating unemployment.
146.
If the natural rate of unemployment is 5.2 percent and the actual rate of unemployment is 5.7
percent, then by
definition there is
a.
cyclical unemployment amounting to 0.5 percent of the labor force.
b.
frictional unemployment amounting to 0.5 percent of the labor force.
c.
structural unemployment amounting to 0.5 percent of the labor force.
d.
search unemployment amounting to 0.5 percent of the labor force.
147.
Economists at the Congressional Budget Office estimated that for 2012, the U.S. natural rate of
unemployment was
a. 1.5%.
b. 3.0%.
c. 5.5%.
d. 8.5%.
148.
Since 1960, the natural rate of unemployment in the U.S. has been between
a.
0% and 1%.
b.
5% and 6%.
c.
10% and 12%.
d.
12% and 24%.
149.
Which of the following is correct?
a.
In the U.S. the natural rate of unemployment is frequently near 2%.
b.
The natural rate of unemployment fluctuates more than the cyclical rate of unemployment.
c.
The cyclical rate of unemployment is sometimes below the natural rate of unemployment.
d.
None of the above is correct.
Unemployment 6871
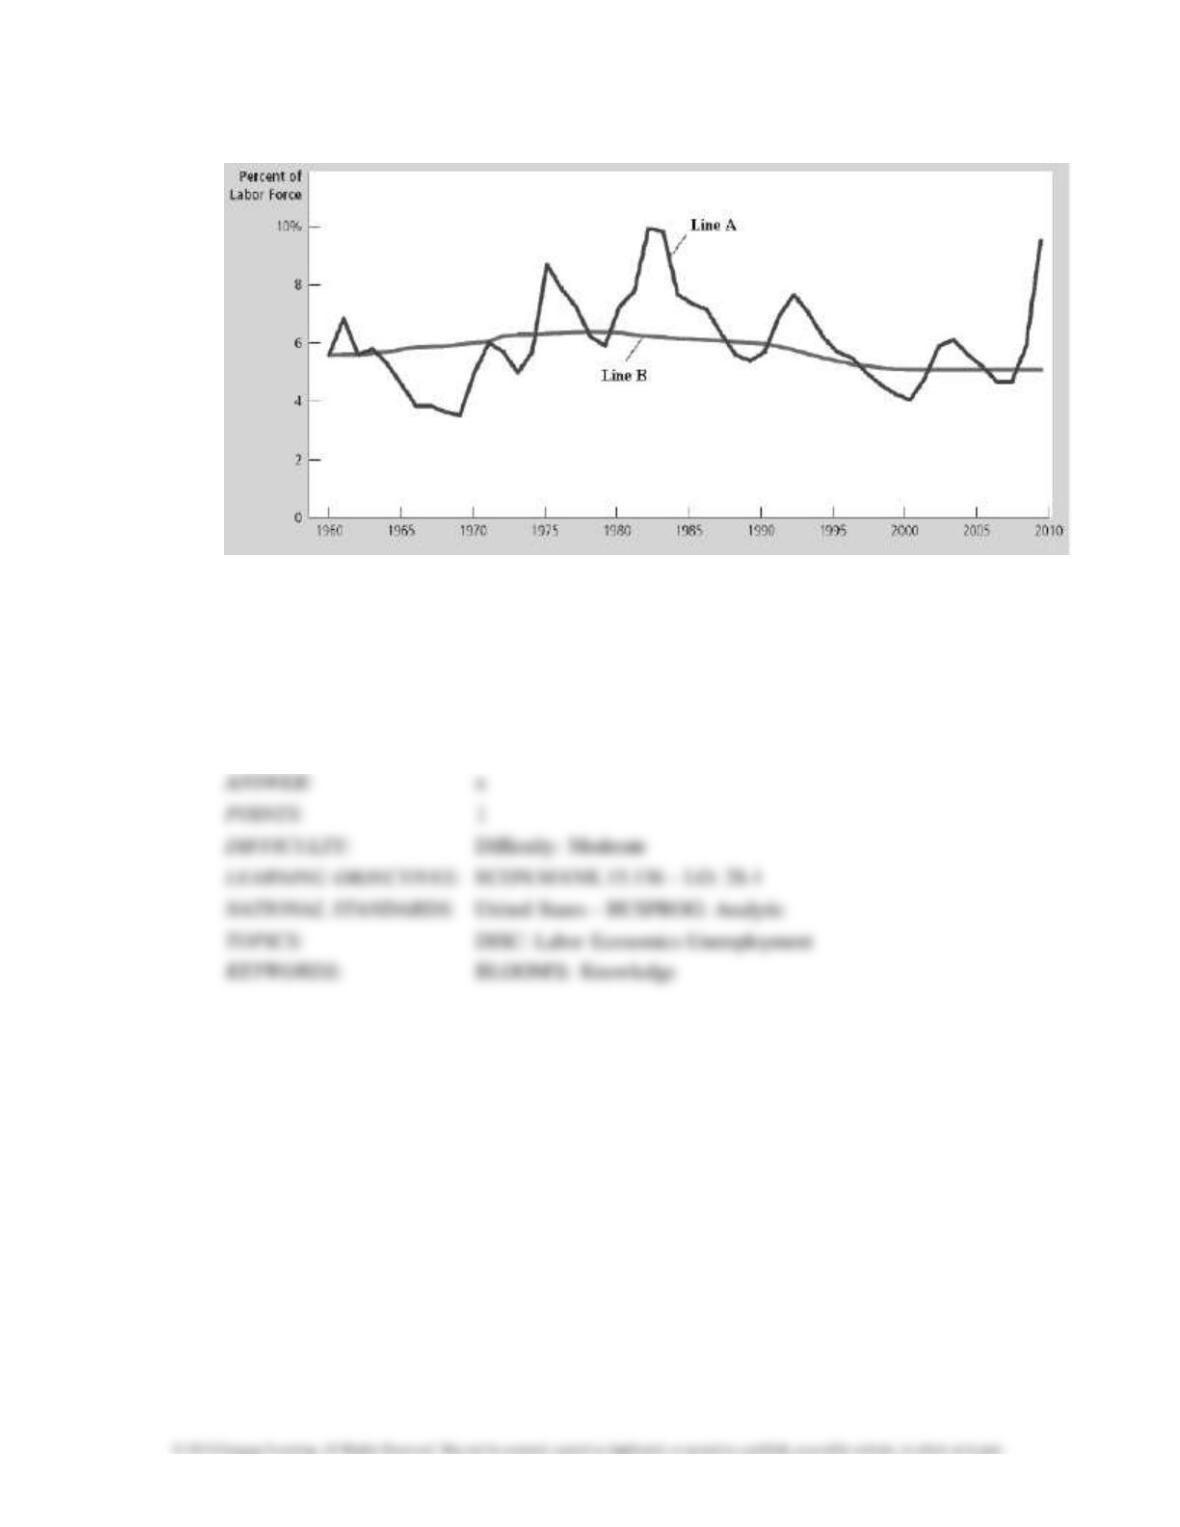
Figure 28-1
150.
Refer to Figure 28-1. Which of the following correctly identifies lines A and B?
a.
Line A is the unemployment rate, and line B is the natural rate of unemployment.
b.
Line A is the labor force participation rate, and line B is the adult population.
c.
Line A is the employment rate, and line B is the adult population.
d.
Line A is the labor force participation rate, and line B is the unemployment rate.
6872 Unemployment
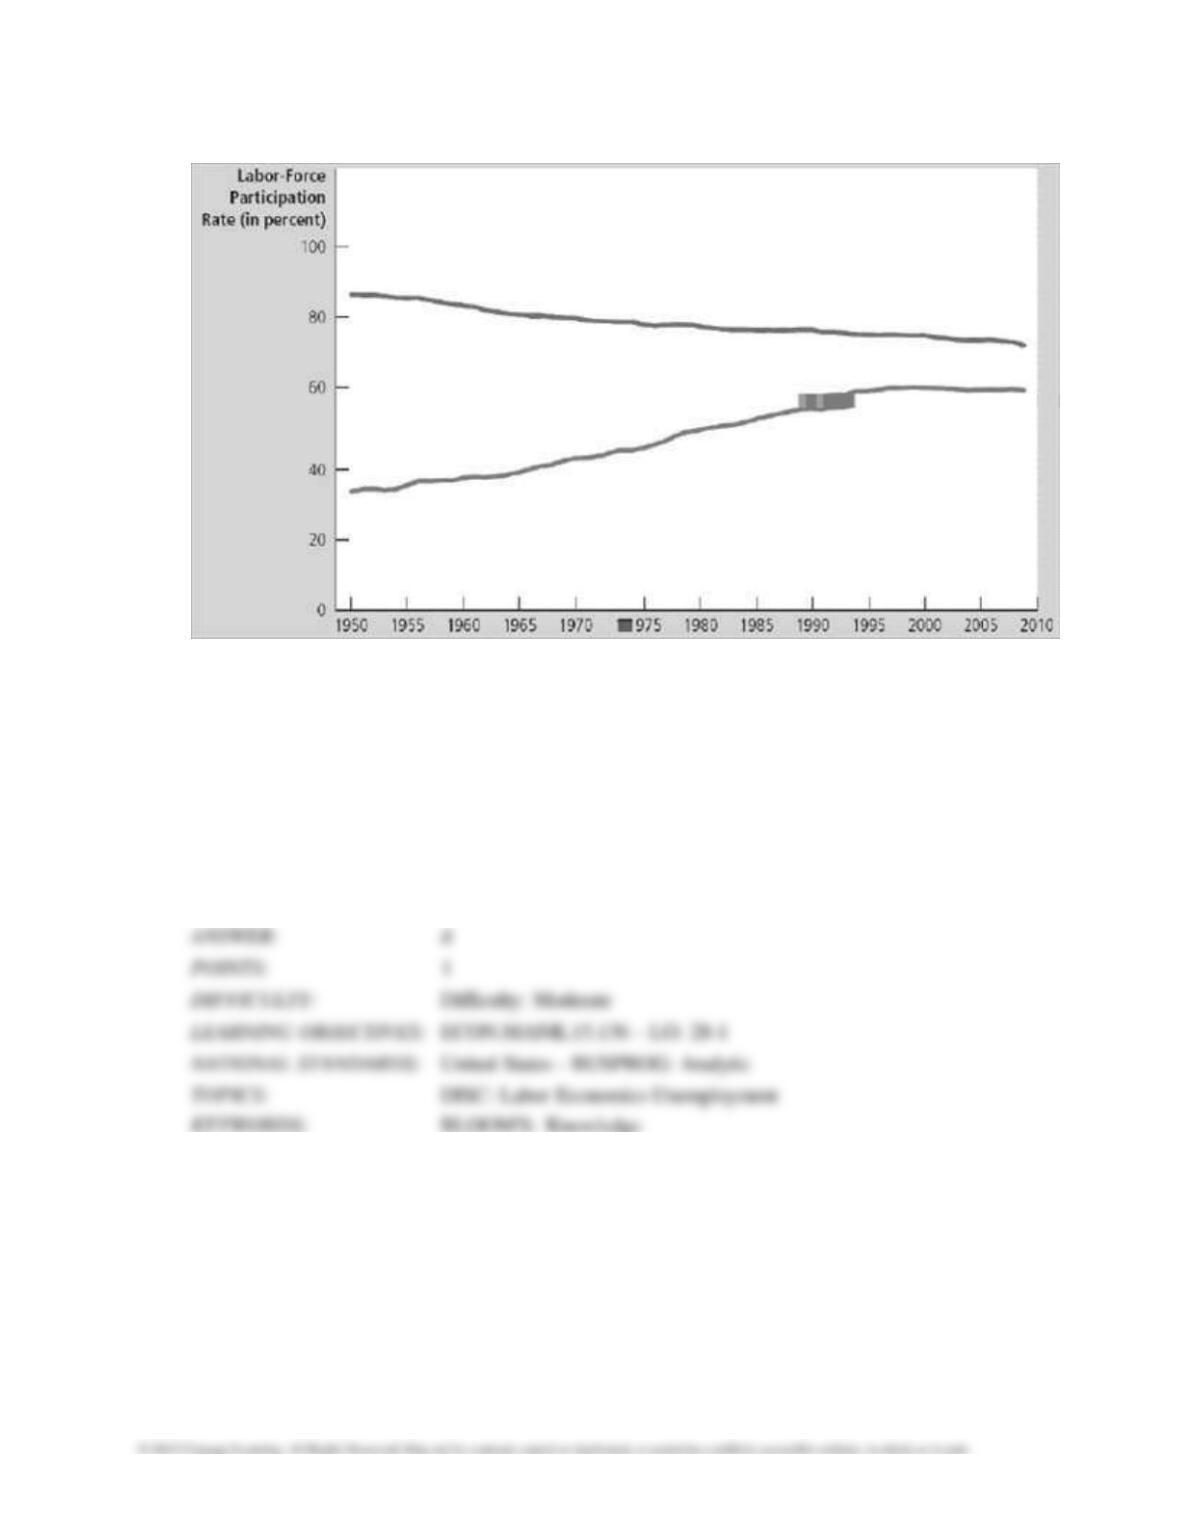
Figure 28-2
151.
Refer to Figure 28-2. What do the two lines in the figure measure?
a.
The top line is the labor force participation rate, and the bottom line is the unemployment rate.
b.
The top line is the labor force participation rates of the college-educated population, and bottom
line is the
labor force participation rates of the high-school-educated population.
c.
The top line is the foreign labor force participation rate, and the bottom line is the domestic
labor force
participation rate.
d.
The top line is the labor force participation rates of men, and the bottom line is the labor force
participation
rates of women.