Glasses of
Water Total Utility Marginal Utility
1100
2175
3225
4250
5260
6255
341)
Using the above table, the marginal utility for the sixth glass of water is
341)
A)
5 utils.
B)
260 utils.
C)
255 utils.
D)
–5 utils.
342)
The marginal rate of substitution is
342)
A)
the slope of the budget line at all points.
B)
the change in the quantity of one good that just offsets a unit change in another good, keeping
utility constant.
C)
equal to unit changes in the quantities of both goods so that utility rises.
D)
found by adding additional units.
Number of Bottles of Soda Total Utility Marginal Utility
1100
2 20
315
4140
343)
Using the above table, what is the total utility of consuming 3 bottles of soda?
343)
A)
240
B)
120
C)
135
D)
115
Quantity of Movies Michelle’s Total Robert’s Total
Watched per Week Utility per Week Utility per Week
0 0 0
1100 100
2195 190
3270 270
4340 340
5390 400
6420 350
7435 390
8445 420
9450 440
10 440 450
344)
Refer to the above table. What is the marginal utility for the 3rd unit for Michelle and for Robert?
344)
A)
Michelle: 75; Robert: 75
B)
Michelle: 270; Robert: 270
C)
Michelle: 75; Robert: 80
D)
Michelle: –10; Robert: 20
345)
When a consumer is at the consumer optimum
345)
A)
MUa= MUb= MUc= . . . = MUn.
B)
MUa/Pa= MUb/Pb= MUc/Pc= . . . = MUn/Pn= 1.
C)
MUa/Pa= MUb/Pb= MUc/Pc= . . . = MUn/Pn.
D)
TUa= TUb= TUc= . . . = TUn.
C
346)
The change in total utility derived when a customer consumes one more unit of a good or service is
called
346)
A)
total utility.
B)
average utility.
C)
marginal utility.
D)
final utility.
C
C
347)
Total satisfaction is maximized when
347)
A)
marginal utility is zero.
B)
marginal utility is positive.
C)
marginal utility is equal to total utility.
D)
marginal utility is negative.
348)
For good A and good B, the consumer maximizes personal satisfaction when
348)
A)
MUA/PA= PB/MUB.
B)
PA/MUA= PB/MUB.
C)
MUA/MUB= PA/PB.
D)
MUA/PA= MUB/PB.
Quantity Total Utility
per Week Michelle Robert David Lauren
0 0 0 0 0
1 50 1000 60 60
2 99 1900 120 130
3 147 2700 180 220
4 194 3400 240 310
5 240 4000 300 425
6 285 4500 360 575
7 329 4900 420 900
8 372 5200 480 1275
9 414 5400 540 1770
349)
According to the above table, what is Robert’s marginal utility of the 5th unit?
349)
A)
500
B)
4500
C)
60
D)
600
350)
The expression “getting the most bang for your buck” is an illustration of the
350)
A)
marginal utility/total utility ratio.
B)
marginal utility/price ratio.
C)
total utility/marginal utility ratio
D)
total utility/price ratio.
351)
If total utility is increasing, then marginal utility is
351)
A)
positive.
B)
zero.
C)
negative.
D)
decreasing.
352)
Use the above figure. The consumer’s choice changes from YA to YB. Which of the following
statements about good Y is TRUE?
352)
A)
price has decreased and the quantity demanded has risen.
B)
price has decreased and the quantity demanded has fallen.
C)
price has increased and the quantity demanded has risen.
D)
price has increased and the quantity demanded has fallen.
353)
According to the substitution effect, if the price of a product goes down
353)
A)
the real income of the consumer will increase, causing the consumer to want to buy more of
the good, creating a downward sloping demand curve.
B)
the consumer will buy more of the good at a lower price than at a higher price, creating a
horizontal demand curve.
C)
the consumer will not change the level of purchases of the good when the price changes,
making the demand curve a vertical line.
D)
the consumer will buy more of the good at the lower price than at a higher price, creating a
downward sloping demand curve.
Quantity of Total Quantity of Total
Magazines/Wk Utility Paperbacks/Wk Utility
0 0 0 0
160 1200
2100 2400
3130 3500
4 140 4550
5142 5575
6142 6 580
354)
Refer to the above table. If the price of a magazine is $2 and the price of a paperback book is $5 and
the consumer has $33, the rational consumer will purchase
354)
A)
2 magazines and 2 books.
B)
2 magazines and 3 books.
C)
4 magazines and 5 books.
D)
5 magazines and 6 books.
355)
An indifference curve shows
355)
A)
the set of consumption alternatives that yield the same amount of total utility.
B)
the combinations of goods that a consumer does not like very much.
C)
the combinations of goods that generate the same ratio of marginal utilities.
D)
the set of consumption alternatives that yield the same amount of marginal utility.
356)
Which of the following shows the feasible combinations of two goods that a consumer could afford
given her money income?
356)
A)
the income consumption curve
B)
the indifference map
C)
the budget constraint
D)
the price consumption curve
357)
When DVDs and hamburgers were the same price, Mavis consumed 3 hamburgers and 5 DVDs,
and Mavis received 10 utils from the last hamburger and 15 utils from the last DVD consumed.
What should be Mavis’ consumption strategy?
357)
A)
consume more of both items
B)
consume less of both items
C)
consume more burgers and fewer DVDs
D)
consume more DVDs and fewer burgers
Quantity Marginal Utility
of Pizza of Pizza
1 50
2 25
3 0
4 –25
358)
Using the above table, what is the maximum number of slices of pizza a rational consumer would
buy?
358)
A)
4
B)
3
C)
2
D)
1
359)
An indifference curve cannot be positively sloped because
359)
A)
the law of diminishing marginal utility would be violated.
B)
a point to the right of another point will represent a lower quantity of both goods and a
reduction in utility.
C)
the substitution effect would be violated.
D)
a point to the right of another point will represent a higher quantity of both goods and an
increase in utility.
360)
Suppose that indifference curve I1 lies to the right of indifference curve I2. We can conclude that
360)
A)
some, but not all, points on indifference curve I1 will correspond to lower utility than points
along indifference curve I2.
B)
all points along indifference curve I1 will correspond to higher utility than points along
indifference curve I2.
C)
some, but not all, points on indifference curve I1 will correspond to higher utility than points
along indifference curve I2.
D)
all points along indifference curve I1 will correspond to lower utility than points along
indifference curve I2.
361)
The utility that people experience from the consumption of a good depends on
361)
A)
how much shopping time they spent obtaining the good.
B)
total sales of the good.
C)
their income level.
D)
their tastes and preferences.
362)
Which economic principle accounts for the fact that all–you–can–eat buffet restaurants can be
profitable?
362)
A)
the principle of diminishing marginal utility
B)
the law of supply
C)
the principle of diminishing marginal product
D)
the law of demand
363)
The total utility of consuming 6 units of a good is 255. The marginal utility of the 6th unit is 45 and
the marginal utility of the 5th unit is 60. The total utility of consuming 5 units of the good is
363)
A)
210.
B)
195.
C)
150.
D)
300.
364)
The negative relationship between the quantity demanded of a commodity and its price can be
explained by the principle of
364)
A)
diminishing marginal utility.
B)
contingent valuation.
C)
indifference analysis.
D)
increasing total utility.
365)
The slope of the budget line is
365)
A)
negative because of the marginal rate of substitution.
B)
negative since to purchase more of one good means that some of the other good must be
given up.
C)
zero since prices of the goods and income are assumed to be constant.
D)
positive since prices and income are positive.
366)
Marginal utility is defined as
366)
A)
the increase in utility divided by the total number of units consumed.
B)
the number of units consumed divided by the total utility.
C)
the change in total utility divided by the change in number of units consumed.
D)
the total utility divided by the total number of units consumed.
367)
The rate of change in total utility equals
367)
A)
the rate of change in marginal utility divided by the price.
B)
marginal utility.
C)
the change in marginal utility divided by the change in quantity.
D)
the change in marginal utility associated with eating all the quantities a person can handle.
368)
The slope of the budget line will change
368)
A)
when the consumer’s income increases.
B)
when the total satisfaction changes.
C)
when the price of one of the products changes.
D)
when the consumer’s taste changes.
369)
If price of a product falls
369)
A)
the budget line rotates to the left.
B)
the marginal utility of the product also falls.
C)
the budget line rotates to the right.
D)
the indifference curve will shift to the left.
370)
In a map showing three indifference curves a consumer is most well off on
370)
A)
the curve that is in the middle.
B)
the curve which is closest to the origin of the coordinate axes.
C)
the curve which is most farther away from the coordinate axes.
D)
none of the above.
C
371)
The fact that the price of diamonds is higher than the price of water
371)
A)
can be explained only by behavioral economics but not by consumer choice theory.
B)
is an outcome of irrational behavior in consumer choice theory.
C)
can be explained as the outcome of a consumer optimum in consumer choice theory.
D)
cannot be explained by behavioral economics or consumer choice theory.
C
372)
If marginal utility is zero
372)
A)
a rational consumer will consume one less unit next time.
B)
a rational consumer will consume one more unit.
C)
a rational consumer will not consume additional units beyond this point.
D)
a rational consumer will consume one more unit if the price is zero.
C
C
373)
A curve where every combination of the two goods being considered yields the same level of
satisfaction is known as
373)
A)
an indifference curve.
B)
a total utility curve.
C)
a marginal utility curve.
D)
a budget constraint.
374)
If the last $5 spent on movies added 30 utils to your total satisfaction and the last $8 spent on books
add 64 utils
374)
A)
your total satisfaction is 94 utils.
B)
you can increase your satisfaction by buying only books.
C)
you can increase your satisfaction by buying fewer books and seeing more movies.
D)
you can increase your satisfaction by buying more books and seeing fewer movies.
375)
If a consumer is at an optimum, consuming X and Y, and the price of X decreases, then to get to a
new equilibrium the consumer must
375)
A)
purchase more X.
B)
purchase less X.
C)
purchase more of both X and Y.
D)
purchase less of both X and Y.
376)
For any two goods, X and Y, if MUX divided by PX equals 2.5 and MUY divided by PY equals 4.0,
then with given income and prices the consumer should
376)
A)
buy more of good X and less of good Y.
B)
buy more of good Y and less of good X.
C)
stop because an equilibrium is achieved.
D)
buy all of good Y and no X.
377)
The analysis of consumer decision making based on utility maximization is known as
377)
A)
market analysis.
B)
consumption analysis.
C)
utility analysis.
D)
specialization analysis.
Quantity of Total Quantity of Total
Hamburgers/Wk Utility Movies/Wk Utility
140 1400
2 60 2 700
376 3 850
486 4950
5 91 51000
693 61025
378)
Refer to the above table. The price of a hamburger is $2, the price of a movie is $10, and the
consumer has $44. What is the change in quantity demanded of hamburgers if the price of a
hamburger decreases to $1?
378)
A)
Quantity demanded increases by 3 hamburgers.
B)
Quantity demanded increases by 1 hamburger.
C)
Quantity demanded increases by 4 hamburgers.
D)
Quantity demanded increases by 2 hamburgers.
Quantity of Total Quantity of Total
Hamburgers/Wk Utility Broadway Shows/Wk Utility
1 40 1 400
260 2700
376 3850
486 4950
591 51000
693 61025
379)
Refer to the above table. If the price of a hamburger is $2, the price of a Broadway Show is $60, and
the consumer has $128, what is the consumer optimum?
379)
A)
3 hamburgers and 2 Broadway shows
B)
2 hamburgers and 2 Broadway shows
C)
2 hamburgers and 3 Broadway shows
D)
4 hamburgers and 2 Broadway shows
380)
John is currently spending all of his income. For the last unit of Good A consumed John gets 20 utils
and for the last unit of Good B consumed he gets 10 utils. The price of Good A is $4. The price of
Good B is $2. If John wants to maximize his utility he should
380)
A)
continue to purchase the same amount of Good A and Good B.
B)
increase the consumption of Good A and decrease the consumption of Good B.
C)
decrease the consumption of Good A and increase the consumption of Good B.
D)
decrease the consumption of Good A and decrease the consumption of Good B.
Slices of Pizza Total Utility Marginal Utility
1 50
2 90
3 120
4 130
5 137
6 120
381)
In the above table, what is the marginal utility of the sixth slice of pizza consumed?
381)
A)
137
B)
120
C)
–17
D)
7
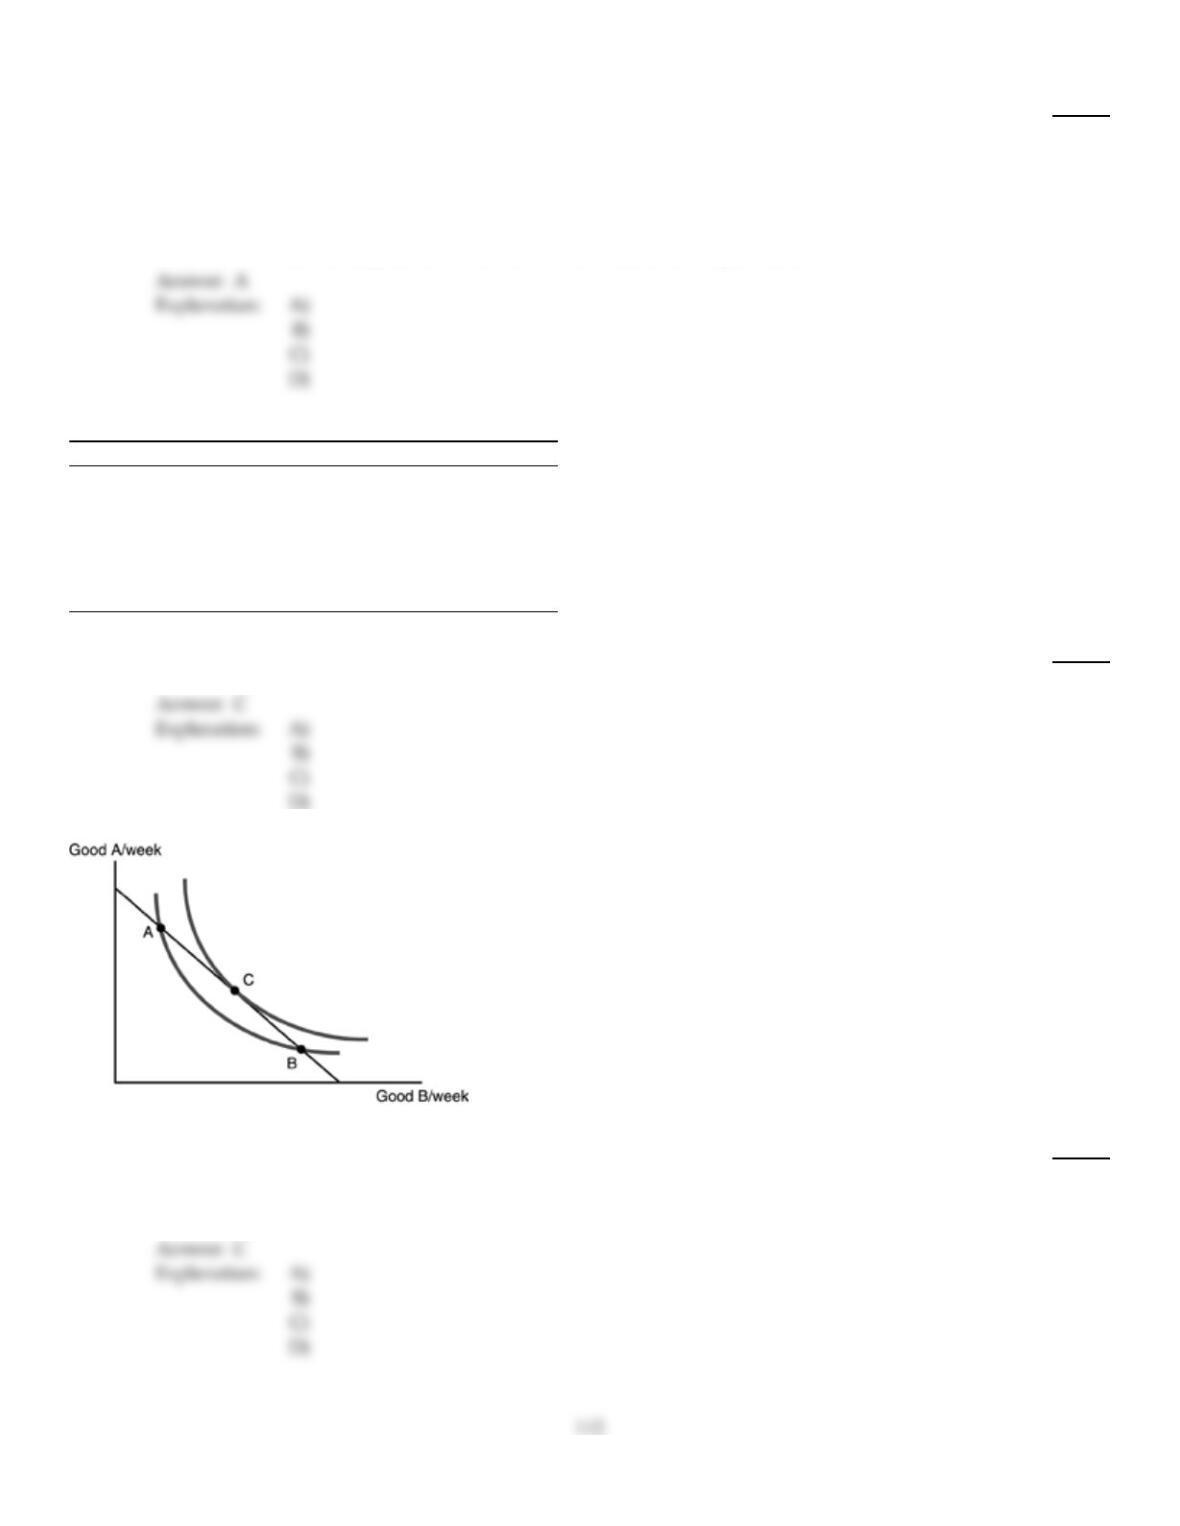
382)
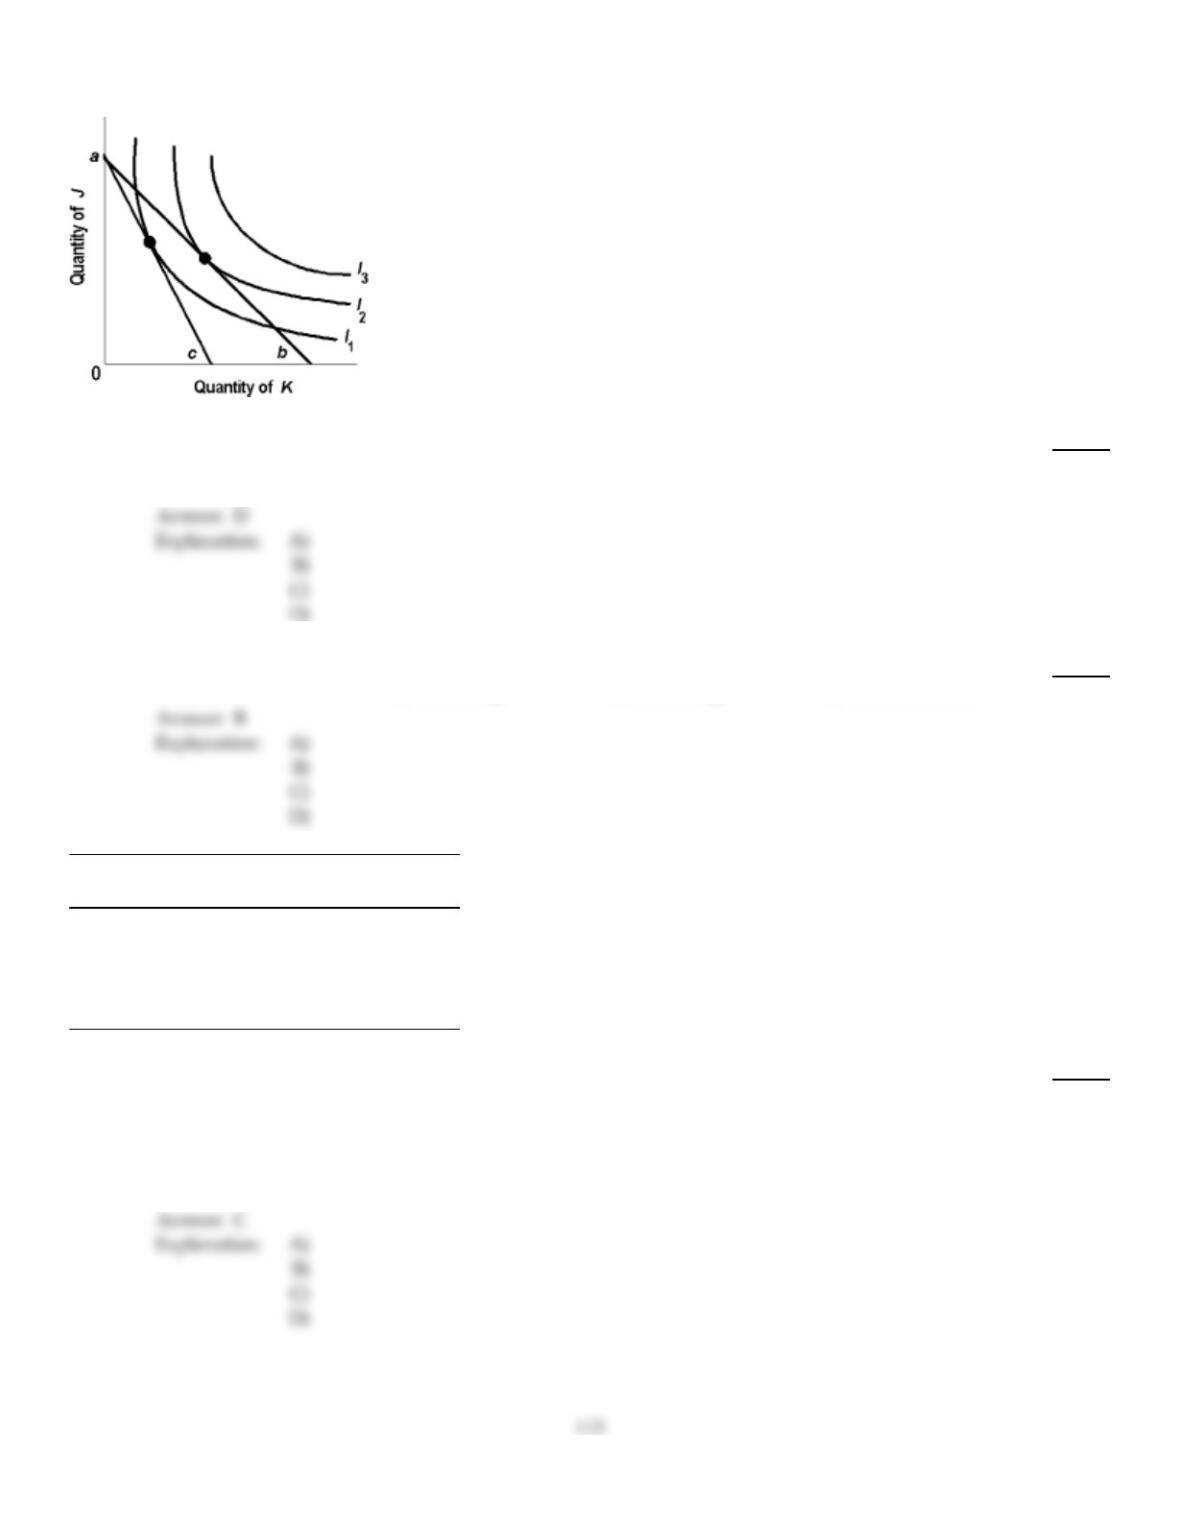
Refer to the above figure. Given the indifference map and budget constraint represented above the
consumer will maximize utility when she consumes at
382)
A)
point A.
B)
point B.
C)
point C.
D)
either points A or B.
383)
Use the above figure. When the budget line rotates from “b” to “c”
383)
A)
the price of product K decreases.
B)
the price of product J increases.
C)
the price of product J decreases.
D)
the price of product K increases.
384)
When marginal utility is positive, total utility is
384)
A)
zero.
B)
increasing.
C)
decreasing.
D)
at its minimum.
Quantity Quantity
of A TUa of B TUb
1 18 1 10
2 33 2 18
3 42 3 22
4 48 4 24
5 51 5 25
385)
The price of product A is $3, the price of product B is $2, and you have $18 to spend. What
combination of product A and product B will give you the most satisfaction?
385)
A)
5 units of product A; 1 unit of product B
B)
2 units of product A and 5 units of product B
C)
4 units of product A and 3 units of product B
D)
3 units of product A and 5 units of product B
386)
An increase in income will
386)
A)
make the budget constraint flatter.
B)
make the budget constraint steeper.
C)
shift the budget constraint to the right.
D)
make the budget constraint more bowed.
387)
One characteristic of indifference curves is that
387)
A)
they cannot intersect.
B)
they must intersect at the origin.
C)
they have a positive slope.
D)
they are straight lines.
388)
Indifference curves
388)
A)
are vertical.
B)
slope upward.
C)
are horizontal.
D)
slope downward.
Quantity of Movies Michelle’s Total Robert’s Total
Watched per Week Utility per Week Utility per Week
0 0 0
1100 100
2195 190
3270 270
4340 340
5390 400
6420 350
7435 390
8445 420
9450 440
10 440 450
389)
Refer to the above table. The marginal utility of the 5th movie for Robert is
389)
A)
50 units of utility.
B)
70 units of utility.
C)
400 units of utility.
D)
60 units of utility.
390)
Marginal utility is measured as
390)
A)
utility per unit of production.
B)
output of a good or service divided by price.
C)
extra utility from each additional good consumed.
D)
extra output divided by extra utility.
391)
Suppose that the quantity of hamburgers is measured along the vertical axis and that the number of
bags of popcorn is measured along the horizontal axis. The budget constraint has a vertical
intercept of 10 hamburgers, and the slope of the line is –1. If the price of popcorn doubles, we know
that
391)
A)
the consumer will buy half as many bags of popcorn as before.
B)
the new equilibrium will have a marginal rate of substitution of –0.5.
C)
the vertical axis of the budget line shifts to 5 hamburgers.
D)
the new equilibrium will have a marginal rate of substitution of –2.
392)
When the total utility from consuming one good is maximized, marginal utility is
392)
A)
minimized.
B)
positive.
C)
zero.
D)
maximized.
393)
The budget constraint shows the
393)
A)
amount of a good the consumer will buy at various prices.
B)
combinations of goods that generate the same amount of total satisfaction.
C)
changes in consumption of goods that a consumer makes when his income increases.
D)
possible combinations of goods that can be purchased with a specified income.
394)
A consumer was at an optimum. She then discovers that the marginal utility per dollar spent on
food is more than the marginal utility per dollar spent on gasoline. She knows then that
394)
A)
the price of gasoline must have decreased or the price of food must have increased.
B)
the price of food must have increased.
C)
the price of gasoline must have increased or the price of food must have decreased.
D)
the price of gasoline must have decreased.
395)
When economists refer to people making decisions at the margin, they mean that we compare
________ benefits with ________ costs.
395)
A)
total; incremental
B)
additional; marginal
C)
additional; additional
D)
total; total
396)
A set of indifference curves on a graph is called
396)
A)
a cluster.
B)
an indifference map.
C)
a difference map.
D)
a budget map.
Pizza Marginal Utility
1st Slice 7 utils
2nd Slice 6 utils
3rd Slice 4 utils
4th Slice 3 utils
397)
Suppose the price of pizza is $2 and the consumer optimum is reached when MU/P = 3. Tom’s
preferences for pizza are shown in the above table. How many slices will Tom buy?
397)
A)
1 slice
B)
2 slices
C)
3 slices
D)
4 slices
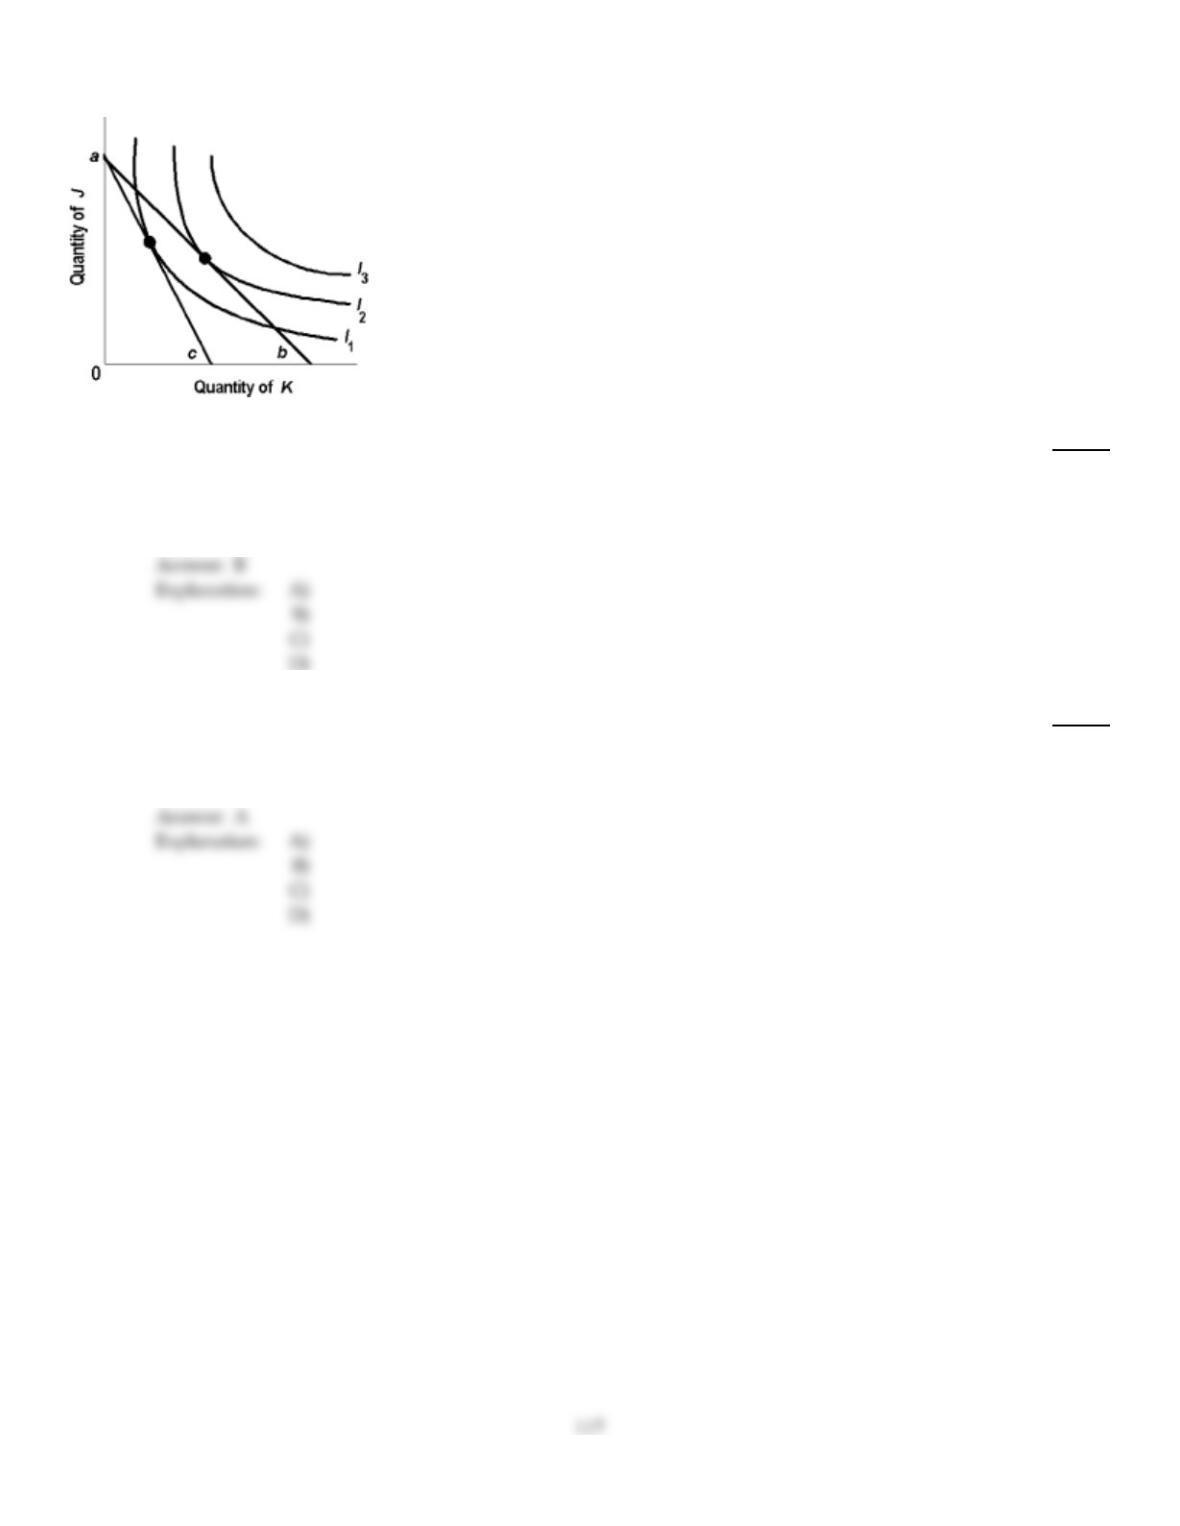
398)
Use the above figure. When the budget line rotates from “b” to “c”
398)
A)
fewer units of J and fewer units of K will be purchased.
B)
more units of J and fewer units of K will be purchased.
C)
more units of J and more units of K will be purchased.
D)
fewer units of J and more units of K will be purchased.
399)
If a consumer is at an optimum, consuming X and Y, and the price of X increases, then to get to a
new equilibrium the consumer must
399)
A)
purchase less X.
B)
purchase more of both X and Y.
C)
purchase less Y.
D)
purchase more X.
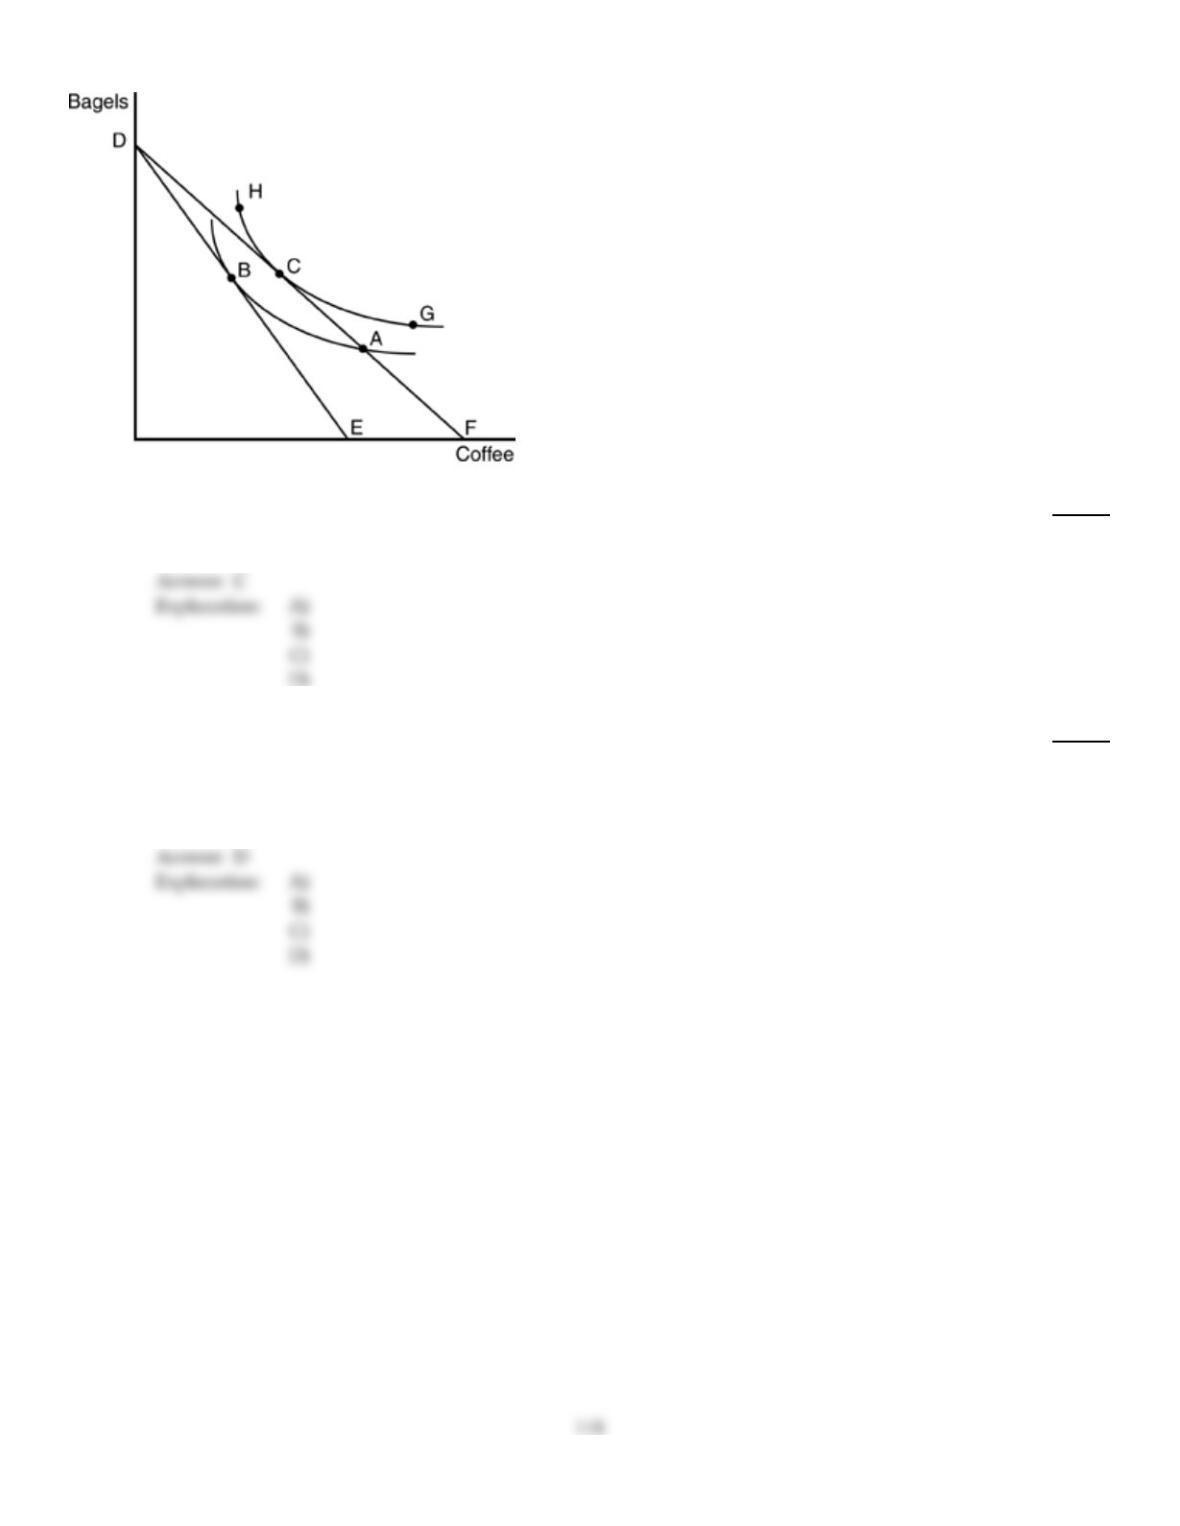
400)
In the above figure, budget line DF would swivel in to the left if
400)
A)
the price of bagels increased.
B)
the price of coffee decreased.
C)
the price of coffee increased.
D)
the price of bagels decreased.
401)
Regretting a last unit of consumption of cake implies that
401)
A)
cake is an inferior good.
B)
the demand curve for cake is horizontal.
C)
the total utility from eating cake was negative.
D)
the marginal utility of the last unit of cake consumed was negative.
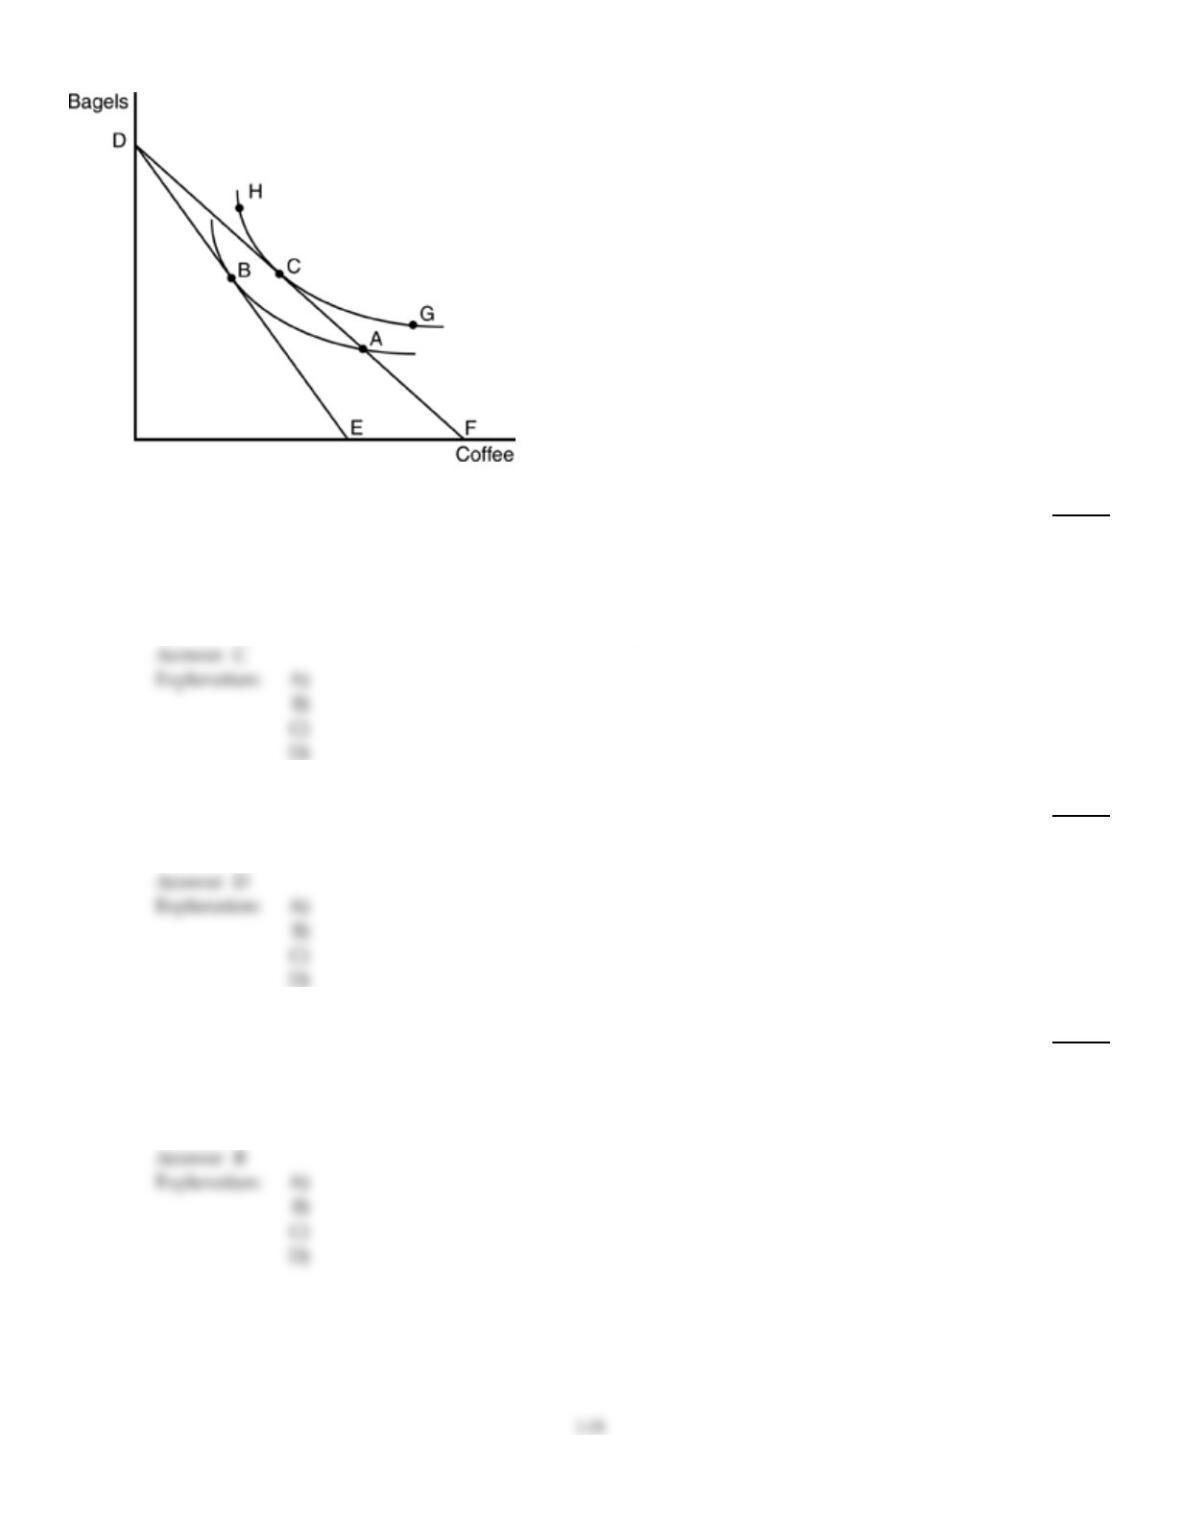
402)
In the above figure, if the budget line is originally line DE and the price of coffee decreases, the
consumer will
402)
A)
leave consumption of both coffee and bagels unchanged.
B)
drink more coffee and decrease bagel consumption slightly.
C)
drink more coffee and increase bagel consumption slightly.
D)
drink less coffee and increase bagel consumption slightly.
403)
Kathleen has eaten five donuts. The fifth donut makes Kathleen sick. This means that for Kathleen
403)
A)
donuts must be inexpensive.
B)
the opportunity cost of donuts is high.
C)
the fifth donut has little utility.
D)
the fifth donut has negative utility.
404)
The consumer optimum for consuming two goods is achieved when
404)
A)
the price of each good is equal.
B)
the marginal utility per last dollar spent is equal for the two goods.
C)
the total utility from each good is equal.
D)
the price multiplied by the marginal utility is equal for the two goods.
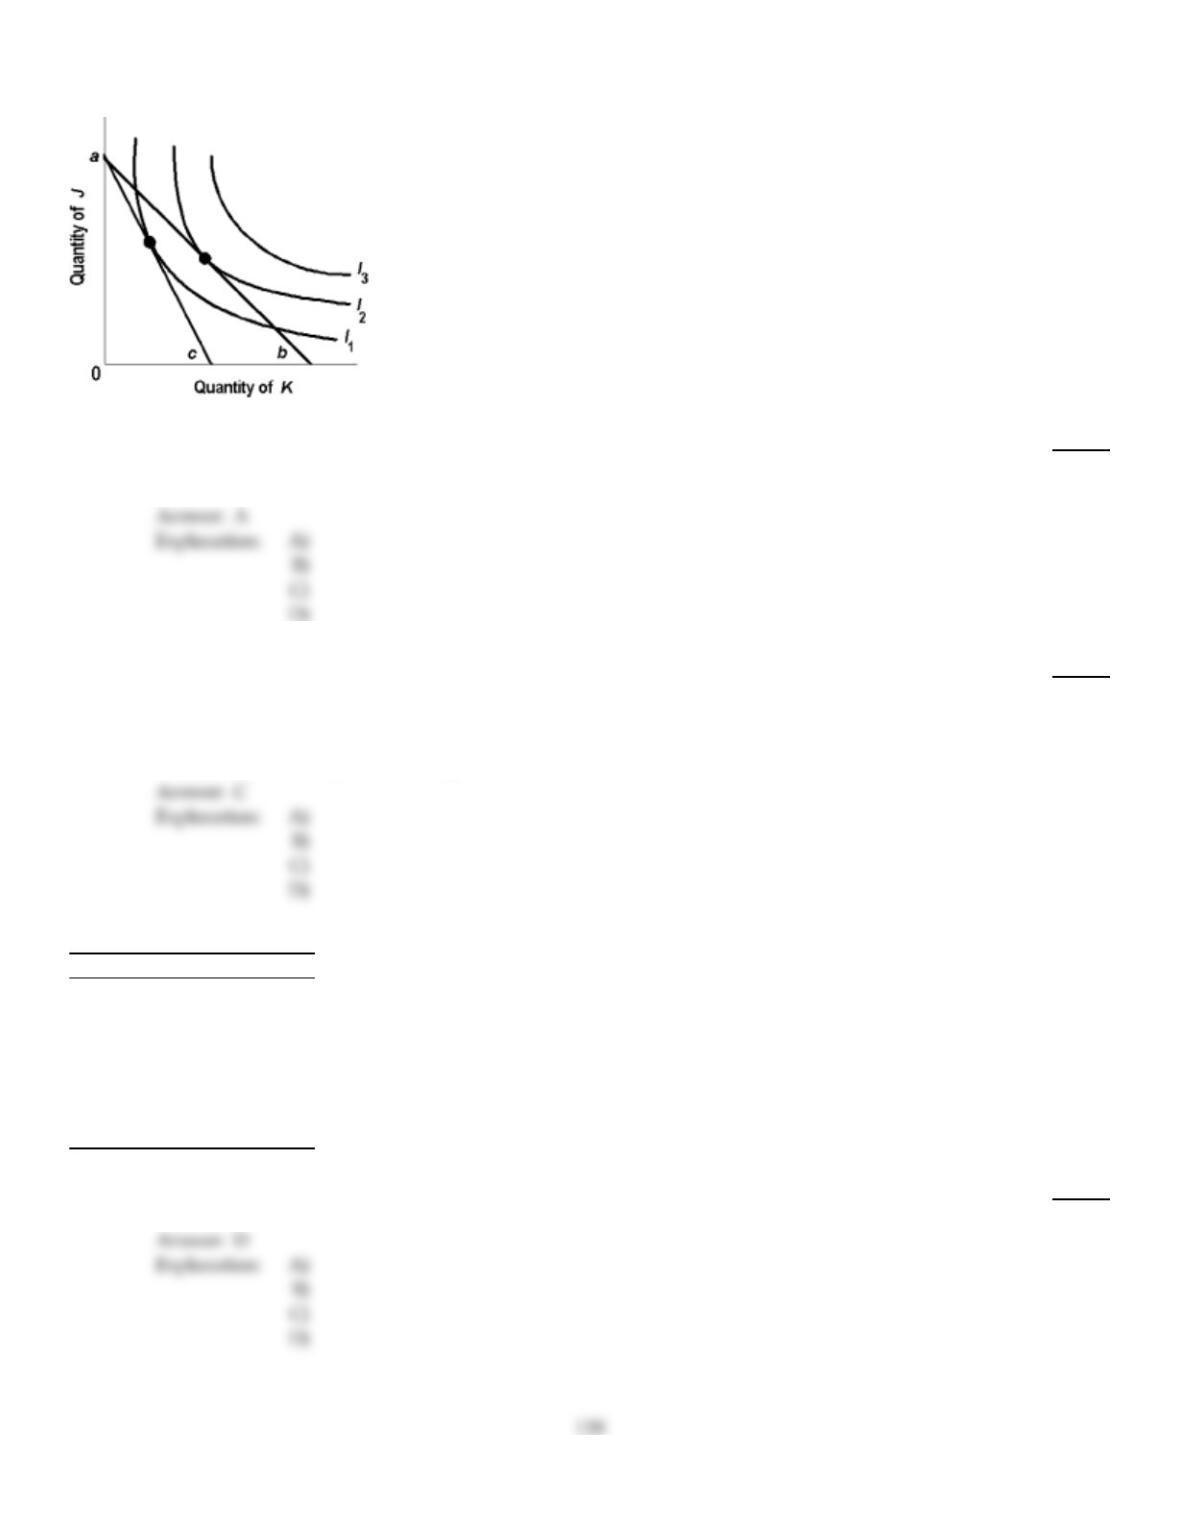
405)
Use the above figure. When the budget line rotates from “c” to “b”
405)
A)
the price of product K decreases.
B)
the price of product J increases.
C)
the price of product J decreases.
D)
the price of product K increases.
406)
The marginal utility derived from viewing the next movie DVD is the
406)
A)
average utility per hour of viewing.
B)
average utility per minute of viewing.
C)
additional utility from viewing the DVD.
D)
additional utility from viewing the first minute of the DVD.
Quantity Total Utility
0 0
110
225
335
442
547
649
407)
Refer to the above table. At what quantity does diminishing marginal utility set in?
407)
A)
after 0
B)
after 10
C)
after 1
D)
after 2