Thinking Like an Economist 403
50.
A relatively steep demand curve indicates that
a.
quantity demanded will adjust only slightly to a price change.
b.
quantity demanded will adjust significantly to a price change.
c.
quantity demanded will not adjust to a price change.
d.
the change in quantity demanded will exactly equal a change in price.
51.
A relatively flat demand curve indicates that
a.
quantity demanded will adjust only slightly to a price change.
b.
quantity demanded will adjust significantly to a price change.
c.
quantity demanded will not adjust to a price change.
d.
the change in quantity demanded will exactly equal a change in price.
52.
When income increases the slope of an individual’s demand curve, the demand curve
a.
turns positive.
b.
becomes undefined.
c.
remains negative.
d.
becomes infinite.
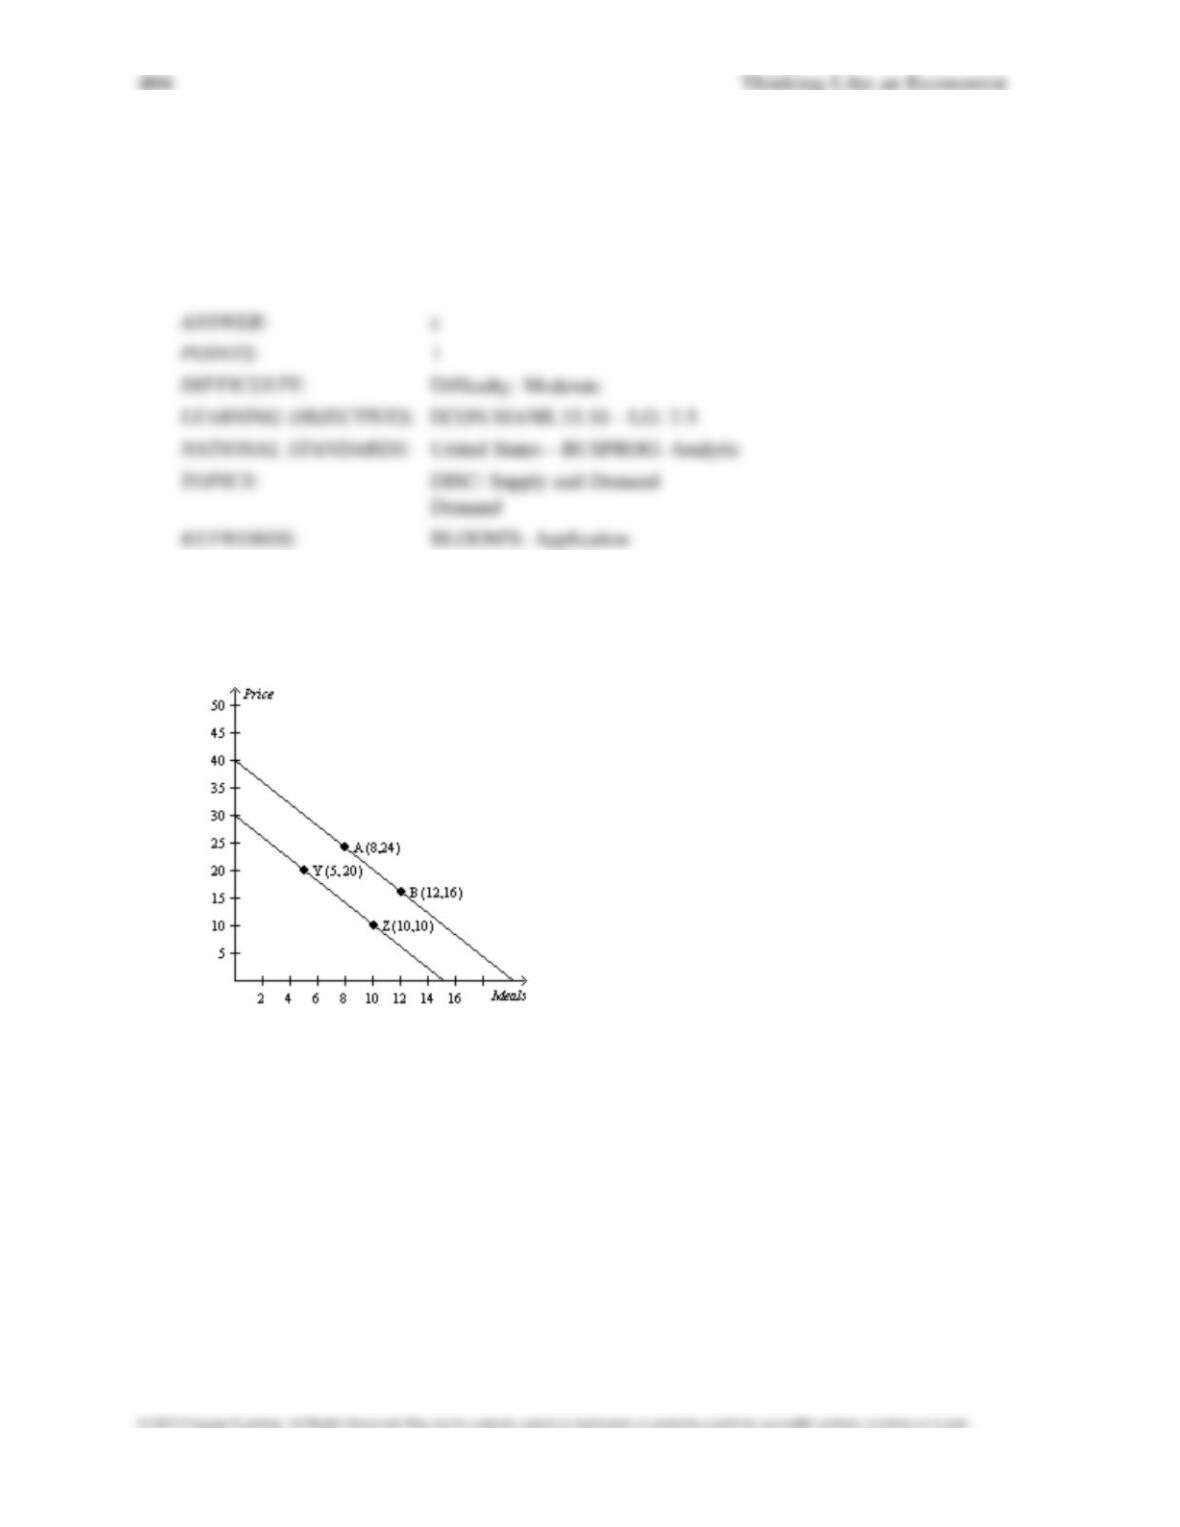
Figure 2-18
Relationship between Price and Restaurant Meals
53.
Refer to Figure 2-18. In the ordered pair (8, 24)
a.
the x-coordinate is 8 and the y-coordinate is 24.
b.
the x-coordinate is 24 and the y-coordinate is 8.
c.
the numbers tell the location of the origin.
d.
the 8 represents the price and the 24 represents the number of restaurant meals.
54.
Refer to Figure 2-18. The slope of the line containing points Y and Z is
a. -0.5.
b.
–1.
c.
–2.
d.
–4.
55.
Refer to Figure 2-18. The slope of the line containing points A and B is
a. -1/2.
b.
–2.
c.
1/2.
d.
2.
56.
Refer to Figure 2-18. A movement from point A to point Z is called
a.
a shift in demand.
b.
a movement along the demand curve.
c.
a shift in supply.
d.
a movement along the supply curve.
57.
Refer to Figure 2-18. A movement from point A to point B is called
a.
a shift in demand.
b.
a movement along the demand curve.
c.
a shift in supply.
d.
a movement along the supply curve.
58.
Refer to Figure 2-18. Which of the following could result in a movement from point A to point B?
a.
a change in income
b.
a change in the cost of producing a restaurant meal
c.
a change in the price of restaurant meals
d.
a change in the price of movies
59.
Refer to Figure 2-18. Which of the following could result in a movement from point B to point Z?
a.
a change in the price of a restaurant meal
b.
a change in the number of restaurant meals demanded
c.
a change in income
d.
Both a and b are correct.
60.
Suppose that someone makes the argument that because empty alcohol containers are found at
many accidents, the
containers cause accidents. This would be an example of
a.
sound logic.
b.
reverse causality.
c.
omitted variables.
d.
bias.
61.
Alfonso has noticed that increases in unemployment insurance claims are associated with
recessions, and therefore
he advocates limits on unemployment insurance so as to prevent
recessions. Mary has noticed that most drug addicts
once attended schools, and therefore she
advocates getting rid of schools so as to prevent drug addiction.
a.
The reasoning of both Alfonso and Mary suffers from the omitted variable problem.
b.
The reasoning of both Alfonso and Mary suffers from the reverse causality problem.
c.
Alfonso’s reasoning suffers from the reverse causality problem, and Mary’s reasoning suffers
from the omitted variable problem.
d.
Mary’s reasoning suffers from the reverse causality problem, and Alfonso’s reasoning suffers
from the
omitted variable problem.
62.
In the early 19th century, the Russian government sent doctors to southern Russian villages to
provide assistance
during a cholera epidemic. The villagers noticed that wherever doctors
appeared, people died. Therefore, many
doctors were chased away from villages, and some were
even killed. This reaction to the correlation between
doctors and deaths is most likely a problem of
a.
omitted variables.
b.
reverse causality.
c.
government propaganda.
d.
medical incompetence.
63.
The argument that purchases of minivans cause large families is an example of
a.
omitted variables.
b.
normative statements.
c.
reverse causality.
d.
bias.
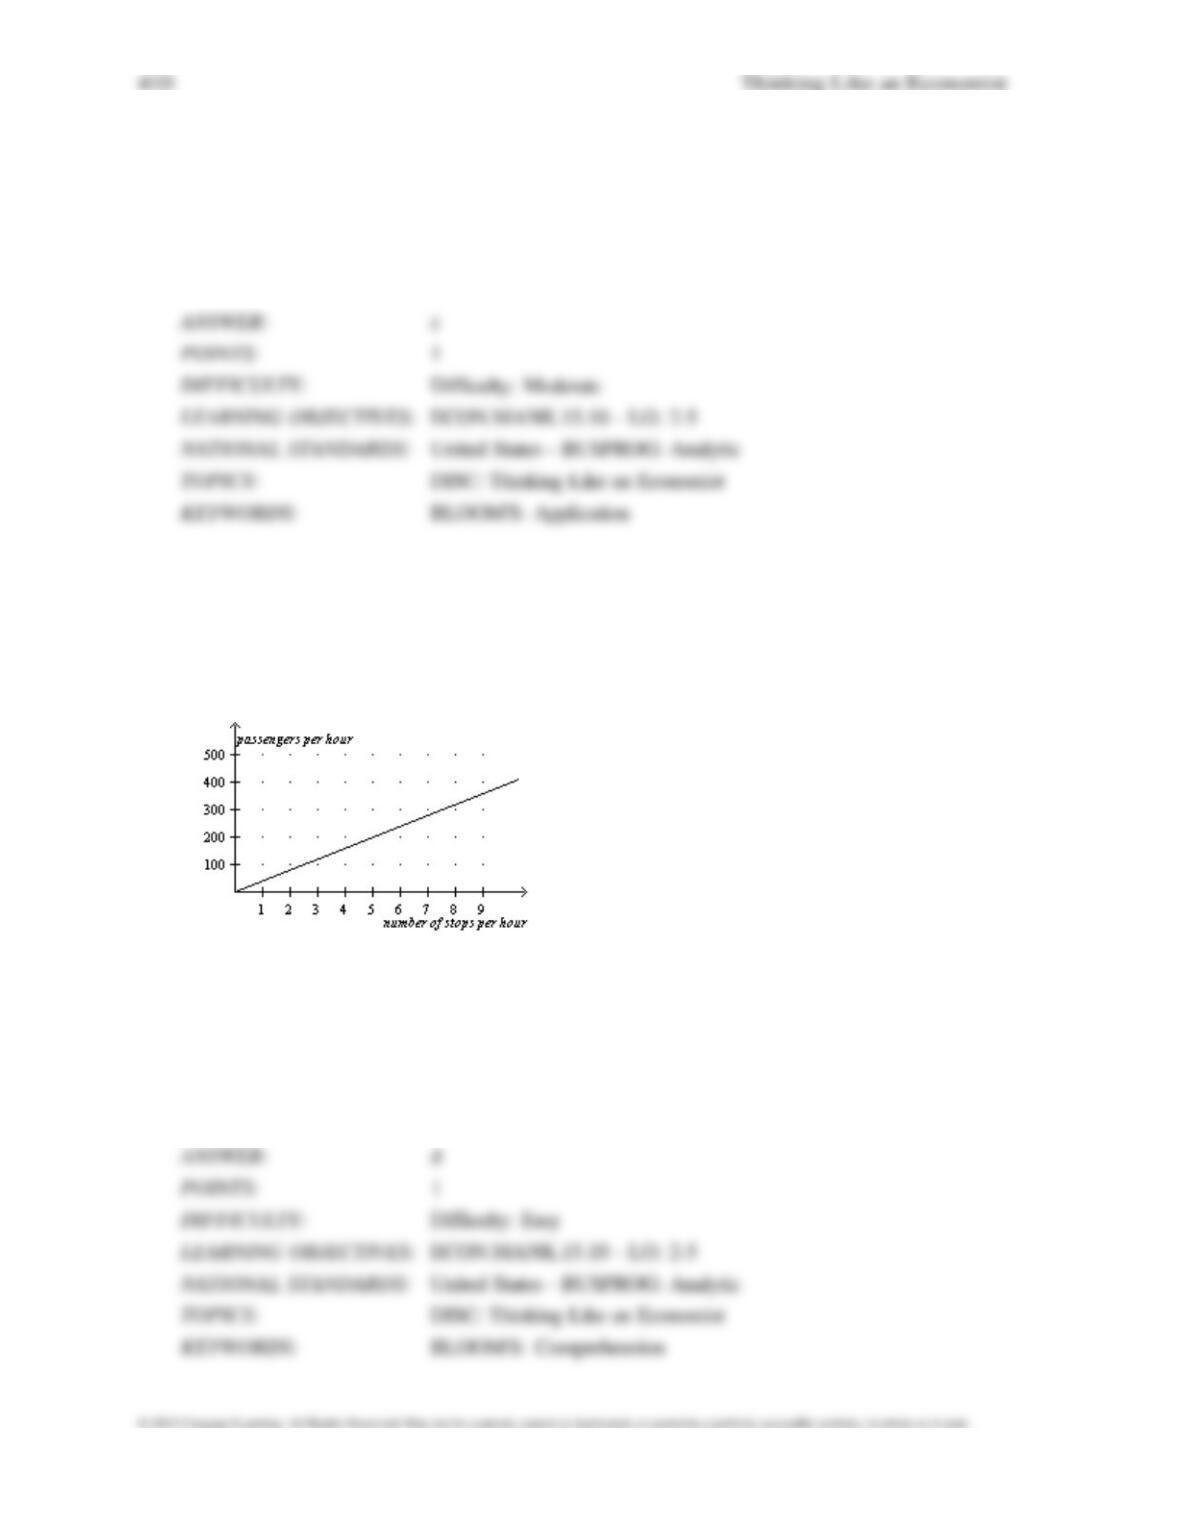
Figure 2-19
In the following graph the x-axis shows the number of times a commuter rail train stops at a
station per hour and the
y-axis shows the number of commuter rail passengers per hour.
Commuter Rail Passengers by Frequency of Service
64.
Refer to Figure 2-19. Which of the following conclusions should not be drawn from observing
this graph?
a.
There is a positive correlation between the frequency of service and the number of passengers.
b.
When there are 5 stops per hour, there are approximately 200 passengers.
c.
More stops per hour is associated with more passengers per hour.
d.
No other factors besides the frequency of service affect the number of passengers.
Thinking Like an Economist 411
65.
Refer to Figure 2-19. A policymaker observes this graph and concludes that increasing the
frequency of
commuter rail service is a certain way to get more commuters to choose the
commuter rail instead of driving their
own cars. You warn the policymaker about making a reverse
causality mistake with which of the following
statements?
a.
Higher gas prices are causing more people to choose the commuter rail over driving.
b.
The service frequency was increased in response to an increase in the number of passengers
per hour.
c.
There is a positive relationship between frequency of stops and number of passengers.
d.
None of the above is correct.
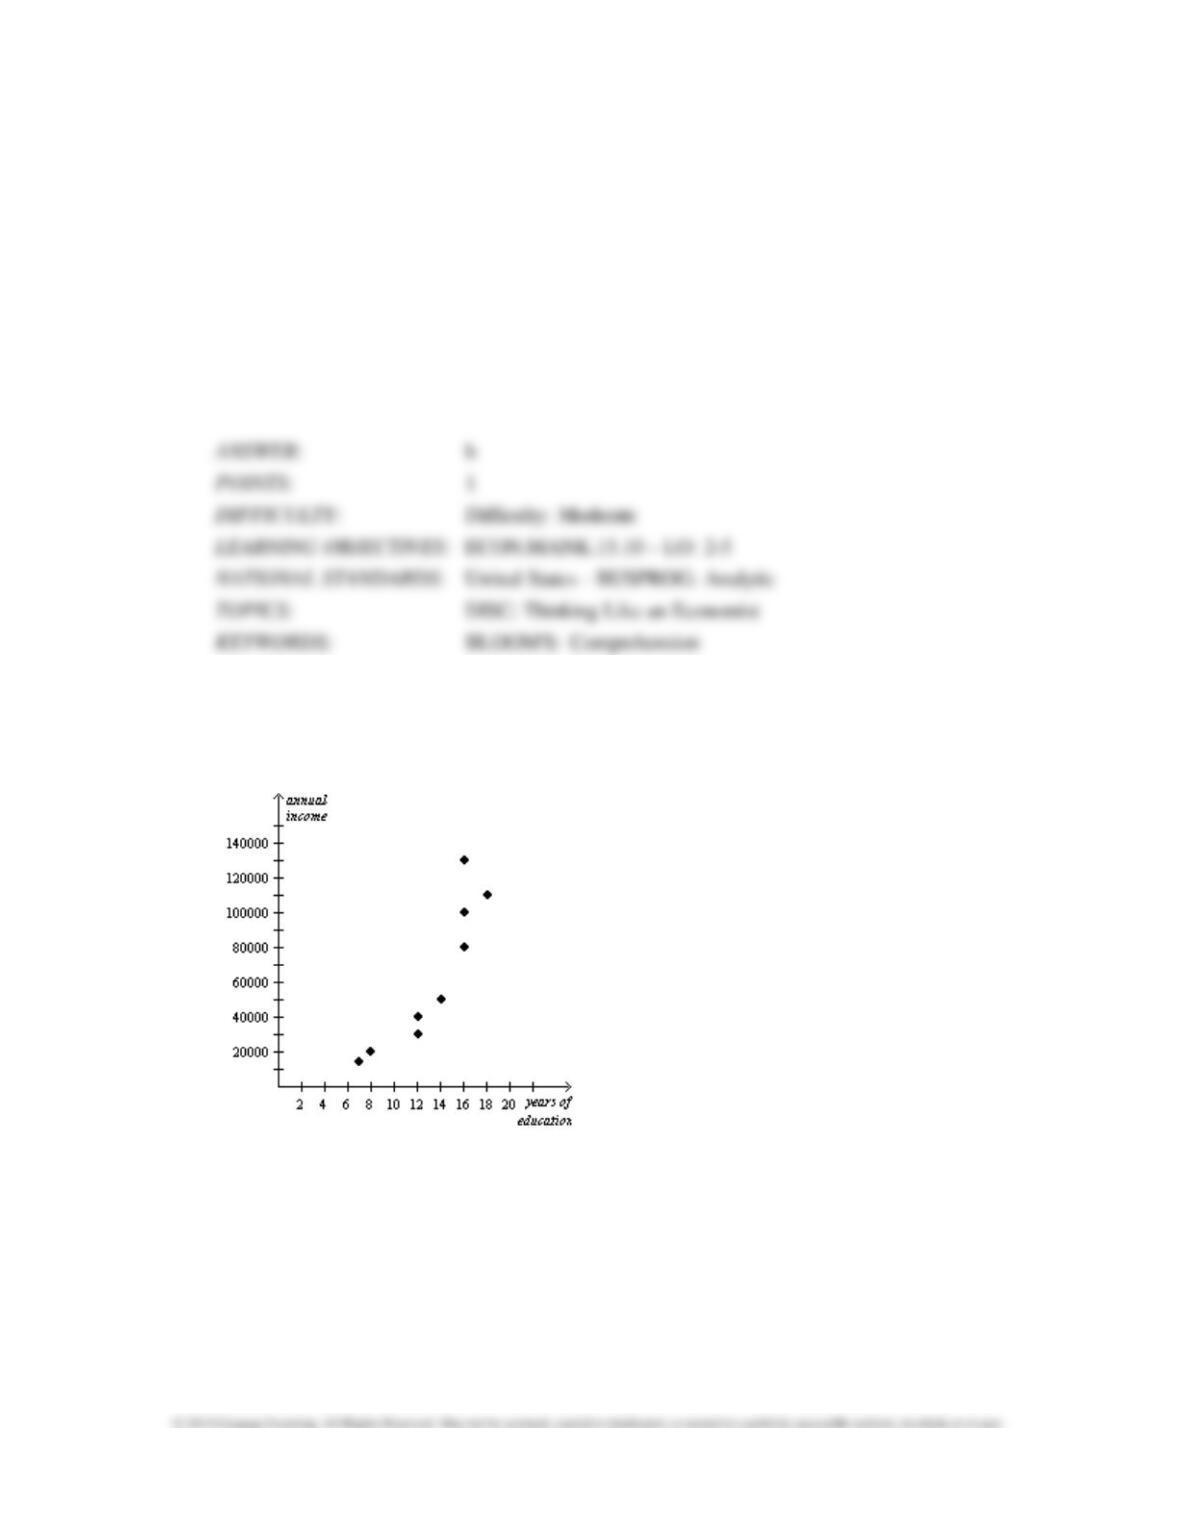
Figure 2-20
Relationship Between Years of Education and Annual Income

66.
Refer to Figure 2–20. The graph above is a
a.
bar graph
b.
scatterplot
c.
pie chart
d.
time series analysis
67.
Refer to Figure 2–20. According to the graph, the correlation between years of education and
annual income is
a.
positive
b.
negative
c.
inverse
d.
normative
68.
Refer to Figure 2-20. Senator Smith observes the graph and concludes that people who earn
higher incomes
attend school for more years. Senator Jones observes the graph and concludes
that people who attend school for
more years earn higher incomes. Who is correct?
a.
Senator Smith is correct.
b.
Senator Jones is correct.
c.
It is difficult to say which senator might be correct due to the reverse causality problem.
d.
It is difficult to say which senator might be correct due to omitted variable bias.
69.
In the ordered pair (3, 6), 3 is the
a.
x-coordinate.
b.
y-coordinate.
c.
origin.
d.
slope.
70.
Between the two ordered pairs (3, 6) and (7, 18), the slope is
a. 1/3
b. -1/3.
c.
3.
d.
–3.
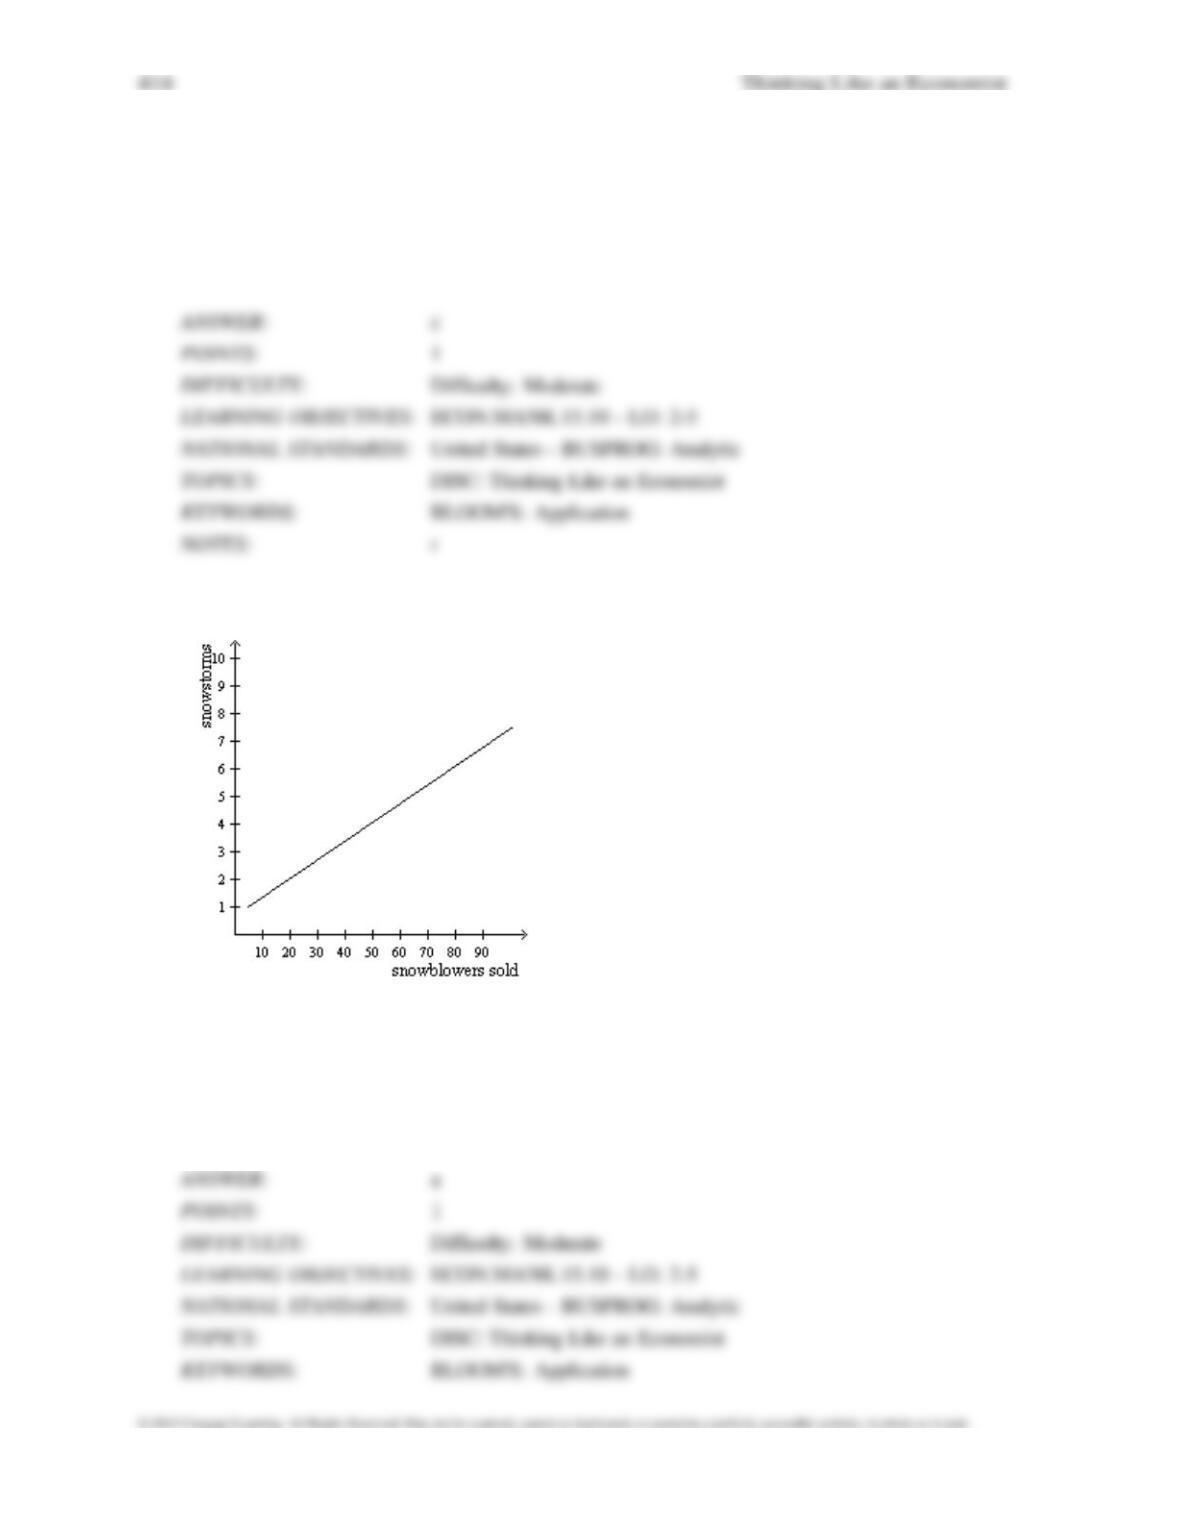
Figure 2-21
71.
Refer to Figure 2–21. According to the graph, snowstorms
a.
and snowblowers sold are positively correlated.
b.
and snowblowers sold are negatively correlated
c.
and snowblowers sold are uncorrelated.
d.
are caused by more snowblowers being sold.
72.
Refer to Figure 2-21. Your friend John created the graph above to illustrate that snowstorms are
caused by more
snowblowers being sold. You inform him that his interpretation is incorrect due to
a.
omitted variable bias.
b.
reverse causality.
c.
slope mismatch.
d.
shifting versus moving along a curve.
73.
Refer to Figure 2–21. Which of the following could be an omitted variable in the graph?
a.
the price of snowblowers
b.
a change in consumers’ incomes
c.
a change in the seasons
d.
All of the above are correct.

416 Thinking Like an Economist
True/False and Short Answer
1.
Economists try to address their subject with a scientist’s objectivity.
a.
True
b.
False
2.
Economists devise theories, collect data, and then analyze these data in an attempt to verify or
refute their theories.
a.
True
b.
False
3.
The scientific method is the dispassionate development and testing of theories about how the world
works.
a.
True
b.
False

4.
The scientific method can be applied to the study of economics.
a.
True
b.
False
5.
While the scientific method is applicable to studying natural sciences, it is not applicable to studying
a nation’s economy.
a.
True
b.
False
6.
For economists, conducting experiments is often difficult and sometimes impossible.
a.
True
b.
False

7.
Economists usually have to make do with whatever data the world happens to give them.
a.
True
b.
False
8.
It is difficult for economists to make observations and develop theories, but it is easy for economists
to run
experiments to generate data to test their theories.
a.
True
b.
False
9.
Since economists cannot use natural experiments offered by history, they must use carefully
constructed laboratory
experiments instead.
a.
True
b.
False
10.
Historical episodes are not valuable to economists.
a.
True
b.
False
11.
Historical episodes allow economists to illustrate and evaluate current economic theories.
a.
True
b.
False
12.
Good assumptions simplify a problem without substantially affecting the answer.
a.
True
b.
False

13.
Assumptions can simplify the complex world and make it easier to understand.
a.
True
b.
False
14.
Economists often find it worthwhile to make assumptions that do not necessarily describe the real
world.
a.
True
b.
False
15.
Economists use one standard set of assumptions to answer all economic questions.
a.
True
b.
False
16.
Economic models are most often composed of diagrams and equations.
a.
True
b.
False
17.
Economic models omit many details to allow us to see what is truly important.
a.
True
b.
False
18.
Economic models can help us understand reality only when they include all details of the economy.
a.
True
b.
False
19.
An economic model can accurately explain how the economy is organized because it is designed
to include, to the
extent possible, all features of the real world.
a.
True
b.
False
20.
All scientific models, including economic models, simplify reality in order to improve our
understanding of it.
a.
True
b.
False
21.
The circular-flow diagram explains, in general terms, how the economy is organized and how
participants in the
economy interact with one another.
a.
True
b.
False