Chapter 2—Production Possibilities, Opportunity Cost, and Economic Growth
MULTIPLE CHOICE
1. Which of the following is not one of the three fundamental economic questions?
a.
What happens when you add to or subtract from a current situation?
b.
For whom to produce?
c.
How to produce?
d.
What to produce?
2. Which of the following correctly lists the three fundamental economic questions?
a.
If to produce? Why to produce? When to produce?
b.
If to produce? What to produce? How to produce?
c.
Why to produce? What to produce? How to produce?
d.
What to produce? How to produce? For whom to produce?
3. Three basic decisions must be made by all economies. What are they?
a.
How much will be produced, when it will be produced, and how much it will cost.
b.
What the price of each good will be, who will produce each good, and who will consume
each good.
c.
What will be produced, how goods will be produced, and for whom goods will be
produced.
d.
How the opportunity cost principle will be applied, if and how the law of comparative
advantage will be utilized, and whether the production possibilities constraint will apply.
4. Because of the problem of scarcity, each economic system must make which of the following choices?
a.
How to produce?
c.
For whom to produce?
b.
What to produce?
d.
All of these.
5. Which fundamental economic question is most closely related to the issues of income distribution and
poverty?
a.
The What to Produce question.
c.
The How to Produce question.
b.
The Why to Produce question.
d.
The For Whom to Produce question.
6. Which fundamental economic question requires society to choose the technological and resource mix
used to produce goods?
a.
The What to Produce question.
c.
The How to Produce question.
b.
The Why to Produce question.
d.
The For Whom to Produce question.
7. Opportunity cost:
a.
represents the best alternative sacrificed for a chosen alternative.
b.
has no relationship to the various alternatives that must be given up when a choice is made
in the context of scarcity.
c.
represents the worst alternative sacrificed for a chosen alternative.
d.
Represents all possible alternatives sacrificed for a chosen alternative.
8. The opportunity cost of an action is:
a.
the monetary payment the action required.
b.
the total time spent by all parties in carrying out the action.
c.
the value of the best opportunity that must be sacrificed in order to take the action.
d.
the cost of all alternative actions that could have been taken, added together.
9. The highest valued alternative that must be given up in order to choose an option is called the:
a.
opportunity cost.
c.
scarcity expense.
b.
utility cost.
d.
disutility option.
10. Which of the following sayings best reflects the concept of opportunity cost?
a.
“You can’t teach an old dog new tricks.”
b.
“There is no such thing as a free lunch.”
c.
“I have a baker’s dozen.”
d.
“There’s no business like show business.”
11. The opportunity cost to a city for using local tax revenues to construct a new park is the:
a.
best alternative foregone by building the park.
b.
dollar cost of constructing the new park.
c.
dollar cost of the old park.
d.
increased taxes necessary to pay for maintenance of the new park.
12. A good or service that is forgone by choosing one alternative over another is called a(n):
a.
explicit cost.
c.
historical cost.
b.
opportunity cost.
d.
accounting cost.
13. Opportunity cost is the:
a.
cost incurred when one fails to take advantage of an opportunity.
b.
price paid for goods and services.
c.
cost of the best option forgone as a result of choosing an alternative option.
d.
undesirable aspects of an option.
14. The opportunity cost of a purchase is:
a.
the selling price of the good or service.
b.
zero if the good or service satisfies a need.
c.
greater for persons who are rich.
d.
the good or service given up for the good or service purchased.
15. The opportunity cost of watching television is:
a.
all of the alternative programs that appear on other stations.
b.
zero because there is no money expenditure involved.
c.
the alternative use of the time foregone by watching the program.
d.
zero if it benefits you.
16. Which of the following does not illustrate opportunity cost?
a.
If I study, I must give up going to the football game.
b.
If I buy a computer, I must do without a 35” television.
c.
More consumer spending now means more spending in the future.
d.
If I spend more on clothes, I must spend less on food.
17. Which of the following does not illustrate opportunity cost?
a.
If I study, I must give up going to the football game.
b.
If I buy a computer, I must do without a 35” television.
c.
If I spend more on clothes, I must spend less on food.
d.
All of these illustrate opportunity cost.
18. The opportunity cost of an economic decision is:
a.
the best alternative that was sacrificed.
b.
the amount of money needed to implement the decision.
c.
any land, labor, and capital that are wasted.
d.
all options that were lost due to scarcity.
19. Bill has $10 to spend on a Superman, Batman, or an X-Men T-shirt. Bill buys the Superman T-shirt
and the Batman shirt was a close second choice. What is the opportunity cost?
a.
The amount he spent, $10.
b.
Nothing, since he got his preferred choice.
c.
The Batman T-shirt.
d.
The X-Men T-shirt.
20. On a production possibilities curve, the opportunity cost of good X, in terms of good Y, is represented
by the:
a.
distance to the curve from the vertical axis.
b.
distance to the curve from the horizontal axis.
c.
movement along the curve.
d.
all of these.
21. Which of the following statements is true?
a.
An opportunity cost is what must be given up in order to get something else.
b.
The three fundamental economic questions refer to What to produce? How to produce?
and When to produce?
c.
The term “investment” refers to the purchase of stocks and bonds and other financial
securities.
d.
The law of increasing opportunity cost implies that as production of one type of good is
expanded then fewer and fewer of other goods must be given up.
22. The amount of a good that must be given up to produce another good is the concept of:
a.
scarcity.
b.
specialization.
c.
trade.
d.
efficiency.
e.
opportunity cost.
23. The opportunity cost of an activity means the:
a.
amount of money the activity costs.
b.
number of hours that is required to engage in this activity.
c.
expected gains by engaging in the activity.
d.
amount of other things that must be sacrificed in order to engage in the activity.
e.
expected gains minus the expected costs of engaging in the activity.
24. In the context of the production possibilities curve, opportunity cost is measured in:
a.
dollars paid for the goods.
b.
the quantity of other goods given up.
c.
the value of the resources used.
d.
changing technology.
e.
units of satisfaction.
25. Mikki decides to work five hours the night before her economics exam. She earns an extra $75, but her
exam score is 10 points lower than it would have been had she stayed home and studied. Her
opportunity cost is the:
a.
five hours she worked.
b.
$75 she earned.
c.
10 points she lost on her exam.
d.
time she could have spent watching television.
e.
guilt she feels about neglecting her economics studies.
26. When the opportunity cost of producing carrots increases as more carrots are produced, then:
a.
no more carrots will be produced.
b.
resources are equally suited to the production of carrots and to other goods.
c.
the production possibilities curve is a straight line.
d.
the production possibilities curve becomes positively sloped.
e.
the law of increasing costs is present.
27. The opportunity cost of your college education is:
a.
c and d.
b.
d and e.
c.
the actual dollar cost of your college education.
d.
your best alternative use of the money you spend for a college education.
e.
money you could have earned working instead of going to college.
28. The law of increasing costs indicates that the opportunity cost of producing a good:
a.
is proportional to the production of the good.
b.
is constant to the production of the good.
c.
increases as more of the good is produced.
d.
decreases as more of the good is produced.
e.
increases as less of the good is produced.
29. The amount of a good that is given up to produce another good is:
a.
its dollar cost.
b.
its opportunity cost.
c.
its relative cost.
d.
its absolute cost.
e.
all of these.
Exhibit 2-1 Production possibilities curve data
Consumption
Goods
Capital
Goods
10
0
9
1
7
2
4
3
0
4
30. In Exhibit 2-1, according to the information, the opportunity cost of producing 3 units of capital is:
a.
3 units of consumption goods.
c.
6 units of consumption goods.
b.
4 units of consumption goods.
d.
7 units of consumption goods.
31. In Exhibit 2-1, the opportunity cost of producing the fourth unit of capital is:
a.
0.
b.
1 unit of consumption goods.
c.
2 units of consumption goods.
d.
4 units of consumption goods.
e.
there is not enough information to estimate the opportunity cost.
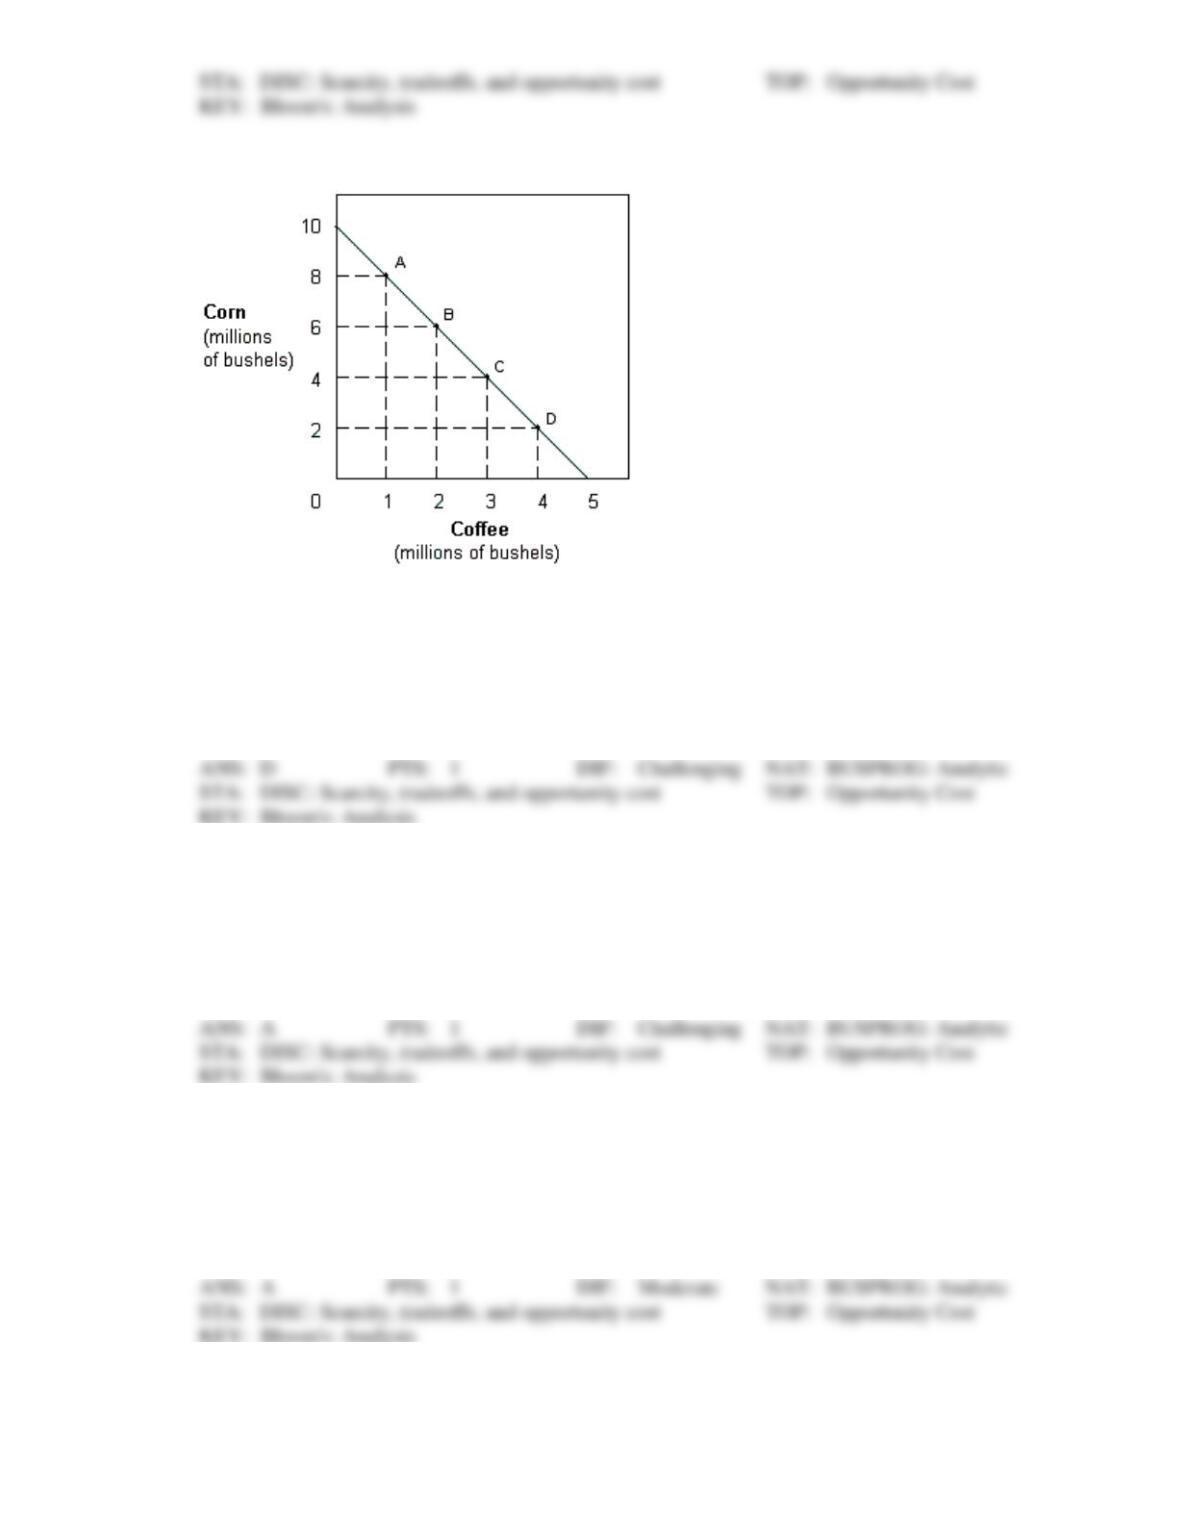
Exhibit 2-2 Production possibilities curve
32. The production possibilities in Exhibit 2-2 indicates that the opportunity cost of corn is:
a.
increasing.
b.
decreasing.
c.
zero.
d.
constant.
e.
indeterminate.
33. In Exhibit 2-2, the slope of the production possibilities curve indicates that the opportunity cost of:
a.
coffee is constant.
b.
coffee is increasing.
c.
coffee is decreasing.
d.
corn is increasing.
e.
corn is decreasing,
34. In Exhibit 2-2, the opportunity cost of coffee when moving from A to B is:
a.
2 million bushels of corn.
b.
6 million bushels of corn.
c.
8 million bushels of corn.
d.
14 million bushels of corn.
e.
it is not possible to determine.
35. In Exhibit 2-2, the opportunity cost of coffee when moving from A to B is:
a.
the same as moving from A to C.
b.
the same as moving from A to D.
c.
the same as moving from B to D.
d.
the same as moving from B to C.
e.
it is not possible to determine.
36. A farmer is deciding whether or not to add fertilizer to his or her crops. If the farmer adds 1 pound of
fertilizer per acre, the value of the resulting crops rises from $80 to $100 per acre. According to
marginal analysis, the farmer should add fertilizer if it costs less than:
a.
$12.50 per pound.
c.
$80 per pound.
b.
$20 per pound.
d.
$100 per pound.
37. Which word best completes the following sentence? A rational decision maker always chooses the
option for which marginal benefit is __________ marginal cost.
a.
less than
b.
equal to
c.
unrelated to
d.
more than
38. In economics, the term marginal refers to:
a.
the change or difference from a current situation.
b.
man-made resources as opposed to natural resources.
c.
the satisfaction a consumer receives from a good.
d.
holding everything else constant in the analysis.
39. When deciding whether to buy a second car, marginal analysis indicates that the purchaser should
compare the:
a.
benefits expected from two cars with the cost of both.
b.
additional benefits expected from a second car with the cost of the two cars.
c.
dollar cost of the two cars with the potential income that the cars will generate.
d.
additional benefits of the second car with the additional cost of the second car.
40. While waiting in line to buy two tacos at 80 cents each and a medium drink for 90 cents, Jordan
notices that the restaurant has a value meal containing three tacos and a medium drink all for $3. For
Jordan, the marginal cost of the third taco would be:
a.
zero.
c.
80 cents.
b.
50 cents.
d.
$1.
41. While waiting in line to buy a cheeseburger for $2 and a drink for 75 cents, Aaron notices that the
restaurant has a value meal containing a cheeseburger, drink, and French fries for $3. For Aaron, the
marginal cost of purchasing the French fries:
a.
would be zero.
b.
would be 25 cents.
c.
would be 50 cents.
d.
cannot be determined because the information about the price of the French fries is not
provided.
42. While waiting in line to buy one cheeseburger for $1.50 and a medium drink for $1.00, Sally notices
that she could get a value meal that contains both the cheeseburger and medium drink and also a
medium order of fries for $2.75. She thinks to herself, “Is it worth the extra 25 cents to get the medium
fries?” To an economist, Sally’s decision is an example of:
a.
marginal analysis.
b.
basing decisions on total, rather than marginal, value.
c.
an unintended consequence.
d.
the fallacy of composition.
43. Just before class, Jim tells Stuart, “Stuart, you shouldn’t skip class today because you have paid tuition
to enroll in the class.” Stuart ignores Jim’s advice, and instead makes the decision of whether to attend
based on the importance to his grade that he feels he’d be missing that day in class relative to his value
of the extra time he could have to finish the video game he is playing. To an economist, Stuart is:
a.
using marginal analysis.
b.
ignoring the total value of attending class.
c.
ignoring the concept of opportunity cost.
d.
irresponsible.
44. Susan wishes to buy gasoline and have her car washed. She finds that if she buys 9 gallons of gasoline
at $1.50 per gallon, the car wash costs $1, but if she buys 10 gallons of gasoline, the car wash is free.
For Susan, the marginal cost of the tenth gallon of gasoline is:
a.
zero.
c.
$1.
b.
50 cents.
d.
$1.50.
45. Ralph wants to buy some milk and a box of cereal. If Ralph buys 2 quarts of milk at $1 per quart, the
box of cereal costs 75 cents. If he buys 3 quarts of milk at $1 per quart, the box of cereal is free. For
Ralph, the marginal cost of the third quart of milk is:
a.
zero.
c.
75 cents.
b.
25 cents.
d.
$1.
46. A local restaurant offers an “all you can eat” Sunday brunch for $12. Susan eats four servings, but
leaves half of a fifth helping uneaten. Why?
a.
Her marginal value of a serving of brunch has fallen below $12.
b.
Her marginal value of a serving has fallen below $2.36 ($12 divided by 5 servings).
c.
Her marginal value of food has fallen to zero.
d.
The total value she places on brunch today exactly equals $12.
47. According to marginal analysis, you should spend more time studying economics if the extra benefit
from an additional hour of study:
a.
is positive.
b.
outweighs the extra cost.
c.
exceeds the benefits of the previous hour of study.
d.
will raise your exam score.
48. The principle that the opportunity cost increases as the production of one output expands along the
production possibilities curve is the:
a.
law of increasing opportunity costs.
b.
law of supply.
c.
law of demand.
d.
law of diminishing returns.
49. If an economy is operating at a point inside the production possibilities curve,
a.
its resources are not being used efficiently.
b.
the curve will begin to shift inward.
c.
the curve will begin to shift outward.
d.
This is a trick question because an economy cannot produce at a point inside the curve.
50. Which of the following most accurately indicates the implications of an economy’s production
possibilities curve?
a.
If all the resources of an economy are being used efficiently, more of one good can be
produced only if less of another good is produced.
b.
If all the resources of an economy are being used efficiently, it is generally possible to
produce more of one good without having to sacrifice the production of other goods.
c.
Over time, it is generally impossible for a country to expand its production of goods.
d.
An economy will automatically move toward a point that lies outside of the production
possibilities constraint unless proper government policy constrains production.
51. Which of the following is true of the production possibilities curve?
a.
It assumes a fixed level of technology.
b.
It assumes resources are fixed.
c.
It assumes resources are fully employed.
d.
All of these are correct.
52. After the terrorist attacks on September 11, 2001, the United States began devoting substantial
resources toward the War on Terrorism, homeland security, and relief efforts. As long as our resources
were being used efficiently, the production possibilities curve would suggest that:
a.
we will have to give up the production of other goods that could have been produced with
these resources.
b.
we will be able to produce the same amount of other goods as before.
c.
the military spending will result in an outward shift in the production possibilities curve
but that the relief effort will result in an offsetting inward shift.
d.
we will be unable to devote the resources necessary toward these efforts unless there is an
improvement in technology.
53. A point outside the production possibilities curve represents a combination of goods that is:
a.
inefficient.
c.
unattainable.
b.
efficient.
d.
attainable.
54. Which of the following will be most likely to cause the production possibilities curve for a country to
shift inward?
a.
an increase in the labor force
b.
an increase in unemployment
c.
development of an improved technological method of production
d.
a decrease in the stock of physical capital
55. In Europe during the 14th century, the Black Plague killed 24 million people or close to 37 percent of
the population. How would this affect the production possibilities curves for the countries of Europe at
that time?
a.
The production possibilities curves for these countries would have shifted outward.
b.
The production possibilities curves for these countries would have shifted inward.
c.
The production possibilities curves for these countries would have been unaffected.
d.
This would have been illustrated by a movement along the production possibilities curves
for these countries, but it would not have shifted them.
56. Which of the following would be least likely to cause the production possibilities curve to shift
outward?
a.
a decreased desire for leisure by workers in the economy.
b.
an invention that requires fewer resources to produce a good.
c.
a shift in consumer preferences that causes expansion in the output of one product and a
decline in output of other products.
d.
an expansion in the man-made productive resources available to the economy as the result
of a high rate of investment.
57. Using a production possibilities curve, a technological advance that increases the amount of output for
the same amount of inputs would be illustrated as a(n):
a.
flattening of the curve.
b.
movement from one point to another point along the curve.
c.
outward shift of the curve.
d.
movement from a point on the curve to a point inside the curve.
58. The production possibilities curve shows that:
a.
some of one good must be given up to get more of another good in an economy that is
operating efficiently.
b.
no output combination is impossible.
c.
an economy that is operating efficiently can have more of one good without giving up
some of another good.
d.
scarcity can be eliminated.
59. Any point on the production possibilities curve illustrates:
a.
minimum production combinations.
b.
maximum production combinations.
c.
economic growth.
d.
a nonfeasible production combination.
60. Production possibilities curve analysis includes the idea of:
a.
opportunity cost.
c.
maximum production choices.
b.
scarcity.
d.
all of these.
61. An efficient economy:
a.
uses available resources fully.
b.
uses the best division of labor.
c.
produces an output combination at some point along the production possibility curve.
d.
all of these.
62. A production possibility graph slopes down because of:
a.
the law of increasing costs.
b.
nonhomogeneous resources.
c.
inefficiency.
d.
improper output mix.
e.
unemployment.
63. The production possibility curve is bowed outward from the origin because of:
a.
the law of increasing opportunity costs.
b.
the finite nature of the resource base.
c.
inefficiency.
d.
improper output mix.
e.
unemployment.
64. The production possibilities curve demonstrates the basic economic principle that:
a.
market-based economies are more efficient.
b.
supply will determine demand in the economy.
c.
the production of more capital goods this year will cause the economy to produce less
consumption goods next year.
d.
to produce more of any one thing, assuming full employment, the economy must produce
less of something else.
e.
to produce more consumption goods this year requires the production of more capital
goods this year.
65. A production possibilities curve shows the various:
a.
prices that can be charged for capital and consumption goods.
b.
combinations of prices and outputs that can be produced.
c.
combinations of goods the economy has the capacity to produce.
d.
combinations of resources and prices that the economy can produce.
66. A production possibilities curve has “good X” on the horizontal axis and “good Y” on the vertical axis.
On this diagram, the opportunity cost of good X, in terms of good Y, is represented by the:
a.
distance to the curve from the horizontal axis.
b.
distance to the curve from the vertical axis.
c.
distance from the origin to the curve.
d.
change in Y for each change in X along the curve.
67. Of factors which affect any economy’s production potential, the best two listed below are:
a.
resources and technology.
b.
prices and outputs.
c.
wages and prices.
d.
taxes and prices.
e.
resources and prices.
68. The various combinations of goods and services that can be produced, when an economy uses its
available resources and technology efficiently, is called:
a.
scarcity.
b.
opportunity cost.
c.
unlimited production.
d.
capital accumulation.
e.
production possibilities.
69. A production possibilities curve shows the:
a.
dollar costs of producing two different goods.
b.
amounts of labor and capital needed to produce one good.
c.
various combinations of goods that can be produced.
d.
prices of different goods that are produced in an economy.
e.
inefficient use of available resources and technology.
70. What shape is the production possibilities curve usually expected to exhibit?
a.
Upward-sloping.
b.
Bowed out.
c.
Bowed in.
d.
Straight line.
e.
U-shaped.
71. When the production possibilities curve is bowed out, resources are:
a.
equally well-suited to production of both goods.
b.
not being used efficiently.
c.
not equally suited to the production of both types of goods.
d.
increasing as more of one good is produced.
e.
of an inferior quality.
72. When an economy’s resources are not fully employed, then it must be true that the:
a.
production point is located outside and to the right of the production possibilities curve.
b.
production point is located along the production possibilities curve.
c.
production point is located inside and to the left of the production possibilities curve.
d.
production possibilities curve shifts to the right.
e.
production possibilities curve shifts to the left.
73. The production possibilities curve shows different combinations of goods that:
a.
can be consumed by households.
b.
can be consumed by firms.
c.
can be produced with the available technology.
d.
are produced and consumed by firms.
e.
are bought and sold in the market.
74. The production possibilities curve illustrates all of the following concepts except:
a.
the law of increasing costs.
b.
unlimited wants.
c.
scarcity.
d.
opportunity cost.
e.
availability of resources.
75. The production possibilities curve depicts the various combinations of two goods that can be:
a.
interchanged among two countries.
b.
produced with a given technology.
c.
consumed with a given quantity of resources.
d.
produced with increments in resources and changes in technology.
e.
consumed as the resources increase.
76. Efficient production means producing:
a.
less than feasible output for a given amount of resources.
b.
more than feasible output for a given amount of resources.
c.
the maximum feasible output for a given amount of resources.
d.
no more than what is needed.
e.
in excess of what is needed.
77. The law of increasing costs holds that the opportunity cost:
a.
of a good decreases as the quantity of the good produced increases.
b.
of a good is proportional to the resources used in its production.
c.
of a good increases as more of the good is produced.
d.
of a good does not change with the resources used its production.
e.
changes as more of the good is produced.
78. If an economy is producing at full employment, it means that:
a.
there are idle resources in this economy.
b.
the production is not efficient.
c.
the economy is producing along its production possibilities curve.
d.
the economy is producing at a point that is to the left of the production possibilities curve.
e.
the economy is producing at a point that is to the right of the production possibilities
curve.
79. Which of the following is not true about a production possibilities curve? The curve:
a.
indicates the combinations of goods and services that can be produced with given
technology.
b.
indicates the efficient production points.
c.
indicates the non-efficient production points.
d.
indicates the feasible (attainable) and non-feasible production points.
e.
indicates which production point will be chosen.
80. Which of the following is true about the production possibilities curve when a technological progress
occurs? The curve:
a.
shifts inwards to the left.
b.
becomes flatter at one end and steeper at the other end.
c.
becomes steeper.
d.
shifts outward to the right.
e.
does not change.
81. A point inside a production possibilities curve reflects:
a.
the law of increasing costs.
b.
technological innovation.
c.
less than full use of resources and technology.
d.
economic efficiency.
e.
a way to increase future economic growth.
82. A point outside a production possibilities curve reflects:
a.
efficiency.
b.
specialization.
c.
inefficiency.
d.
unemployment.
e.
an impossible choice.
83. Any point inside the production possibility curve is:
a.
efficient.
c.
inefficient.
b.
nonfeasible.
d.
optimal.
84. Using a production possibilities curve, an economy that produces an output combination less than the
maximum possible is depicted by a point located:
a.
at the top corner of the curve.
b.
near the middle of the curve.
c.
at the bottom corner of the curve.
d.
outside the curve.
e.
inside the curve.
85. One of the assumptions underlying the production possibilities curve for any given economy is that:
a.
the state of technology changes.
b.
there is an unlimited supply of resources.
c.
there is full employment of resources when the economy is on the curve.
d.
goods can be produced outside the curve.
86. Which of the following would be most likely to cause the production possibilities curve for computers
and education to shift outward?
a.
A choice of more computers and less education.
b.
A choice of more education and less computers.
c.
A reduction in the labor force.
d.
An increase in the quantity of resources.
87. Given a production possibilities curve, a point:
a.
inside the curve represents unemployment.
b.
on the curve represents full employment.
c.
outside the curve is currently unattainable.
d.
all of these.
88. All points on the production possibilities curve are:
a.
unattainable.
c.
efficient.
b.
fair.
d.
optimal.
89. As production of a good increases, opportunity costs rise because:
a.
there will be more inefficiency.
b.
people always prefer having more goods.
c.
of inflationary pressures.
d.
workers are not equally suited to all tasks.
90. If society leaves some of its resources unemployed, then it will be operating at a point:
a.
beneath its production possibilities curve.
b.
at a corner of its production possibilities curve.
c.
anywhere along its production possibilities curve.
d.
outside of its production possibilities curve.
91. The law of increasing opportunity costs causes the production possibilities curve to:
a.
be a straight line.
c.
have a bowed-out shape.
b.
slope upwards.
d.
shift inward.
92. Along a production possibilities curve showing capital and consumption goods production, which of
the following pairs are being held fixed?
a.
Unemployment and capital goods production.
b.
Number of resources and consumption goods production.
c.
Composition of the economy’s output and number of resources.
d.
Capital and consumption goods production.
e.
Technology and number of resources.
Exhibit 2-3 Production possibilities curve data
A
B
C
D
E
Capital goods
0
1
2
3
4
Consumer goods
20
18
14
8
0
93. According to the data given in Exhibit 2-3, the production of 1 unit of capital goods and 14 units of
consumer goods:
a.
is possible but would be inefficient.
b.
may be a result of unemployment.
c.
may be a result of unused natural resources.
d.
all of these.
Exhibit 2-4 Production possibilities curve data
A
B
C
D
E
Capital goods
0
10
20
30
40
Consumer goods
200
180
140
80
0
94. According to the data given in Exhibit 2-4, the production of 140 units of consumer goods and 10 units
of capital goods:
a.
is possible but would be inefficient.
b.
may be a result of unemployment.
c.
may be a result of unused natural resources.
d.
all of the above.
e.
none of the above.
95. According to the data in Exhibit 2-4, a total output of 140 units of consumer goods and 10 units of
capital goods would:
a.
be unobtainable in this economy.
b.
be an efficient way of using the economy’s scarce resources.
c.
result in the maximum use of the economy’s labor force.
d.
result in a less than maximum rate of growth for this economy.
Exhibit 2-5 Production possibilities curve
96. In Exhibit 2-5, movement between which of the following points represents an increase in economic
efficiency?
a.
A to C.
b.
C to D.
c.
D to B.
d.
A to B.
e.
A to D.