
Name:
Class:
Date:
chapter 2
Indicate whether the statement is true or false.
1. There are four quartiles that divide the values in a data set into four equal parts.
a.
True
b.
False
2. A histogram is based on binning the variable, which means putting the variable into discrete categories.
a.
True
b.
False
3. The median is one of the most frequently used measures of variability.
a.
True
b.
False
4. The mean is a measure of central tendency.
a.
True
b.
False
5. A population includes all elements or objects of interest in a study, whereas a sample is a subset of the population used
to gain insights into the characteristics of the population.
a.
True
b.
False
6. Mean absolute deviation (MAD) is the average of the squared deviations.
a.
True
b.
False
7. A distribution of a numerical variable with no skewness is said to be symmetric.
a.
True
b.
False
8. Data can be categorized as cross-sectional or time series.
a.
True
b.
False
9. The count of categories is the only meaningful way to summarize categorical data.
a.
True
b.
False
10. A variable (or field or attribute) is a characteristic of members of a population, whereas an observation (or case or
record) is a list of all variable values for a single member of a population.
a.
True
b.
False
11. Because they represent such extreme values, outliers should be eliminated from statistical analyses.
a.
True
b.
False

Name:
Class:
Date:
chapter 2
12. Categorical variables can be classified as either discrete or continuous.
a.
True
b.
False
13. The core purpose of time series graphs is to detect historical patterns in the data.
a.
True
b.
False
14. The number of car insurance policy holders is an example of a discrete numerical variable.
a.
True
b.
False
15. All nominal data may be treated as ordinal data.
a.
True
b.
False
16. A frequency table indicates how many observations fall within each category, and a histogram is its graphical analog.
a.
True
b.
False
17. The value of the mean times the number of observations equals the sum of all of the data values.
a.
True
b.
False
18. Unlike histograms, box plots depict only one aspect of a variable.
a.
True
b.
False
19. Assume that the histogram of a data set is symmetric and bell shaped, with a mean of 75 and standard deviation of 10.
Then, approximately 95% of the data values were between 55 and 95.
a.
True
b.
False
20. As a graphical tool, the histogram is ideal for showing whether the distribution of a numerical variable is symmetric or
skewed.
a.
True
b.
False
21. Both ordinal and nominal variables are categorical.
a.
True
b.
False
22. The difference between the largest and smallest values in a data set is called the range.
a.
True
b.
False

Name:
Class:
Date:
chapter 2
23. Abby has been keeping track of what she spends to rent movies. The last seven week’s expenditures, in dollars, were
6, 4, 8, 9, 6, 12, and 4. The mean amount Abby spends on renting movies is $7.
a.
True
b.
False
24. Suppose that a sample of 8 observations has a standard deviation of 2.50, then the sum of the squared deviations from
the sample mean is 17.50.
a.
True
b.
False
25. In an extremely right-skewed distribution, the mean is much smaller than the median.
a.
True
b.
False
26. Phone numbers, Social Security numbers, and zip codes are examples of numerical variables.
a.
True
b.
False
27. Using dummy variables is an efficient way of determining counts of categorical variables.
a.
True
b.
False
28. Cross-sectional data are data on a population at a distinct point in time, whereas time series data are data collected
over time.
a.
True
b.
False
29. In the term “frequency table,” frequency refers to the counts of observations in specified categories.
a.
True
b.
False
30. Time series graphs chart the values of one or more time series, using time on the vertical axis.
a.
True
b.
False
31. A data set is typically a rectangular array of data, with observations in columns and variables in rows.
a.
True
b.
False
32. Suppose that a sample of 10 observations has a standard deviation of 3, then the sum of the squared deviations from
the sample mean is 30.
a.
True
b.
False
33. Age, height, and weight are examples of numerical data.
a.
True
b.
False

Name:
Class:
Date:
chapter 2
34. A distribution with a high kurtosis has almost all of its observations within three standard deviations of the mean.
a.
True
b.
False
35. The median of a data set with 30 values would be the average of the 15th and the 16th values when the data values are
arranged in ascending order.
a.
True
b.
False
Indicate the answer choice that best completes the statement or answers the question.
36. A sample of 20 observations has a standard deviation of 4. The sum of the squared deviations from the sample mean is
a.
400
b.
320
c.
304
d.
288
e.
180
37. What is the most common type of chart for showing the distribution of a numerical variable?
a.
time series graph
b.
histogram
c.
bin
d.
box plot
38. Where will you find “time” on a time series graph?
a.
horizontal axis
b.
first column
c.
vertical axis
d.
last column
39. The difference between the first and third quartile is called the
a.
interquartile range
b.
interdependent range
c.
unimodal range
d.
bimodal range
e.
mid range
40. A histogram that is positively skewed is also called
a.
skewed to the right
b.
skewed to the left
c.
balanced
d.
symmetric
41. The average score for a class of 30 students was 75. The 20 male students in the class averaged 70. The 10 female
students in the class averaged
a.
75
b.
85
c.
60

Name:
Class:
Date:
chapter 2
d.
70
e.
80
42. The interquartile range (IQR) represents what percent of the observations?
a.
lower 25%
b.
middle 50%
c.
upper 75%
d.
upper 90%
e.
100%
43. What measure of distribution relates to extreme events, such as a stock market crash?
a.
asymmetric
b.
kurtosis
c.
negatively skewed
d.
skewness
44. In a generic box plot, the vertical line inside the box indicates the location of the
a.
mean
b.
median
c.
mode
d.
minimum value
e.
maximum value
45. If a value represents the 95th percentile, this means that
a.
95% of all values are below this value
b.
95% of all values are above this value
c.
95% of the time you will observe this value
d.
there is a 5% chance that this value is incorrect
e.
there is a 95% chance that this value is correct
46. The median can also be described as the
a.
middle observation when the data values are arranged in ascending order
b.
population mean
c.
second percentile
d.
the average of all values
47. A variable is classified as ordinal if
a.
there is a natural ordering of categories
b.
there is no natural ordering of categories
c.
the data arise from continuous measurements
d.
we track the variable through a period of time
48. If the mean is 75 and two observations have values of 65 and 85, what is the squared deviation of each?
a.
100
b.
20
c.
400

Name:
Class:
Date:
chapter 2
d.
10
49. Coding males as 1 and females as 0 in a data set illustrates the use of
a.
nominal variables
b.
dummy variables
c.
numerical variables
d.
ordinal variables
50. In order for the characteristics of a sample to be generalized to the entire population, it should be:
a.
symbolic of the population
b.
atypical of the population
c.
representative of the population
d.
illustrative of the population
51. Categorizing age variables as “young,” “middle-aged,” and “elderly” is an example of
a.
counting
b.
ordering
c.
value adding
d.
binning
e.
categorizing
52. How is the median defined if the number of observations is even?
a.
the average of the two middle observations
b.
the difference between the two middle observations
c.
the most frequent observation
d.
the difference between the highest and smallest observation
53. The mode is best described as the
a.
middle observation
b.
same as the average
c.
50th percentile
d.
most frequently occurring value
e.
third quartile
54. The length of the box in the box plot portrays the
a.
mean
b.
median
c.
range
d.
interquartile range
e.
third quartile
55. Data that arise from counts are called
a.
continuous data
b.
nominal data
c.
counted data
d.
discrete data
56. Gender and State are examples of which type of data?
a.
Discrete data
b.
Continuous data
c.
Categorical data
d.
Ordinal data

Name:
Class:
Date:
chapter 2
57. In a generic box plot, the x inside the box indicates the location of the
a.
mean
b.
median
c.
minimum value
d.
maximum value
58. A sample of a population taken at one particular point in time is categorized as:
a.
categorical
b.
discrete
c.
cross-sectional
d.
time-series
59. As a measure of variability, what is defined as the maximum value minus the minimum value?
a.
variance
b.
standard deviation
c.
mean
d.
range
e.
median
60. Which of the following statements is true for the following data values: 7, 5, 6, 4, 7, 8, and 12?
a.
The mean, median and mode are all equal
b.
Only the mean and median are equal
c.
Only the mean and mode are equal
d.
Only the median and mode are equal
61. Which of the following are the three most common measures of central tendency?
a.
Mean, median, and mode
b.
Mean, variance, and standard deviation
c.
Mean, median, and variance
d.
Mean, median, and standard deviation
e.
First quartile, second quartile, and third quartile
62. With symmetric, “bell-shaped” distributions, approximately what percent of the observations are within two standard
deviations of the mean?
a.
50%
b.
68%
c.
95%
d.
99.7%
e.
100%
63. Researchers may gain insight into the characteristics of a population by examining a
a.
mathematical model describing the population
b.
sample of the population
c.
description of the population
d.
replica
64. Excel stores dates as
a.
numbers
b.
variables
c.
records
d.
text

Name:
Class:
Date:
chapter 2
65. Expressed in percentiles, the interquartile range is the difference between the
a.
10th and 60th percentiles
b.
15th and 65th percentiles
c.
20th and 70th percentiles
d.
25th and 75th percentiles
e.
35th and 85th percentiles
66. The daily closing values of the Dow Jones Industrial Average are examples of
a.
cross-sectional data
b.
discrete data
c.
time-series data
d.
continuous data
Below you will find summary measures on starting salaries for classroom teachers across the United States. You will also
find a list of selected states and their average starting teacher salary. All values are in thousands of dollars.
Starting salaries for classroom teachers across the United States
Salary
Count
51.000
Mean
35.890
Median
35.000
Standard deviation
6.226
Minimum
26.300
Maximum
50.300
Variance
38.763
First quartile
31.550
Third quartile
40.050
Selected states and their average starting teacher salary
State
Salary
Alabama
31.3
Colorado
35.4
Connecticut
50.3
Delaware
40.5
Nebraska
31.5
Nevada
36.2
New Hampshire
35.8
New Jersey
47.9
New Mexico
29.6
South Carolina
31.6
South Dakota
26.3
Tennessee
33.1
Texas
32.0
Utah
30.6
Vermont
36.3
Virginia
35.0
Wyoming
31.6
Name:
Class:
Date:
chapter 2
67. Which of the states listed paid their teachers average salaries that are below 75% of all average salaries?
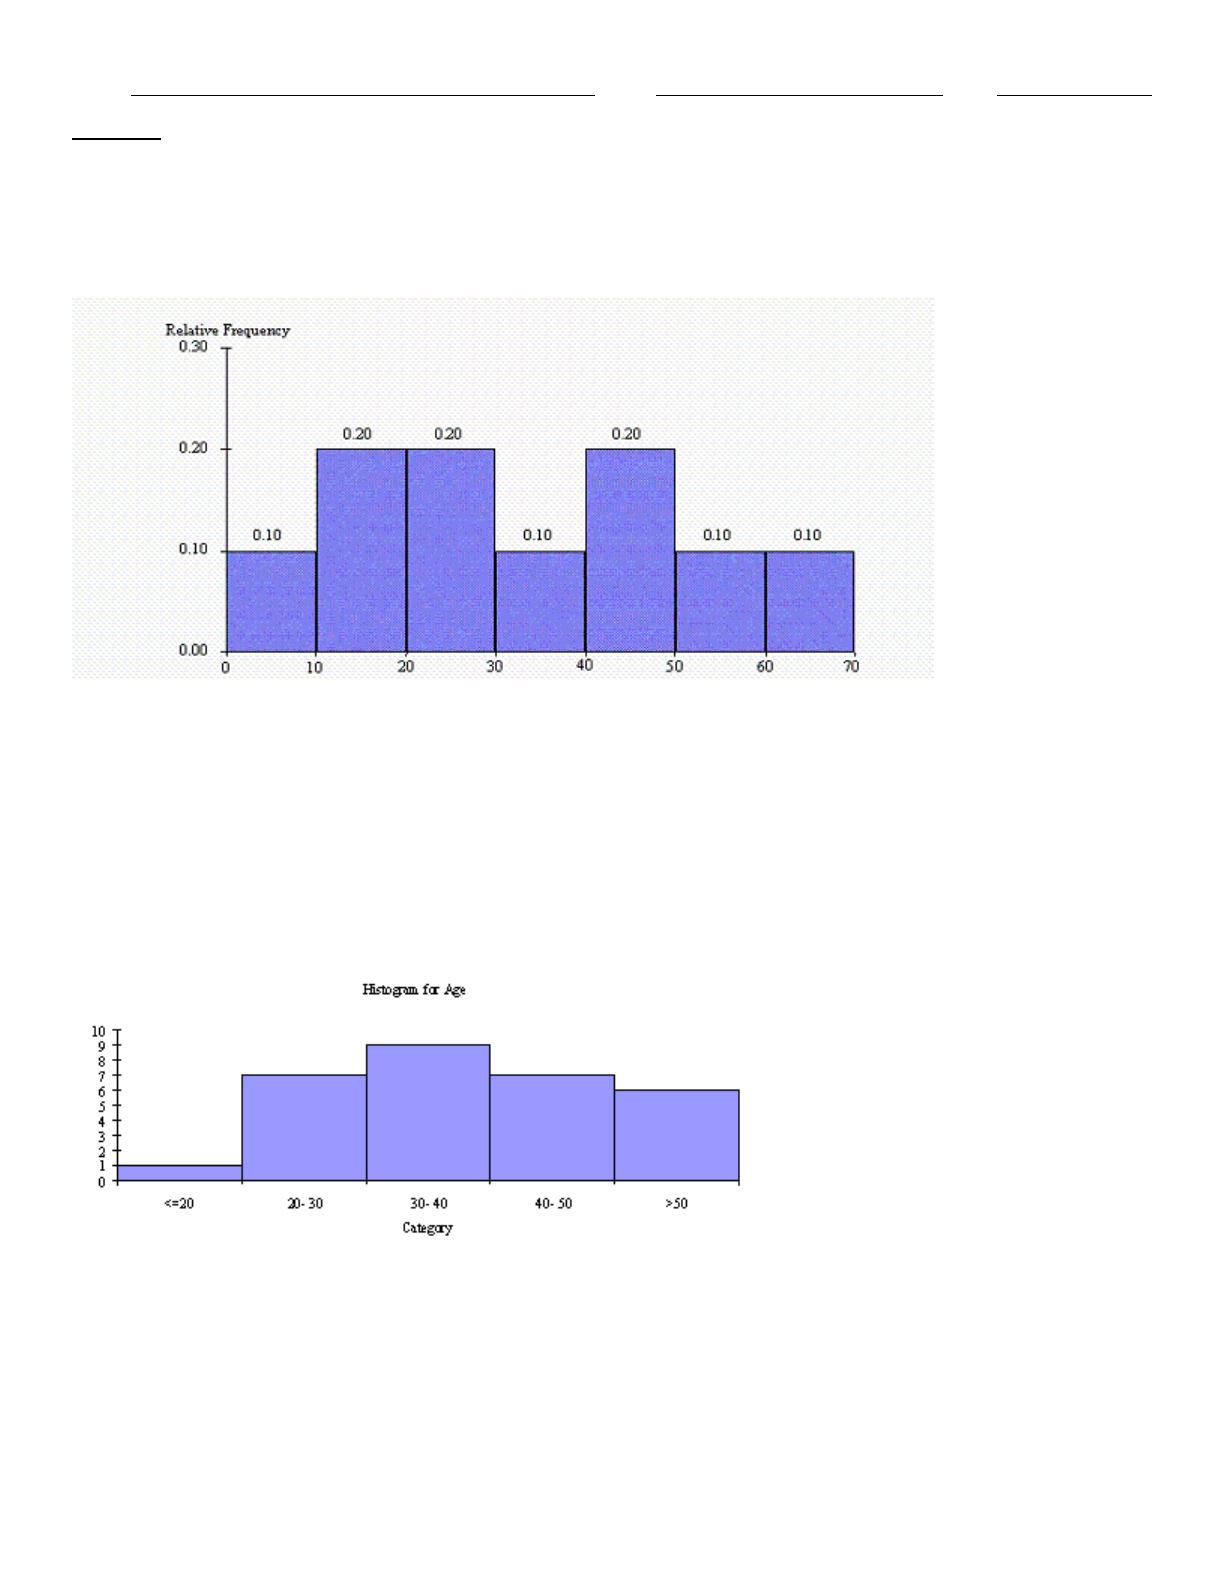
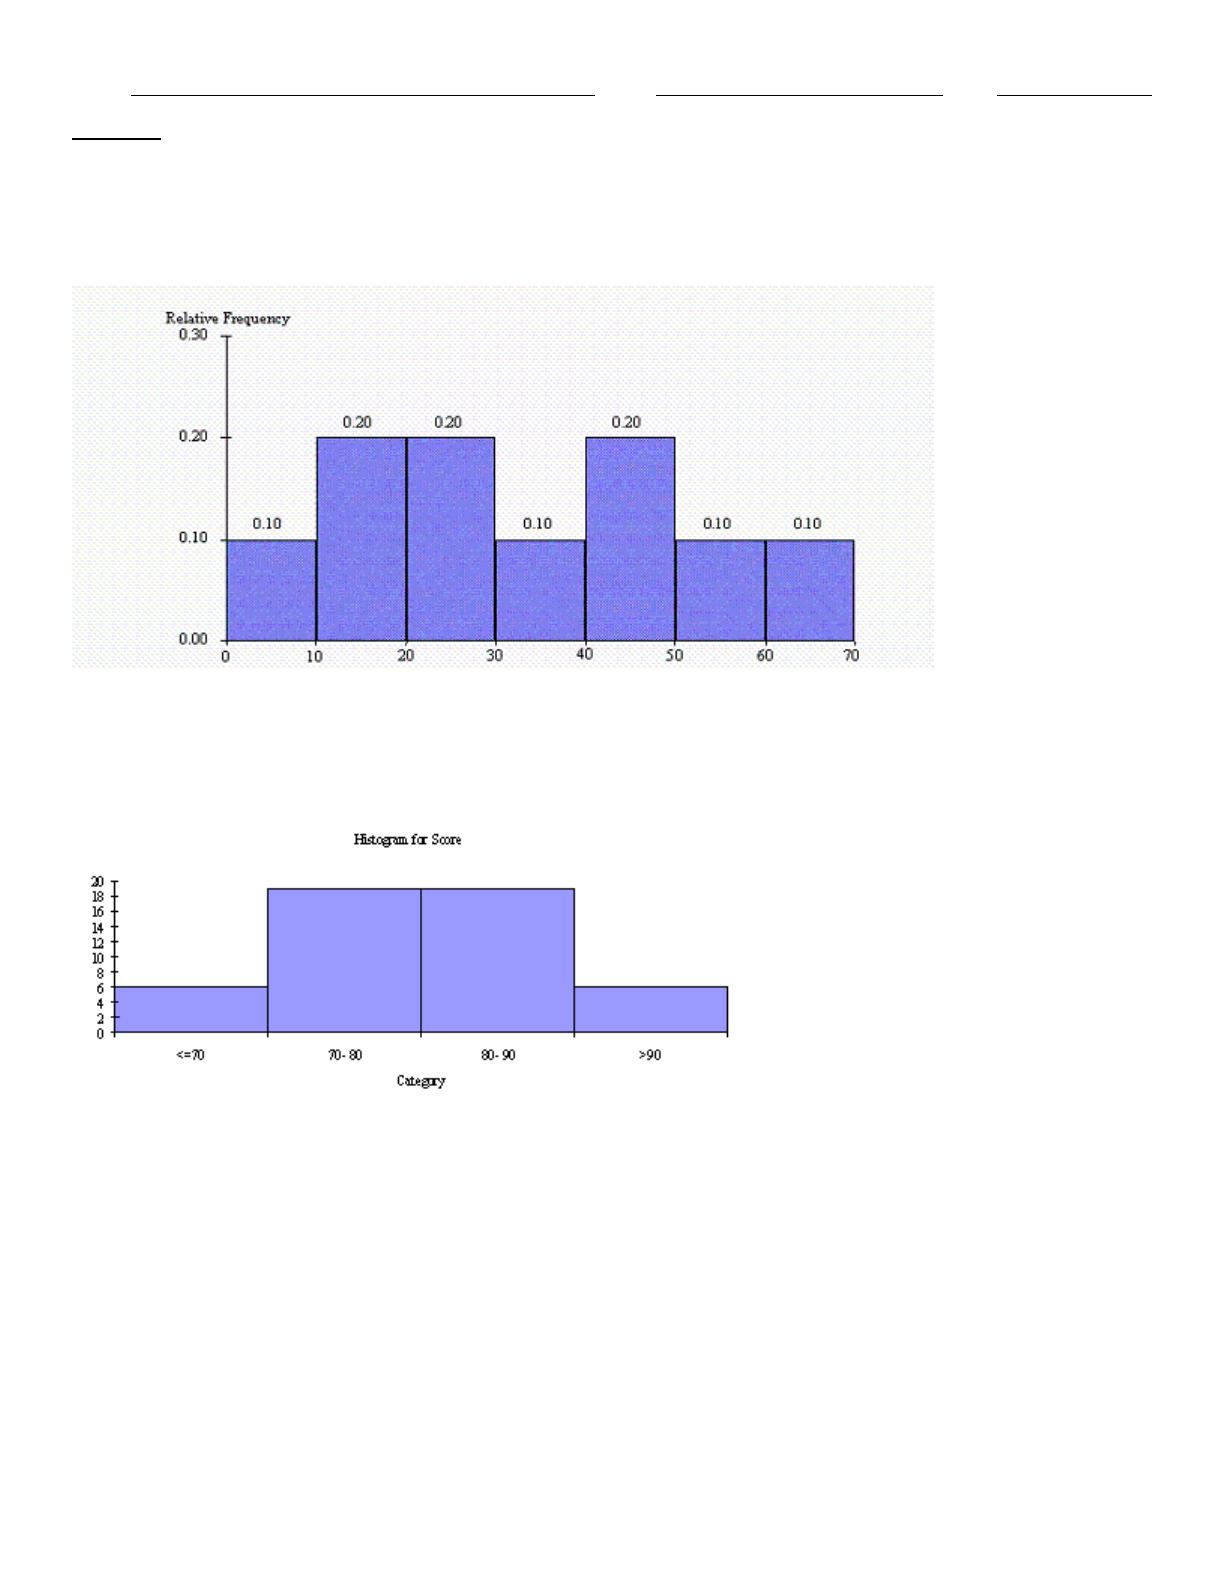
The histogram below represents scores achieved by 250 job applicants on a personality profile.
68. Seventy percent of the job applicants scored above what value?
69. Half of the job applicants scored below what value?
A financial analyst collected useful information for 30 employees at Gamma Technologies, Inc. These data include each
selected employees’ gender, age, number of years of relevant work experience prior to employment at Gamma, number of
years of employment at Gamma, number of years of post-secondary education, and annual salary.
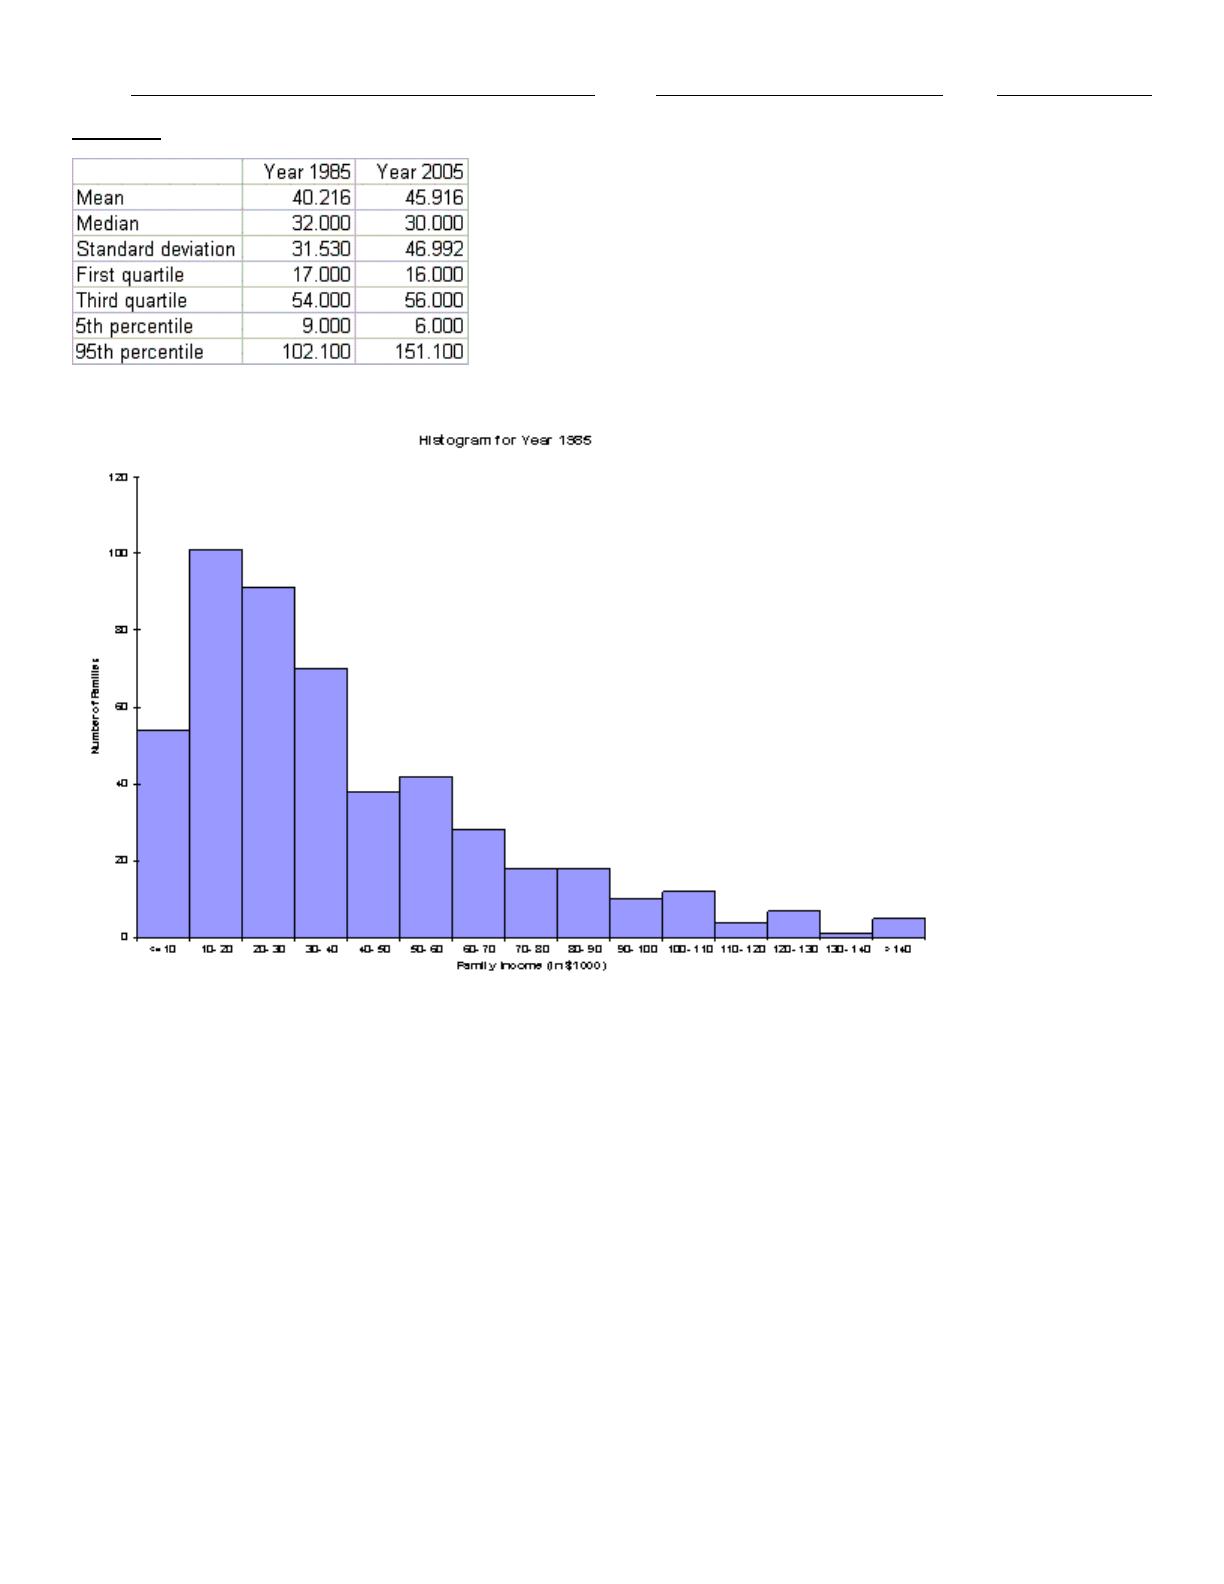
70. Based on the histogram shown below, how would you describe the age distribution for these data?
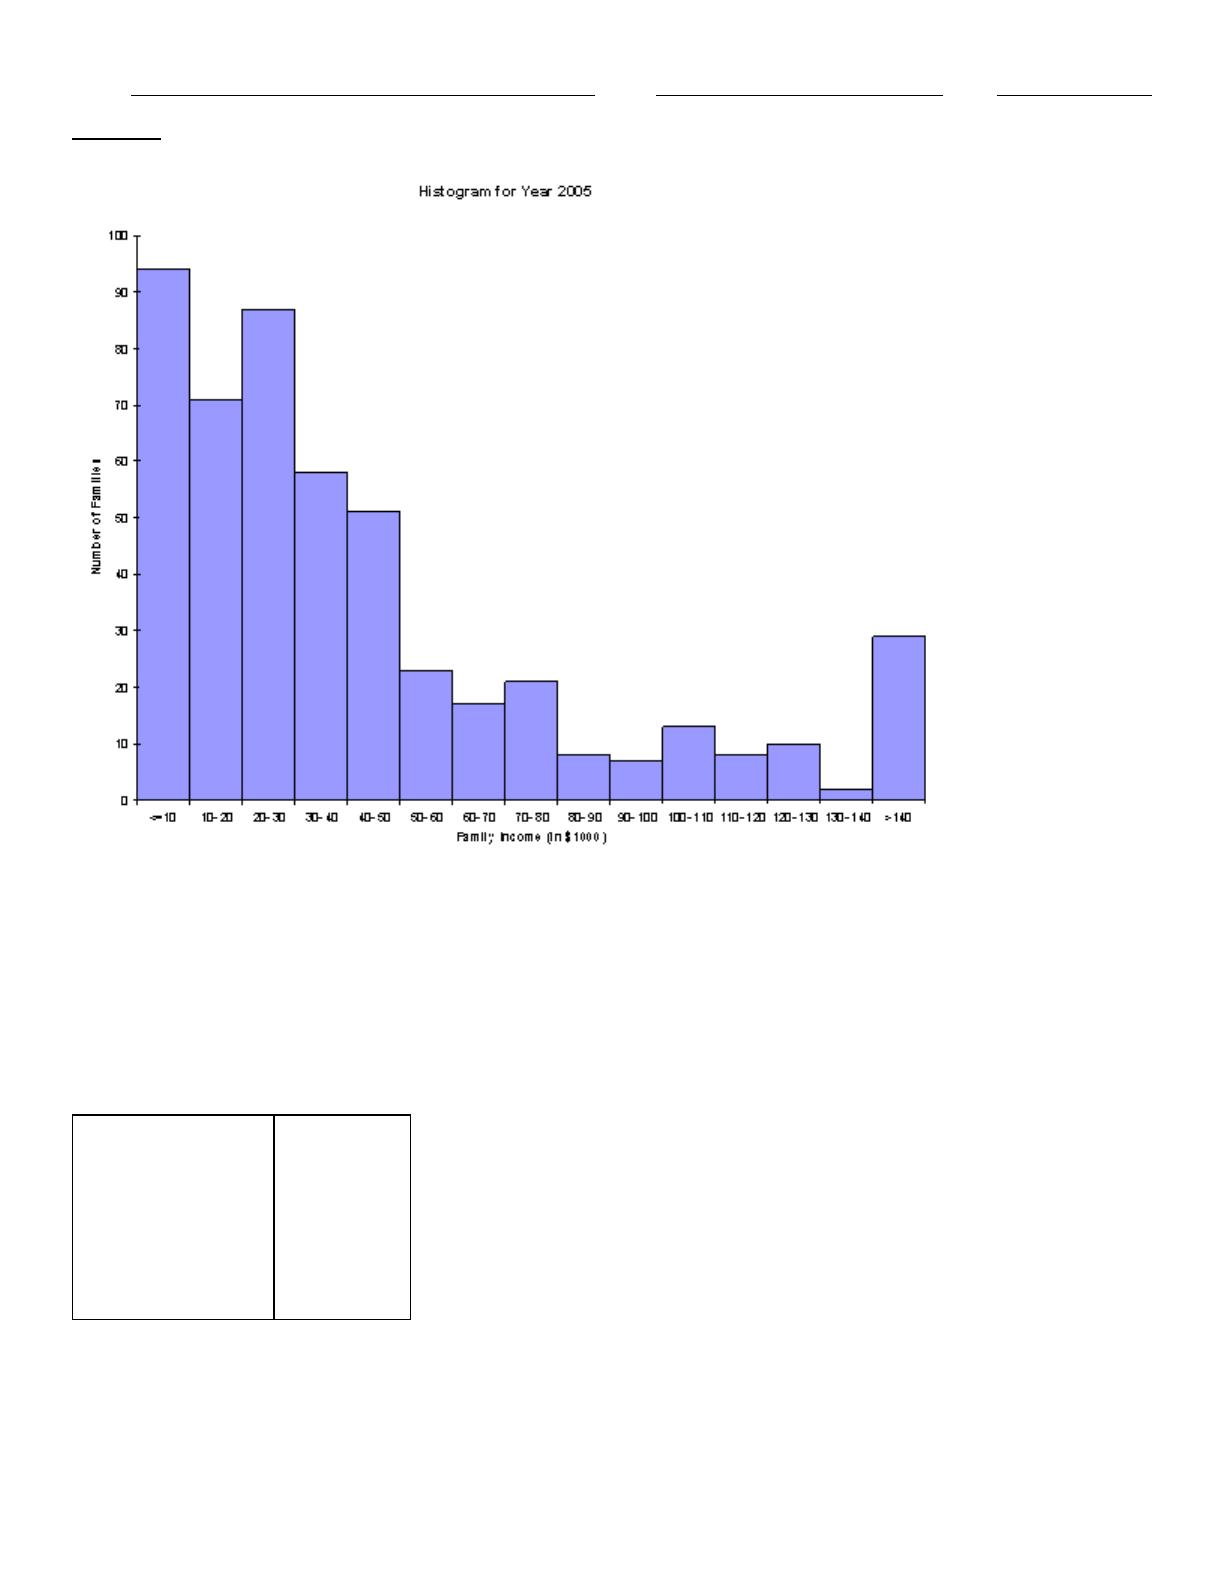
71. A question of great interest to economists is how the distribution of family income has changed in the United States
during the last 20 years. The summary measures and histograms shown below are generated for a sample of 500 family
incomes, using the 1985 and 2005 income for each family in the sample.
Summary Measures:
Name:
Class:
Date:
chapter 2
Name:
Class:
Date:
chapter 2
Based on these results, discuss as completely as possible how the distribution of family income in the United States
changed from 1985 to 2005.
In an effort to provide more consistent customer service, the manager of a local fast-food restaurant would like to know
the dispersion of customer service times in relation to their average value for the facility’s drive-up window. The table
below provides summary measures for the customer service times (in minutes) for a sample of 50 customers collected
over the past week.
Count
50.000
Mean
0.873
Median
0.885
Standard deviation
0.432
Minimum
0.077
Maximum
1.608
Variance
0.187
Skewness
-0.003
72. Explain why the mean is slightly lower than the median in this case.
Name:
Class:
Date:
chapter 2
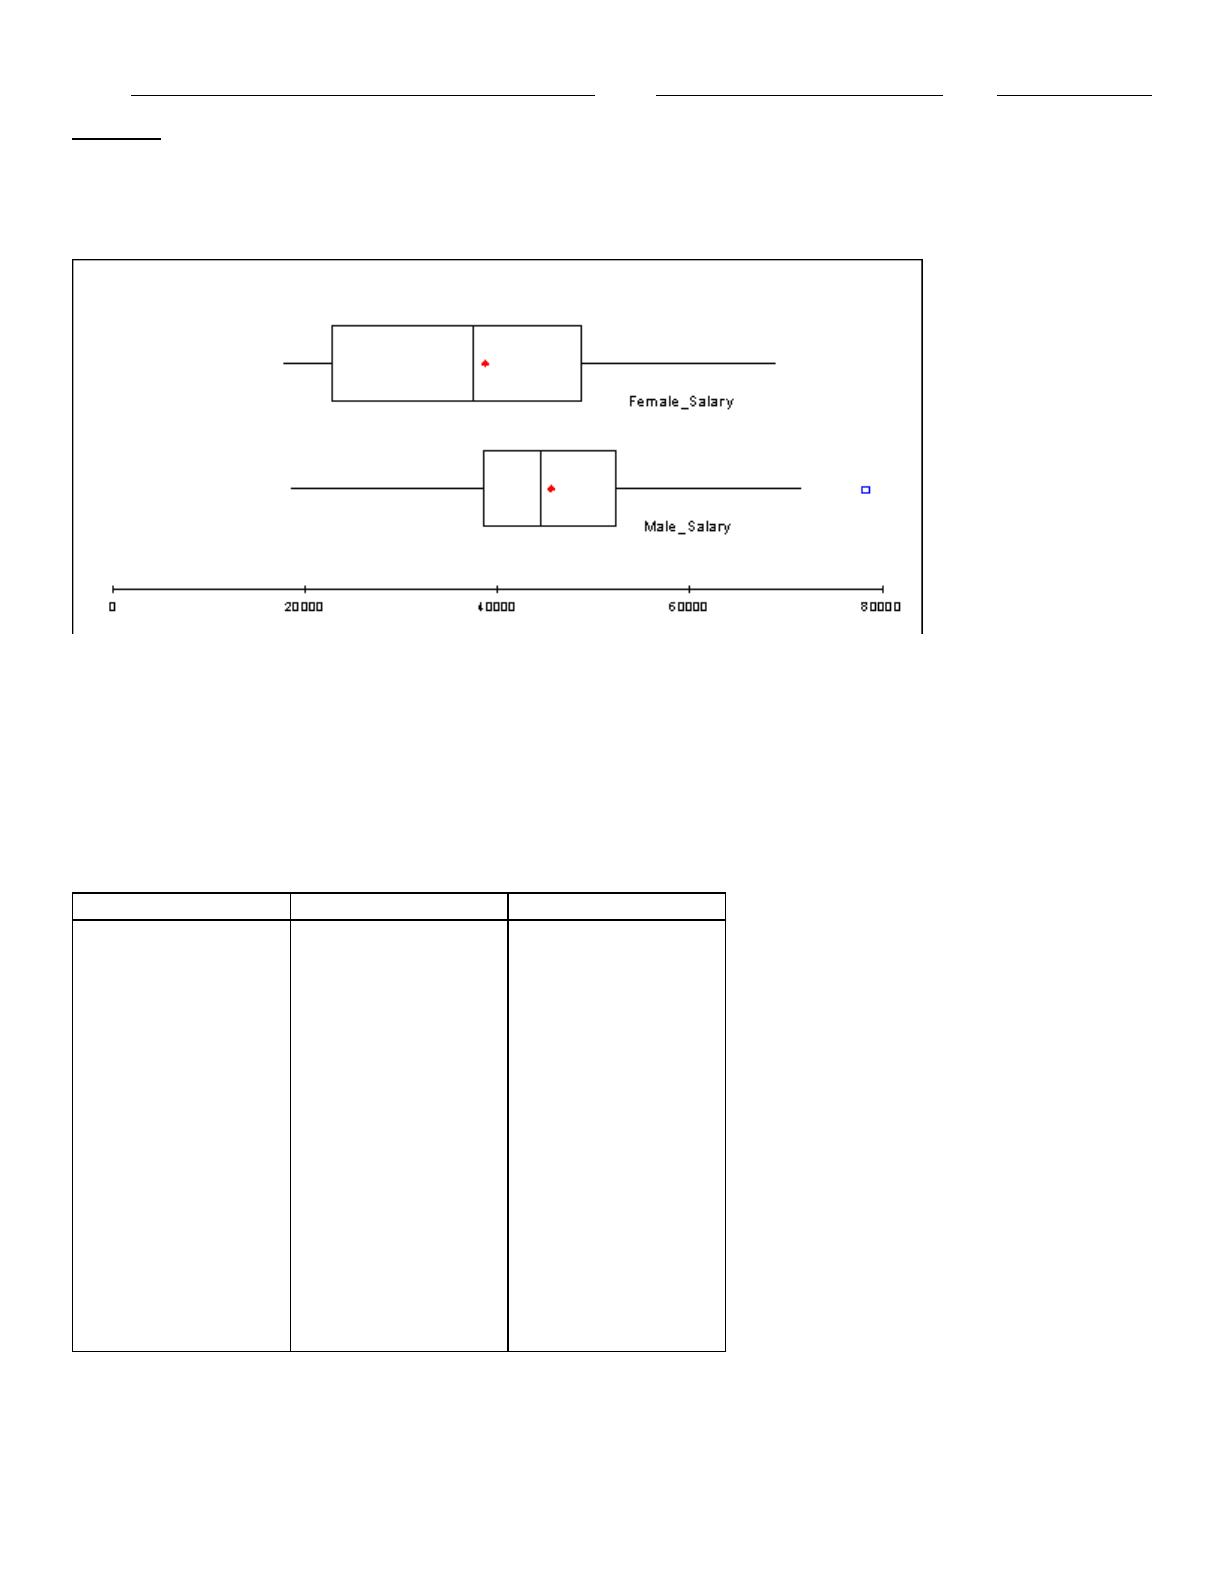
A manager for Marko Manufacturing, Inc. has recently been hearing some complaints that women are being paid less than
men for the same type of work in one of their manufacturing plants. The box plots shown below represent the annual
salaries for all salaried workers in that facility (40 men and 34 women).
73. What can you say about the shape of the distributions given the accompanying box plots?
74. Would you conclude that there is a difference between the salaries of women and men in this plant? Justify your
answer.
The data shown below contains family incomes (in thousands of dollars) for a set of 50 families sampled in 2000 and
2010. Assume that these families are good representatives of the entire United States.
2000
2010
2000
2010
2000
2010
58
54
33
29
73
69
6
2
14
10
26
22
59
55
48
44
64
70
71
57
20
16
59
55
30
26
24
20
11
7
38
34
82
78
70
66
36
32
95
97
31
27
33
29
12
8
92
88
72
68
93
89
115
111
100
96
100
102
62
58
1
0
51
47
23
19
27
23
22
18
34
30
22
47
50
75
36
61
141
166
124
149
125
150
72
97
113
138
121
146
165
190
118
143
88
113
79
104
96
121
75. Generate a box plot to summarize the data. What does the box plot indicate?
Name:
Class:
Date:
chapter 2
76. A political figure running for re–election claimed that the country was better off in 2010 than in 2000, because the
average income increased. Do you agree?
The histogram below represents scores achieved by 250 job applicants on a personality profile.
77. How many job applicants scored between 10 and 30?
78. An operations management professor is interested in how her students performed on her midterm exam. The
histogram shown below represents the distribution of exam scores (where the maximum score is 100) for 50 students.
Based on this histogram, how would you characterize the students’ performance on this exam?
Statistics professor has just given a final examination in his statistical inference course. He is particularly interested in
learning how his class of 40 students performed on this exam. The scores are shown below.
77
81
74
77
79
73
80
85
86
73
83
84
81
73
75
91
76
77
95
76
90
85
92
84
81
64
75
90
78
78
82
78
86
86
82
70
76
78
72
93
79. Explain why the mean and median are different.
The data shown below contains family incomes (in thousands of dollars) for a set of 50 families sampled in 2000 and

Name:
Class:
Date:
chapter 2
2010. Assume that these families are good representatives of the entire United States.
2000
2010
2000
2010
2000
2010
58
54
33
29
73
69
6
2
14
10
26
22
59
55
48
44
64
70
71
57
20
16
59
55
30
26
24
20
11
7
38
34
82
78
70
66
36
32
95
97
31
27
33
29
12
8
92
88
72
68
93
89
115
111
100
96
100
102
62
58
1
0
51
47
23
19
27
23
22
18
34
30
22
47
50
75
36
61
141
166
124
149
125
150
72
97
113
138
121
146
165
190
118
143
88
113
79
104
96
121
80. Find the mean, median, standard deviation, first and third quartiles, and the 95th percentile for family incomes in both
years.
Statistics professor has just given a final examination in his statistical inference course. He is particularly interested in
learning how his class of 40 students performed on this exam. The scores are shown below.
77
81
74
77
79
73
80
85
86
73
83
84
81
73
75
91
76
77
95
76
90
85
92
84
81
64
75
90
78
78
82
78
86
86
82
70
76
78
72
93
81. What are the mean and median scores on this exam?
A financial analyst collected useful information for 30 employees at Gamma Technologies, Inc. These data include each
selected employees’ gender, age, number of years of relevant work experience prior to employment at Gamma, number of
years of employment at Gamma, number of years of post-secondary education, and annual salary.
82. Indicate the type of data for each of the six variables included in this set.
The following data represent the number of children in a sample of 10 families from Chicago: 4, 2, 1, 1, 5, 3, 0, 1, 0, and
2.
83. Compute the mean number of children.
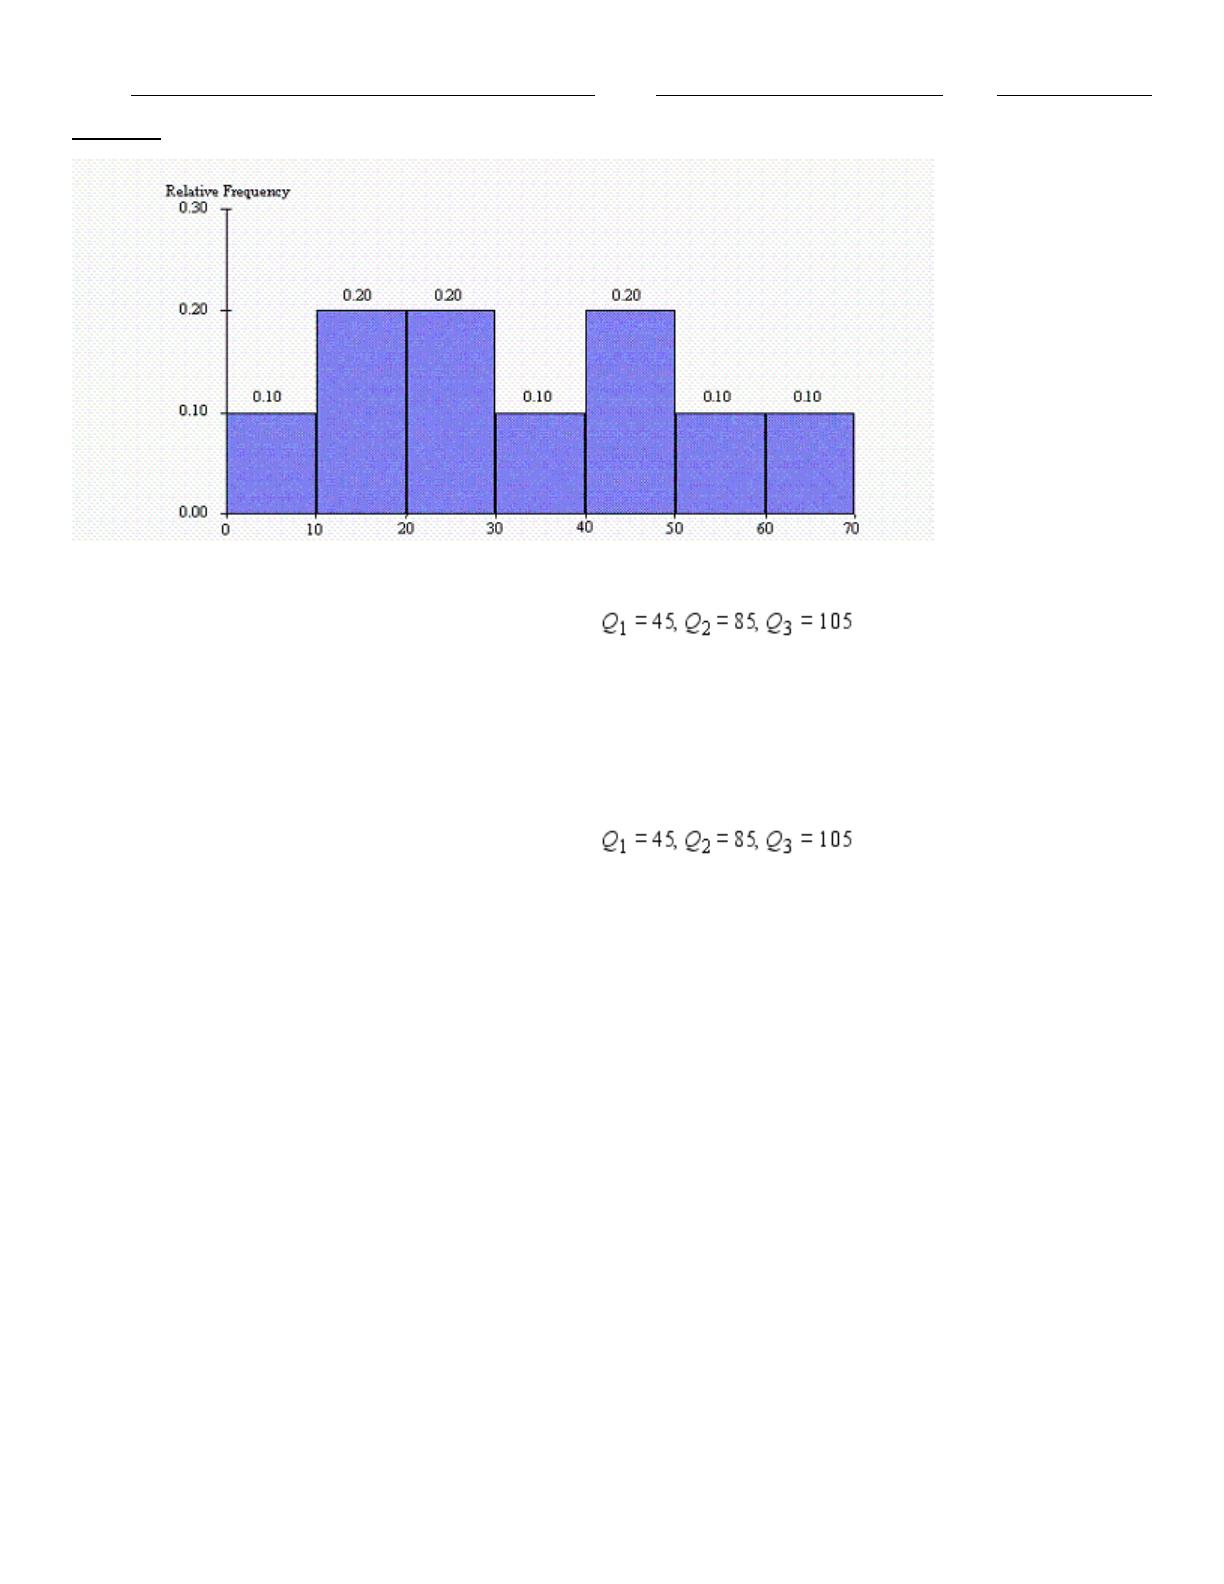
The histogram below represents scores achieved by 250 job applicants on a personality profile.
Name:
Class:
Date:
chapter 2
84. How many job applicants scored above 50?
Suppose that an analysis of a set of test scores reveals that:
85. Calculate the interquartile range. What does this tell you about the data?
The following data represent the number of children in a sample of 10 families from Chicago: 4, 2, 1, 1, 5, 3, 0, 1, 0, and
2.
86. Is the distribution of the number of children symmetrical or skewed? Why?
Suppose that an analysis of a set of test scores reveals that:
87. What can you say about the relative position of each of the observations 34, 84, and 104?
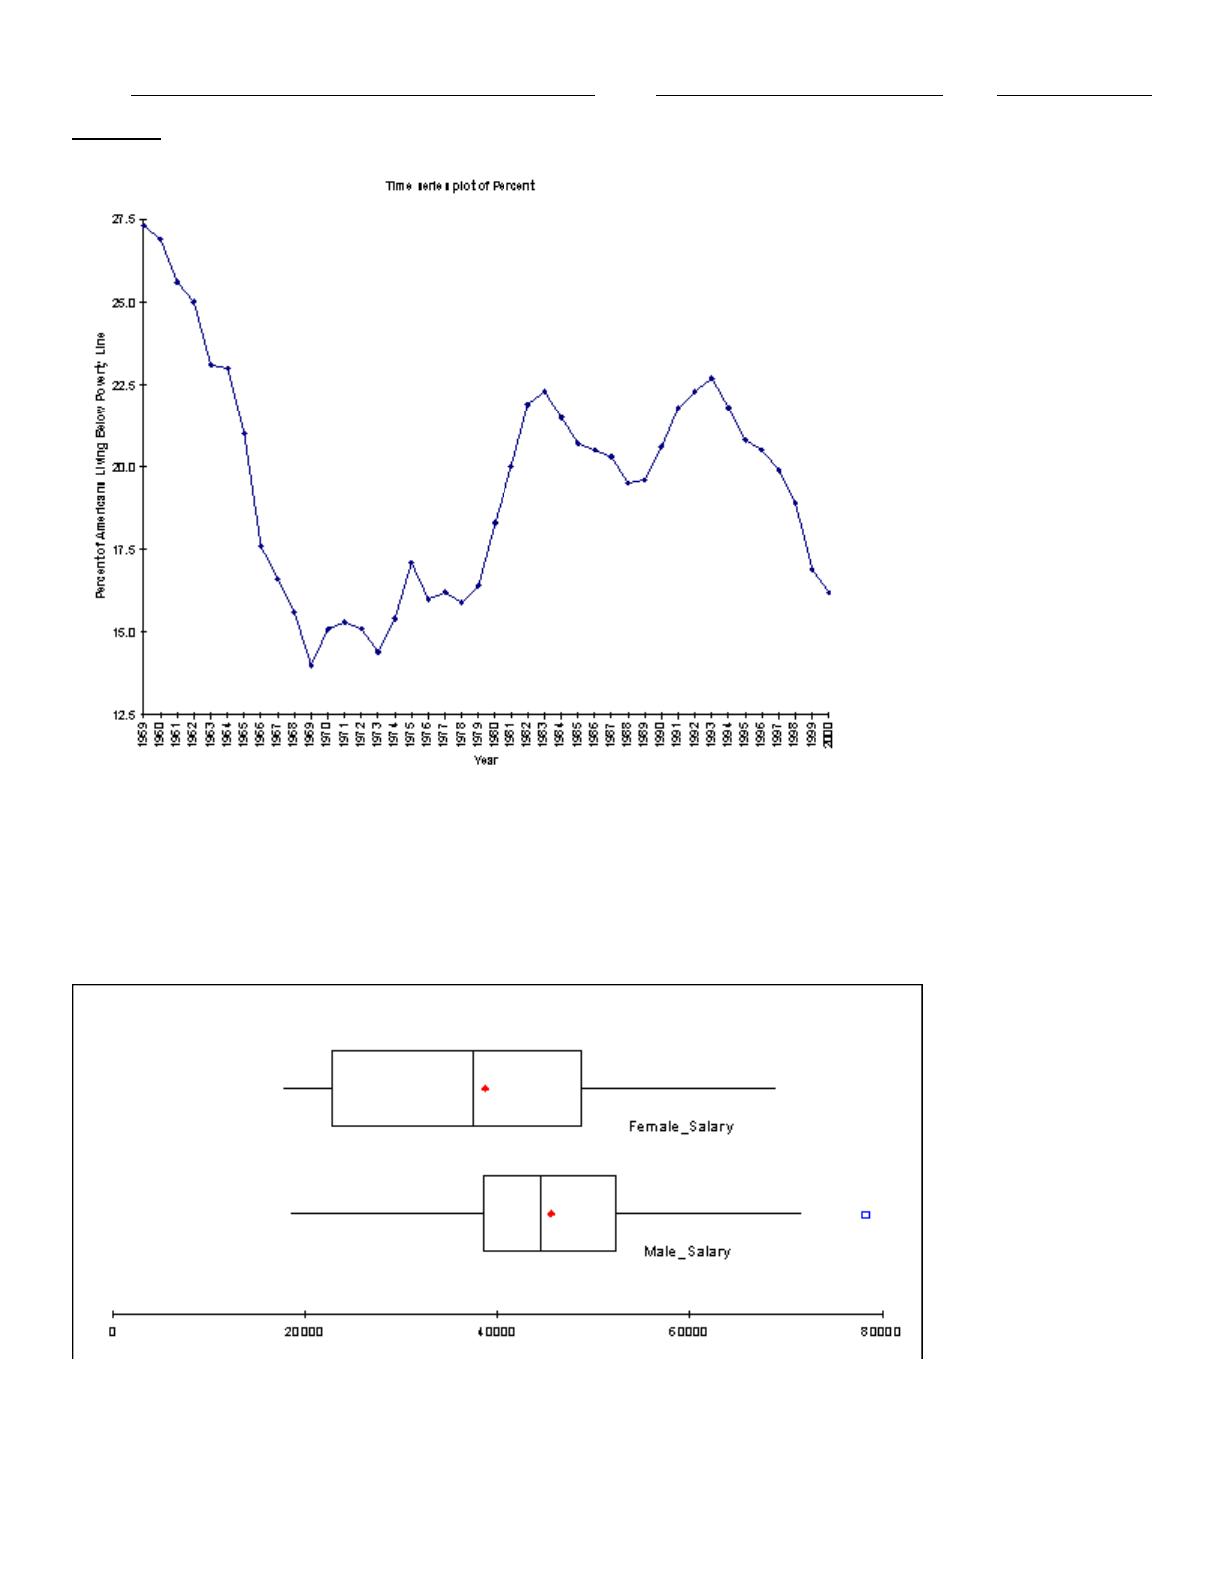
88. The proportion of Americans under the age of 18 who are living below the poverty line for each of the years 1959
through 2000 is used to generate the following time series plot.
Name:
Class:
Date:
chapter 2
How successful have Americans been recently in their efforts to win “the war against poverty” for the nation’s children?
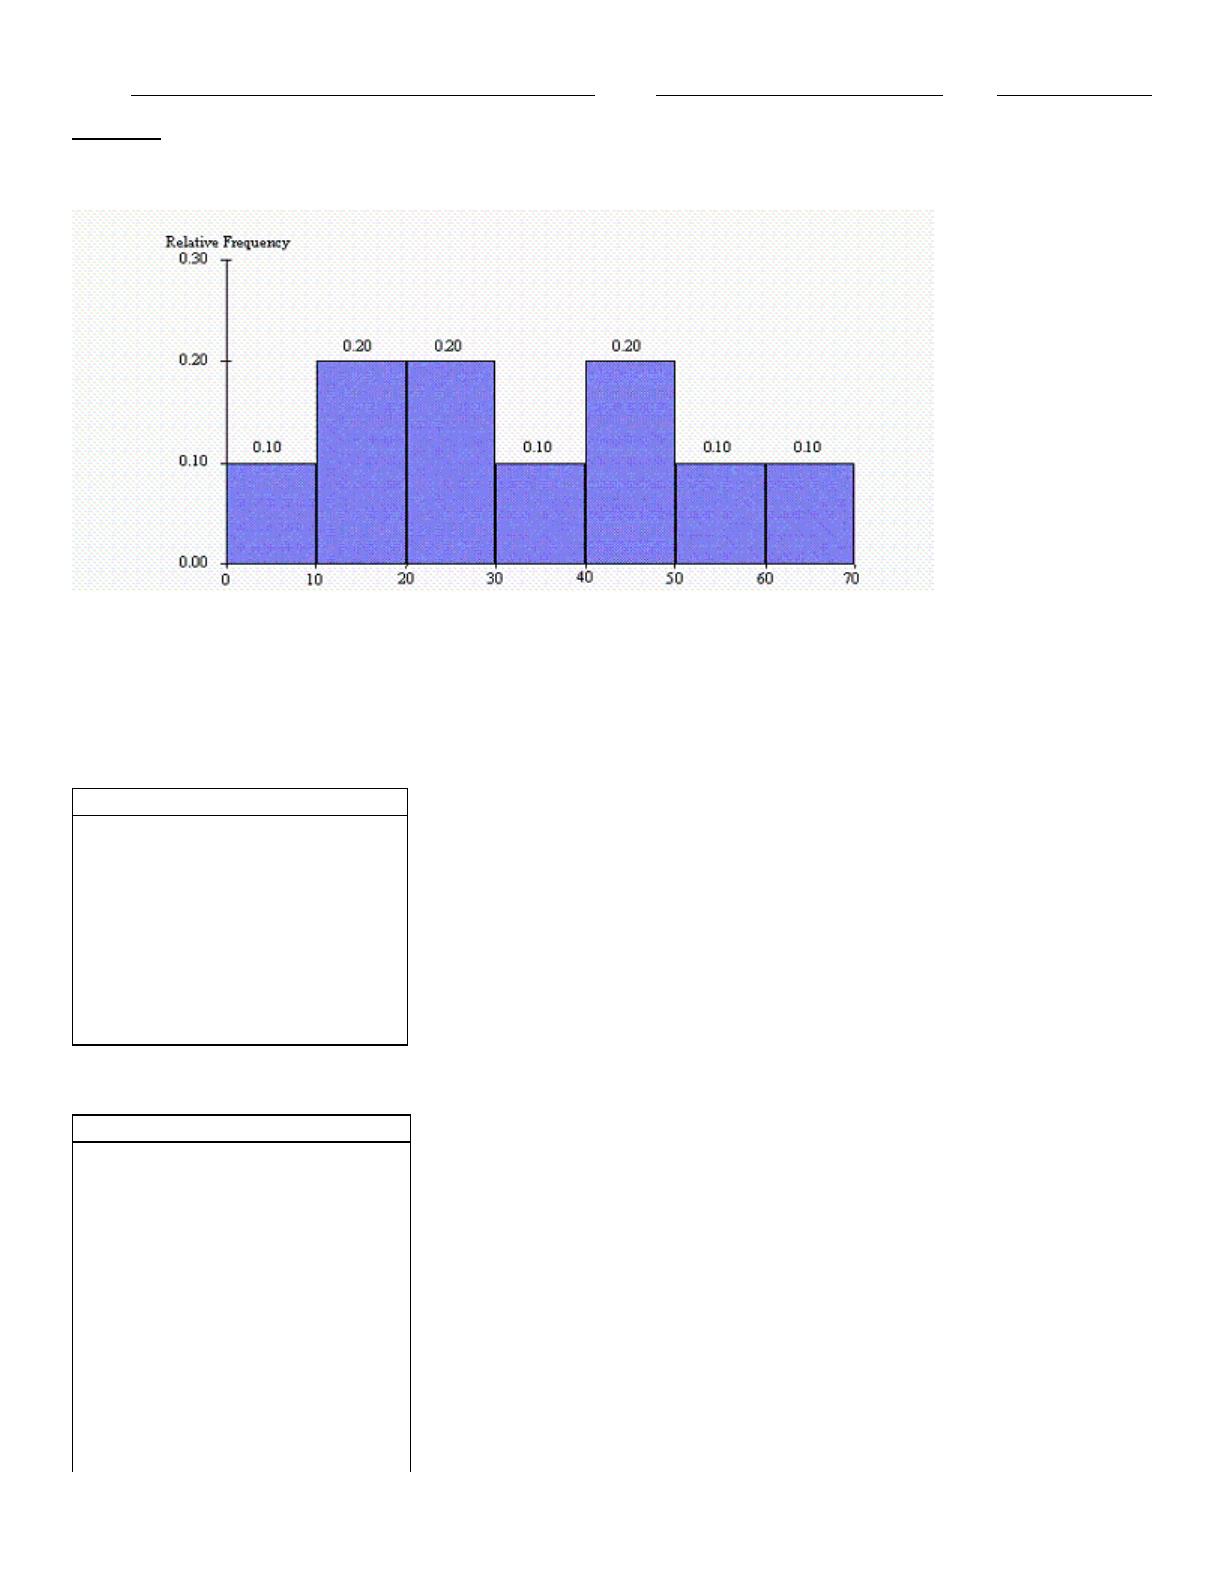
A manager for Marko Manufacturing, Inc. has recently been hearing some complaints that women are being paid less than
men for the same type of work in one of their manufacturing plants. The box plots shown below represent the annual
salaries for all salaried workers in that facility (40 men and 34 women).
89. How large must a person’s salary should be to qualify as an outlier on the high side? How many outliers are there in
these data?
Name:
Class:
Date:
chapter 2
The histogram below represents scores achieved by 250 job applicants on a personality profile.
90. What percentage of the job applicants scored between 30 and 40?
Below you will find summary measures on starting salaries for classroom teachers across the United States. You will also
find a list of selected states and their average starting teacher salary. All values are in thousands of dollars.
Starting salaries for classroom teachers across the United States
Salary
Count
51.000
Mean
35.890
Median
35.000
Standard deviation
6.226
Minimum
26.300
Maximum
50.300
Variance
38.763
First quartile
31.550
Third quartile
40.050
Selected states and their average starting teacher salary
State
Salary
Alabama
31.3
Colorado
35.4
Connecticut
50.3
Delaware
40.5
Nebraska
31.5
Nevada
36.2
New Hampshire
35.8
New Jersey
47.9
New Mexico
29.6
South Carolina
31.6
South Dakota
26.3
Tennessee
33.1
Texas
32.0
Name:
Class:
Date:
chapter 2
Utah
30.6
Vermont
36.3
Virginia
35.0
Wyoming
31.6
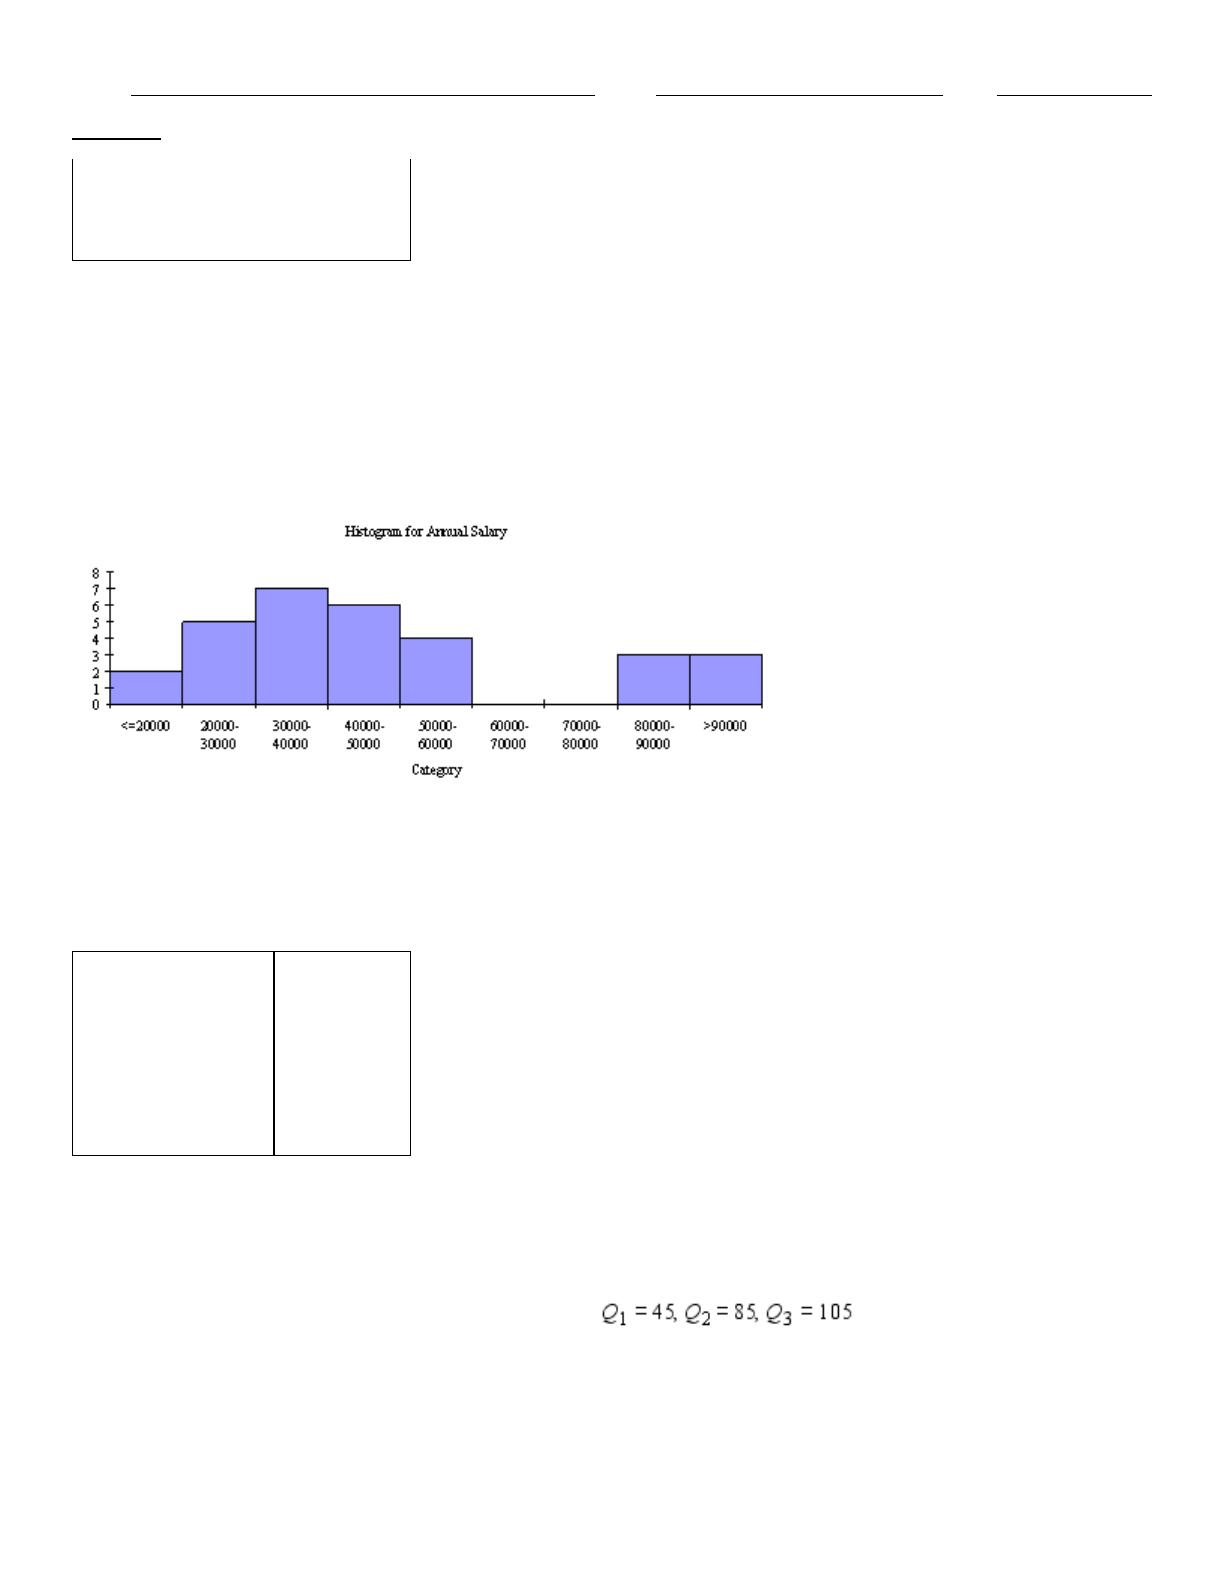
91. Which of the states listed paid their teachers average salaries that exceed at least 75% of all average salaries?
A financial analyst collected useful information for 30 employees at Gamma Technologies, Inc. These data include each
selected employees’ gender, age, number of years of relevant work experience prior to employment at Gamma, number of
years of employment at Gamma, number of years of post-secondary education, and annual salary.
92. Based on the histogram shown below, how would you describe the salary distribution for these data?
In an effort to provide more consistent customer service, the manager of a local fast-food restaurant would like to know
the dispersion of customer service times in relation to their average value for the facility’s drive-up window. The table
below provides summary measures for the customer service times (in minutes) for a sample of 50 customers collected
over the past week.
Count
50.000
Mean
0.873
Median
0.885
Standard deviation
0.432
Minimum
0.077
Maximum
1.608
Variance
0.187
Skewness
-0.003
93. Are the empirical rules applicable in this case? If so, apply them and interpret your results. If not, explain why the
empirical rules are not applicable here.
Suppose that an analysis of a set of test scores reveals that:
94. What do these statistics tell you about the shape of the distribution?
In an effort to provide more consistent customer service, the manager of a local fast-food restaurant would like to know
the dispersion of customer service times in relation to their average value for the facility’s drive-up window. The table
below provides summary measures for the customer service times (in minutes) for a sample of 50 customers collected

Name:
Class:
Date:
chapter 2
over the past week.
Count
50.000
Mean
0.873
Median
0.885
Standard deviation
0.432
Minimum
0.077
Maximum
1.608
Variance
0.187
Skewness
-0.003
95. Interpret the variance and standard deviation of this sample.
Below you will find summary measures on starting salaries for classroom teachers across the United States. You will also
find a list of selected states and their average starting teacher salary. All values are in thousands of dollars.
Starting salaries for classroom teachers across the United States
Salary
Count
51.000
Mean
35.890
Median
35.000
Standard deviation
6.226
Minimum
26.300
Maximum
50.300
Variance
38.763
First quartile
31.550
Third quartile
40.050
Selected states and their average starting teacher salary
State
Salary
Alabama
31.3
Colorado
35.4
Connecticut
50.3
Delaware
40.5
Nebraska
31.5
Nevada
36.2
New Hampshire
35.8
New Jersey
47.9
New Mexico
29.6
South Carolina
31.6
South Dakota
26.3
Tennessee
33.1
Texas
32.0
Utah
30.6
Vermont
36.3
Virginia
35.0
Wyoming
31.6
Name:
Class:
Date:
chapter 2
96. How would you describe the salary of Virginia’s teachers compared to those across the entire United States? Justify
your answer.
97. What salary amount represents the second quartile?
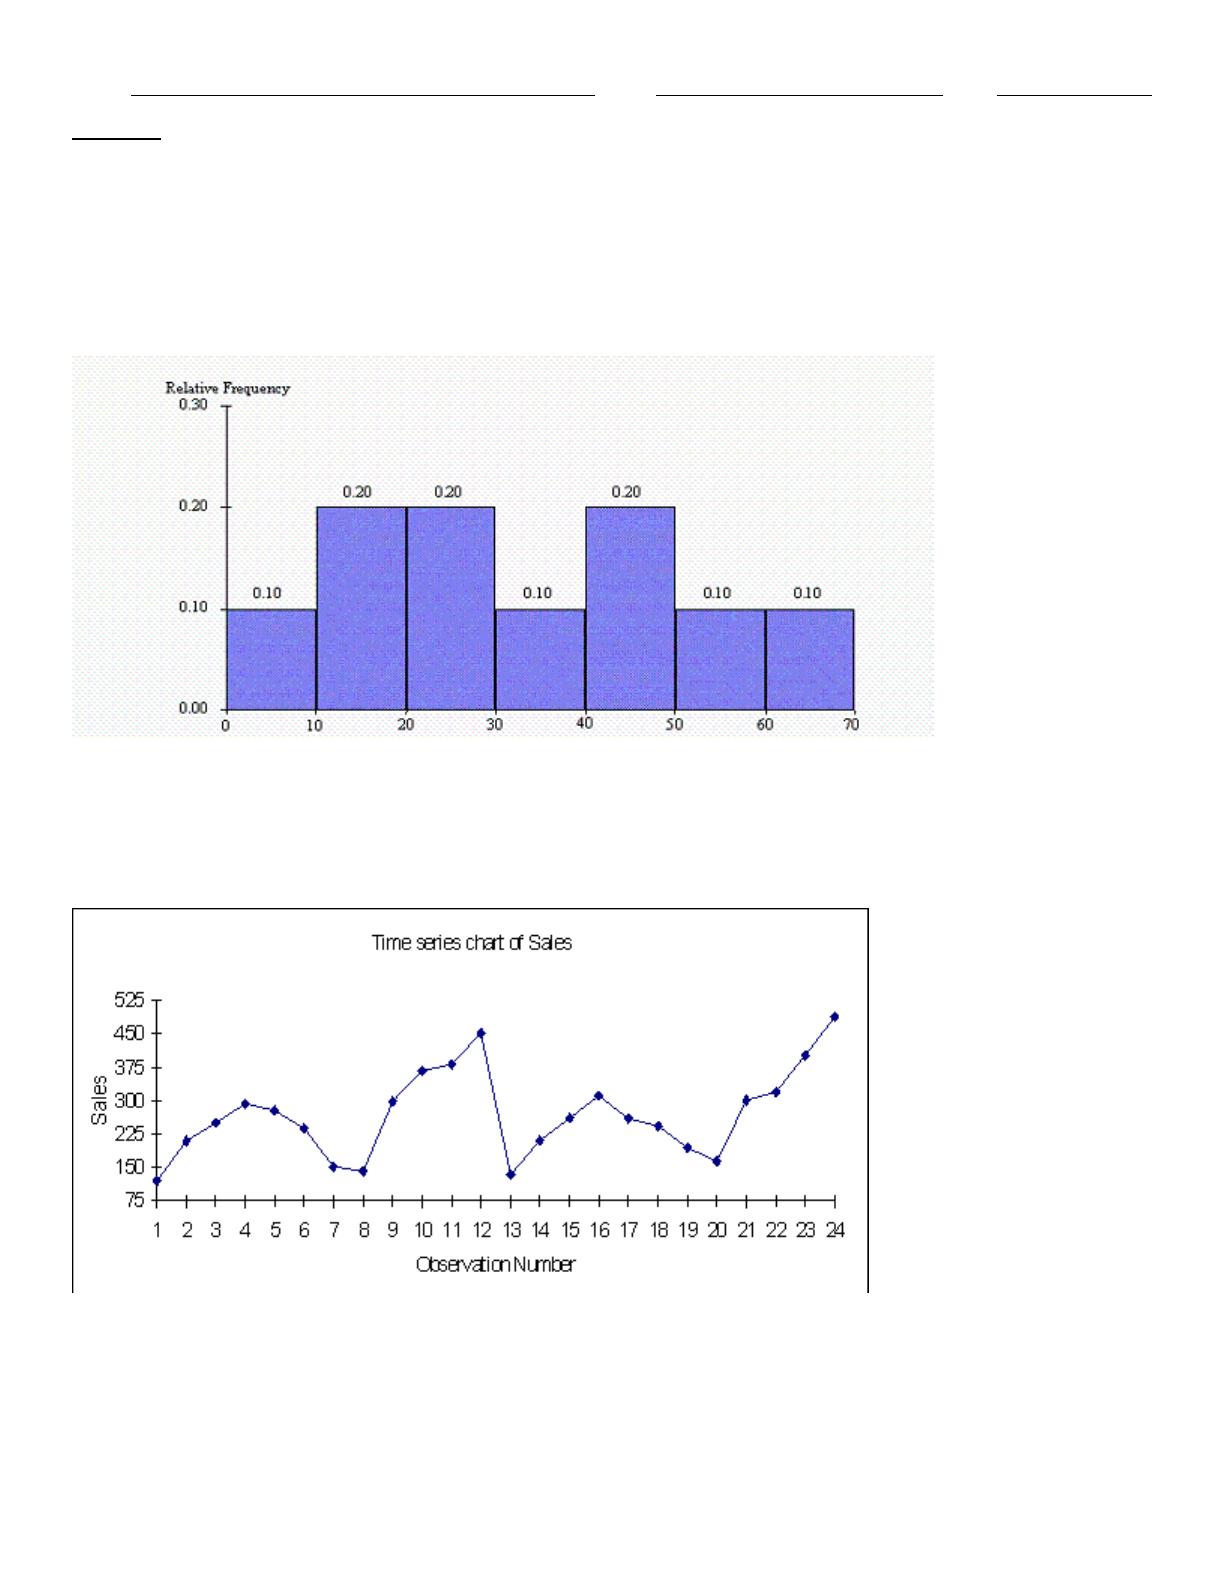
The histogram below represents scores achieved by 250 job applicants on a personality profile.
98. What percentage of the job applicants scored below 60?
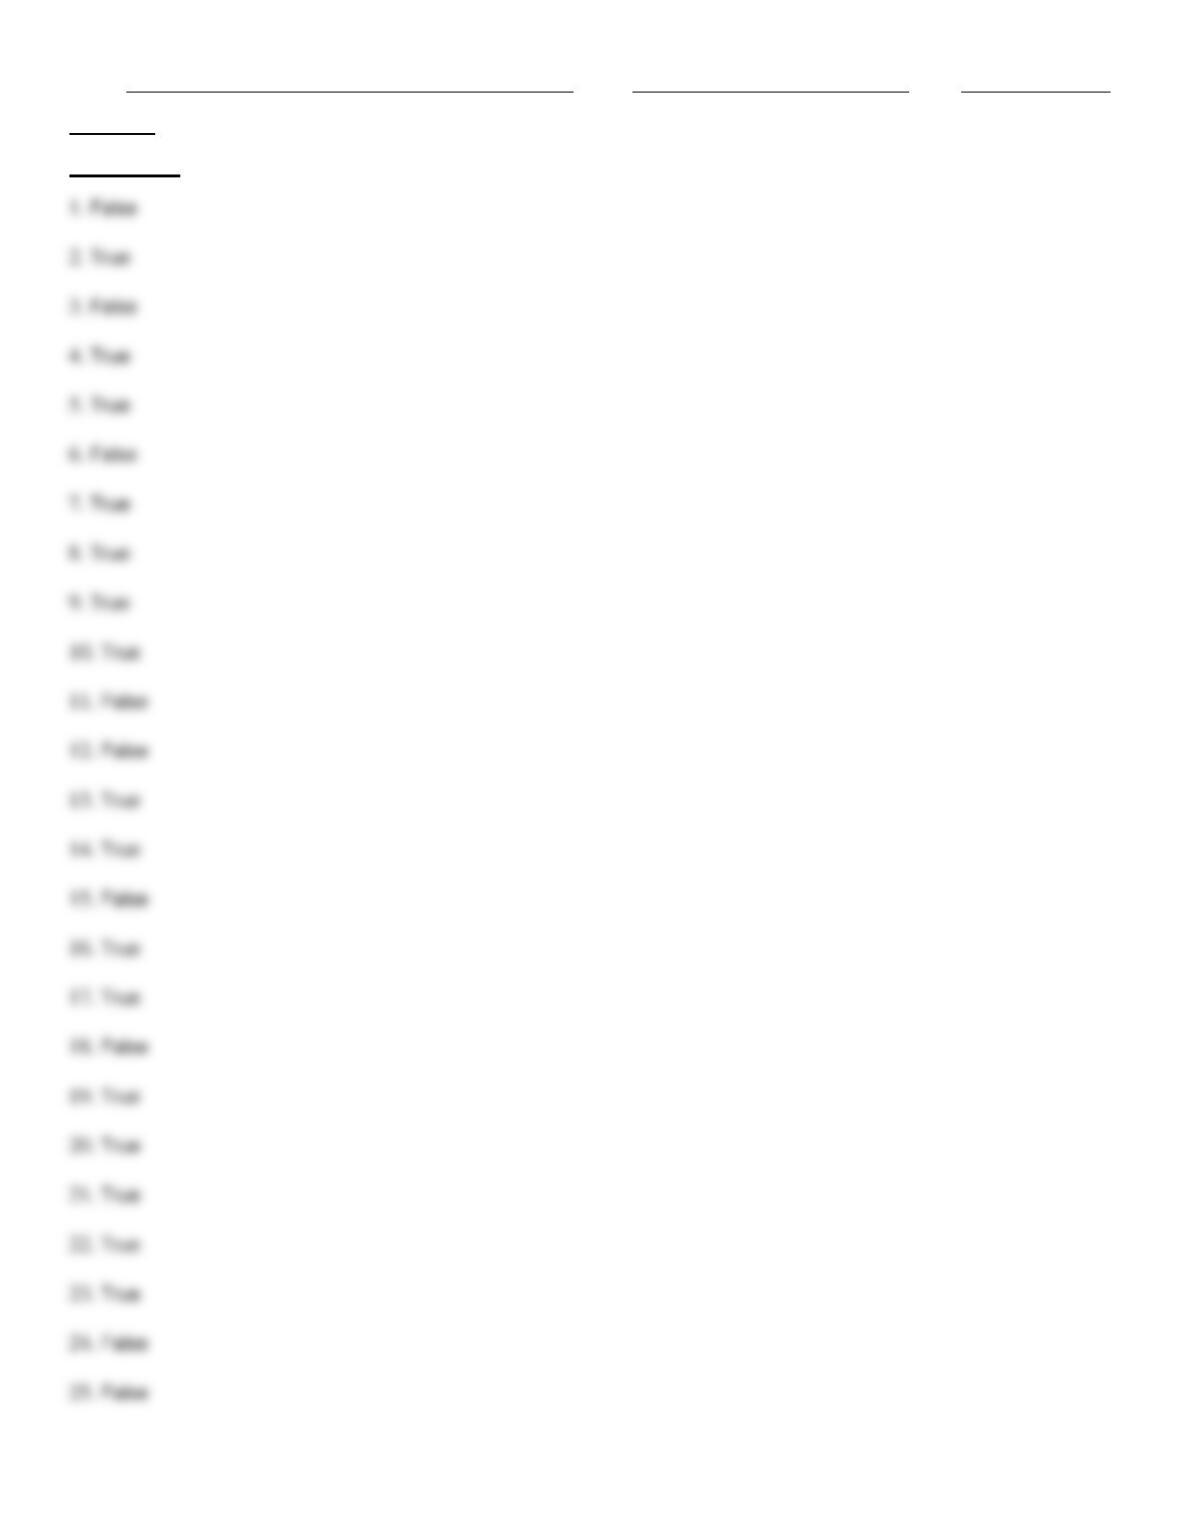
99. The data below represents monthly sales for two years of beanbag animals at a local retail store (Month 1 represents
January and Month 12 represents December). Given the time series plot below, do you see any obvious patterns in the
data? Explain.
The following data represent the number of children in a sample of 10 families from Chicago: 4, 2, 1, 1, 5, 3, 0, 1, 0, and
2.
100. Compute the median number of children.
Name:
Class:
Date:
chapter 2
Answer Key
Name:
Class:
Date:
chapter 2
Name:
Class:
Date:
chapter 2
Alabama at 31.3; Nebraska at 31.5; New Mexico at 29.6; South Dakota at 26.3; and Utah at 30.6 (all those < 31.55).
are above the age of 30 years and only one worker is 20 years old or younger.
Name:
Class:
Date:
chapter 2
percentile shows that the mean increase might be because the rich got richer.
are above 90 and 12% of scores are 70 or below.
Name:
Class:
Date:
chapter 2
equivalent in this case.
The distribution is positively skewed because the mean is larger than the median.
Name:
Class:
Date:
chapter 2
Connecticut at 50.3; Delaware at 40.5; and New Jersey at 47.9 (all those 40.05).
expressed in the same units (minutes) as the values of the random variable (customer service time).
$35,000 (median)

Name:
Class:
Date:
chapter 2
Median = 1.5