Chapter 2
1.
Recently Esther swam a lap in an Olympic swimming pool (the length of the pool is 50
meters, and the length of a lap is 100 meters); her times for various positions s (in
meters from her starting point) during the lap are given in the following table. Her
approximate velocity at time t=3.2 seconds was _____ m/sec. Round to 3 decimal
places.
t(sec)
0
6.4
13.2
20.4
27.6
34.8
41.6
48.4
55.6
62.8
69.6
s(m)
0
10
20
30
40
50
40
30
20
10
0
2.
Let
2
()f t t t=+
. What is the change in
()ft
between t=2 and t=5?
Ans:
24
Learning Objectives: Understand instantaneous rate of change/derivative numerically.
difficulty: easy section: 2.1
3.
An amount of $500 was invested in 1970 and the investment grew as shown in the
following table. (Amounts are given for the beginning of the year.) The average rate
of increase of the investment between 1980 and 1990 is _____ per year.
Year
1970
1975
1980
1985
1990
1995
Capital
500
966
1856
3578
6876
13,233
Ans:
$502.00
Learning Objectives: Understand instantaneous rate of change/derivative numerically.
difficulty: easy section: 2.1
4.
If
1/ 3
()x V V=
is the length of the side of a cube in terms of its volume, then calculate
the average rate of change of x with respect to V over the interval 1<V<2. Round to 2
decimal places.
Ans:
0.26
Learning Objectives: Understand instantaneous rate of change/derivative numerically.
difficulty: medium section: 2.1
5.
Let
1/ 3
()x V V=
be the length of the side of a cube in terms of its volume. As V
decreases, does the rate of change of x increase or decrease?
Ans:
increase
Learning Objectives: Understand instantaneous rate of change/derivative numerically.
difficulty: easy section: 2.1
Ans:
1.563
Learning Objectives: Understand instantaneous rate of change/derivative numerically.
difficulty: easy section: 2.1
Chapter 2
6.
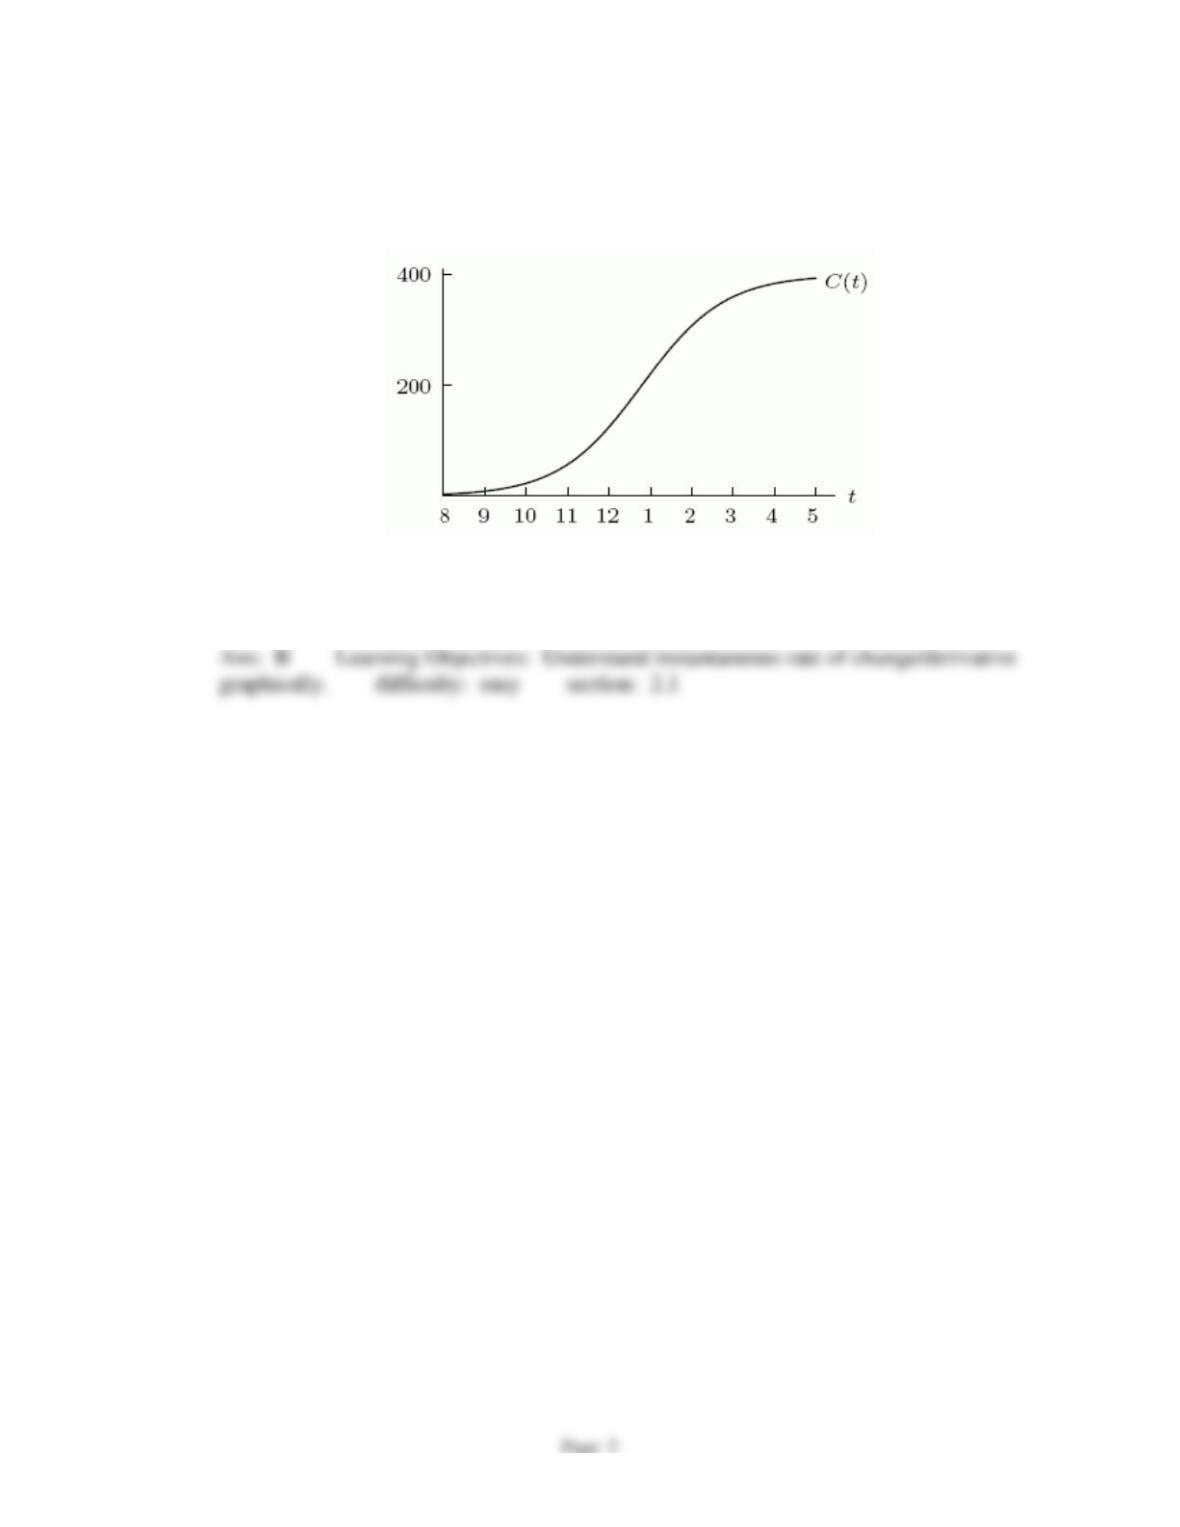
The following figure is the graph of
()N C t=
, the cumulative number of customers
served in a certain store during business hours one day, as a function of the hour of the
day. About when was the store the busiest?
A)
11am
B)
1pm
C)
3pm
D)
5pm
Chapter 2
7.
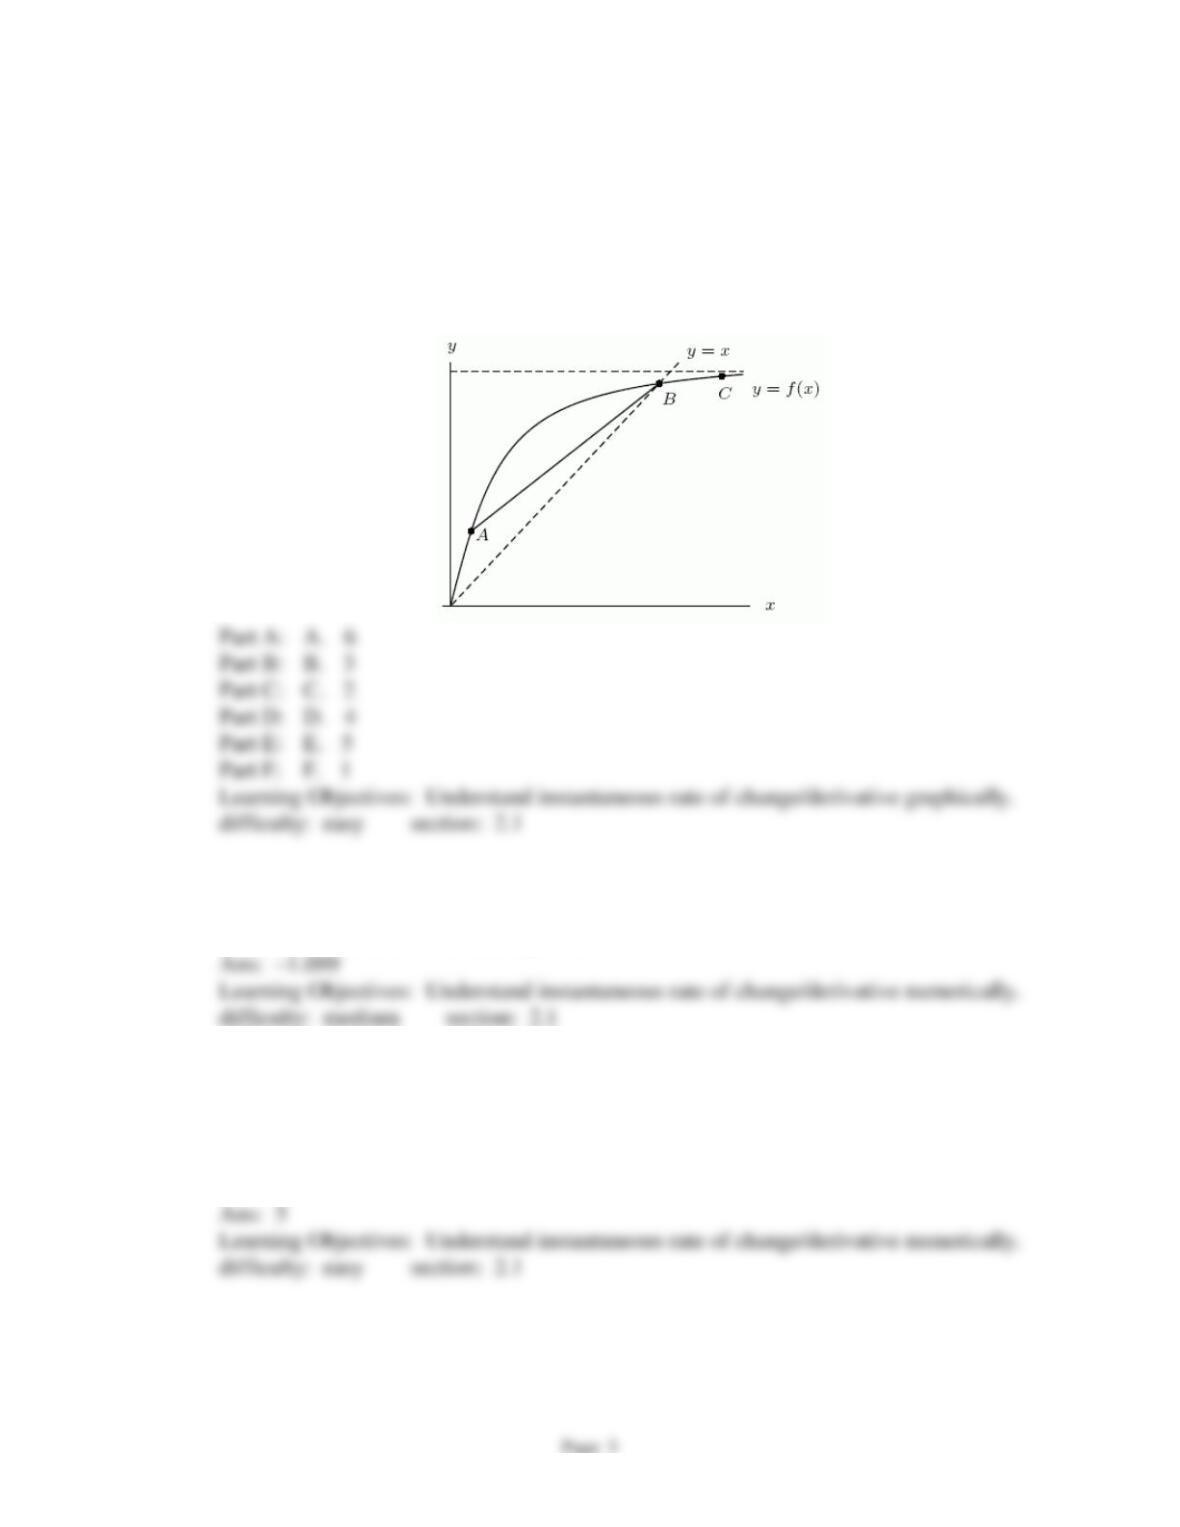
The graph of
()y f x=
is shown below. Arrange the following values in order from
smallest to largest by placing a “1” by the smallest, a “2” by the next smallest, and so
forth.
A.
‘( )fA
B.
‘( )fB
C.
‘( )fC
Part A:
A. 6
Part B:
B. 3
Part C:
C. 2
Part D:
D. 4
Part E:
E. 5
Part F:
F. 1
D. slope AB E. 1
F. 0
8.
Estimate
‘(0)f
when
( ) 3 x
fx −
=
. Take smaller and smaller intervals until your
estimate is accurate to 3 decimal places.
Ans:
difficulty: medium section: 2.1
9.
Given the following data about the function f, estimate
‘(3.3)f
.
x
3.0
3.2
3.4
3.6
3.8
()fx
8.2
9.5
10.5
11.0
13.2
Ans:
5
difficulty: easy section: 2.1
Chapter 2
10.
Given the following data about the function f, give the average rate of change of f
between x=3.2 and x=3.8. Round to 2 decimal places.
x
3.0
3.2
3.4
3.6
3.8
()fx
8.2
9.5
10.5
11.0
13.2
Ans:
6.17
difficulty: medium section: 2.1
11.
Given the following data about the function f, the equation of the tangent line at x=3.2
is approximately y = _____x+_____. Use the nearest right-hand value to make your
estimate.
x
3.0
3.2
3.4
3.6
3.8
()fx
8.2
9.5
10.5
11.0
13.2
Part A:
5
Part B:
difficulty: medium section: 2.1
12.
A certain function f is decreasing and concave down. In addition,
‘(3) 2f=−
and
(3) 3f=
. Which of the following are possible values for
(2)f
? Select all that apply.
A)
3
B)
4
C)
5
D)
6
numerically. difficulty: easy section: 2.1
Chapter 2
13.
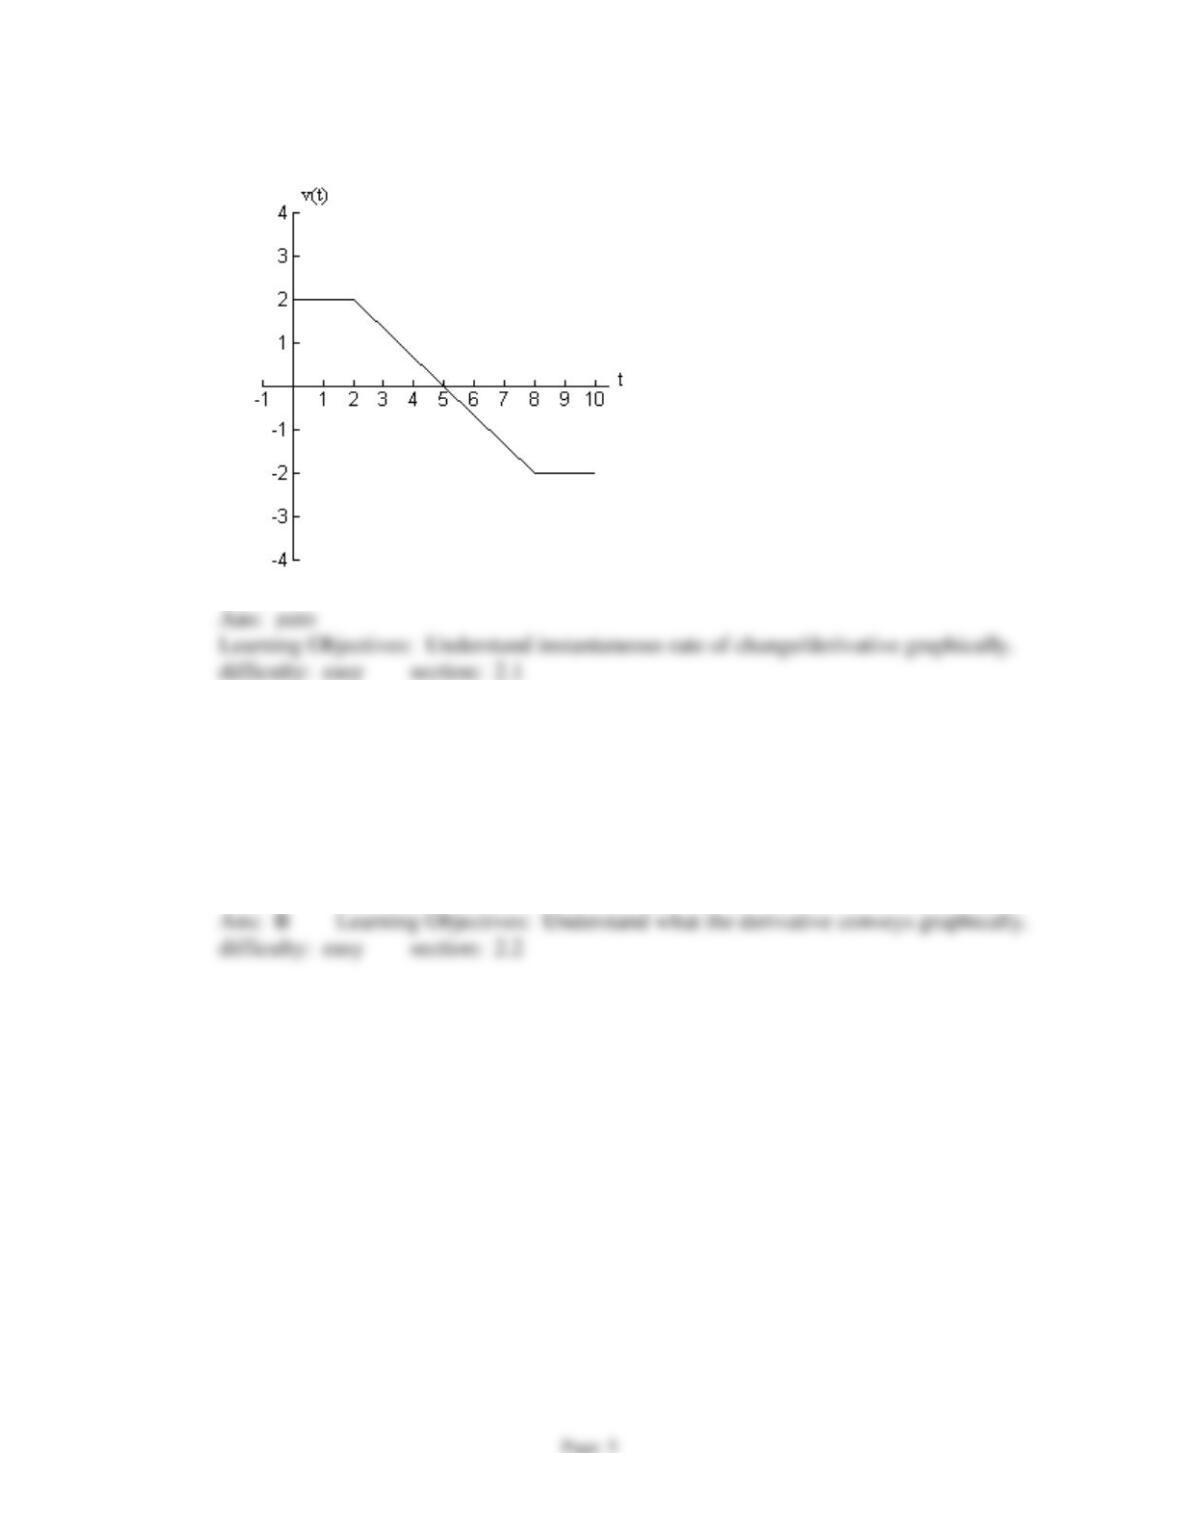
Given the graph below of
()y v t=
, is
(9)v
positive, negative, zero or undefined?
Ans:
zero
difficulty: easy section: 2.1
14.
A certain function f is decreasing and concave down. In addition,
‘(3) 2f=−
and
(3) 6f=
. Which of the following are possible zeroes of f? Select all that apply.
A)
3
B)
5
C)
7
D)
9
difficulty: easy section: 2.2
Chapter 2
15.
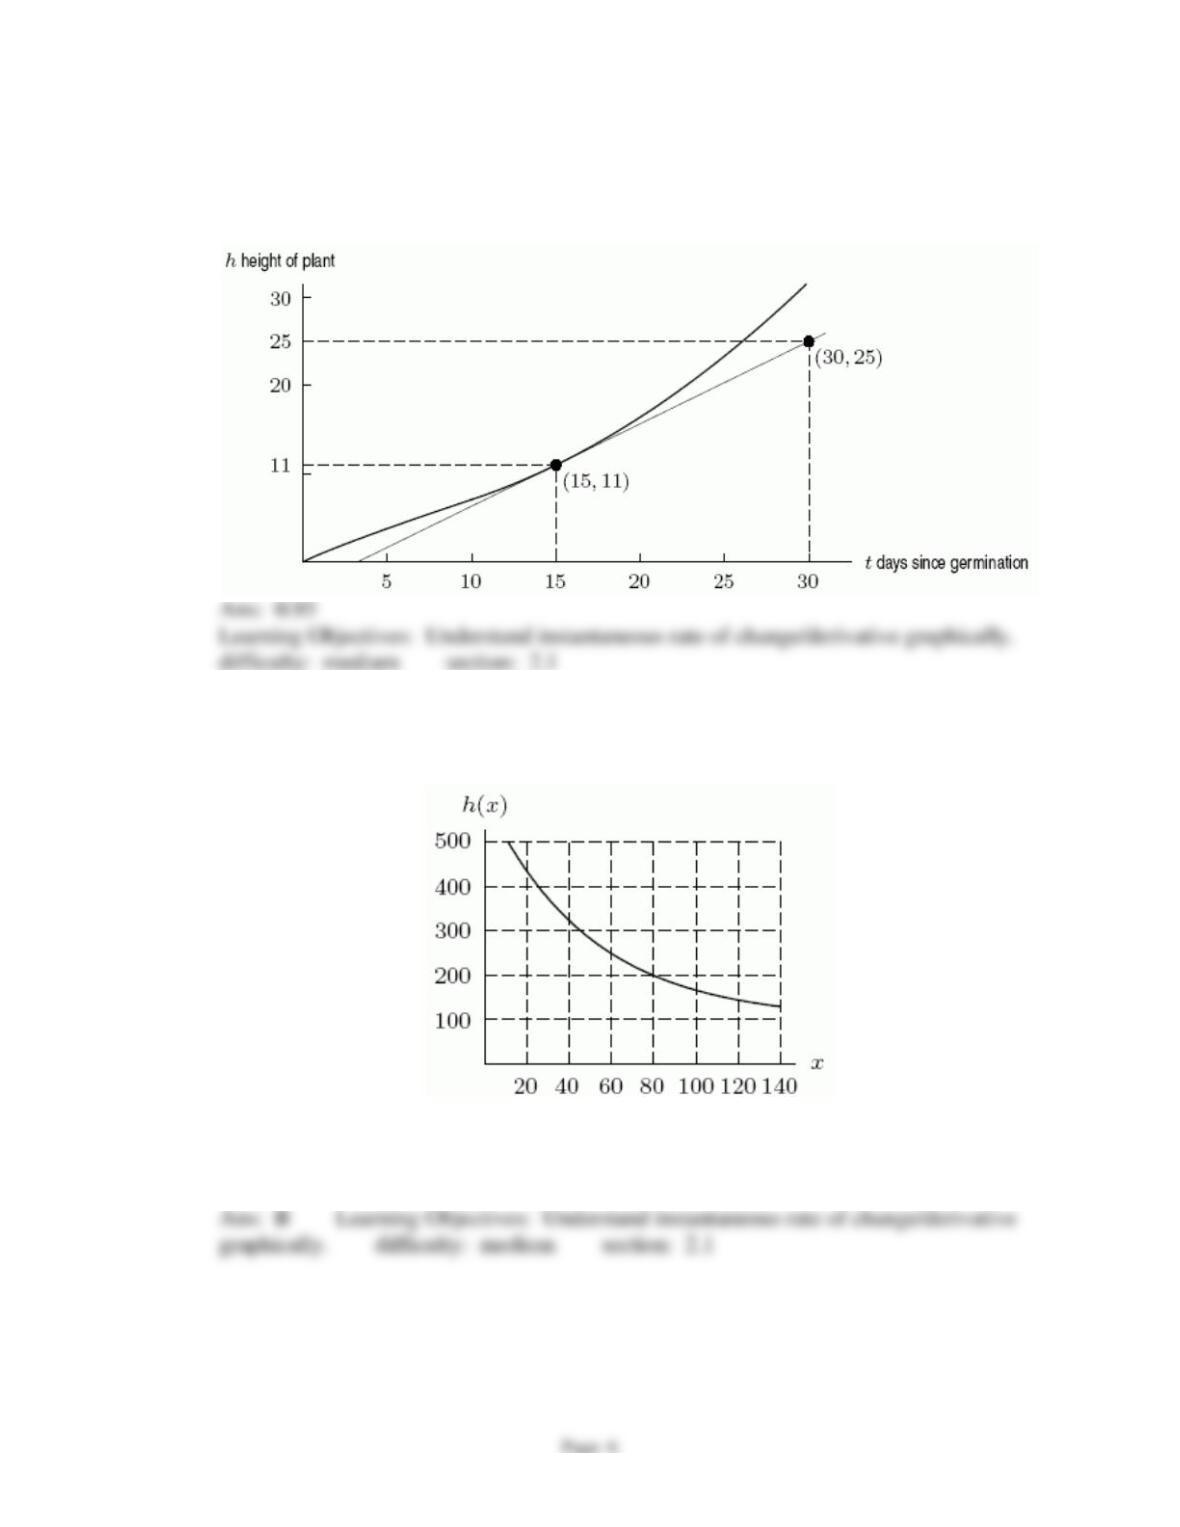
The growth graph in the following figure shows the height in inches of a bean plant
during 30 days. On the 15th day, the plant was growing about _____ inches/day.
Round to 2 decimal places.
16.
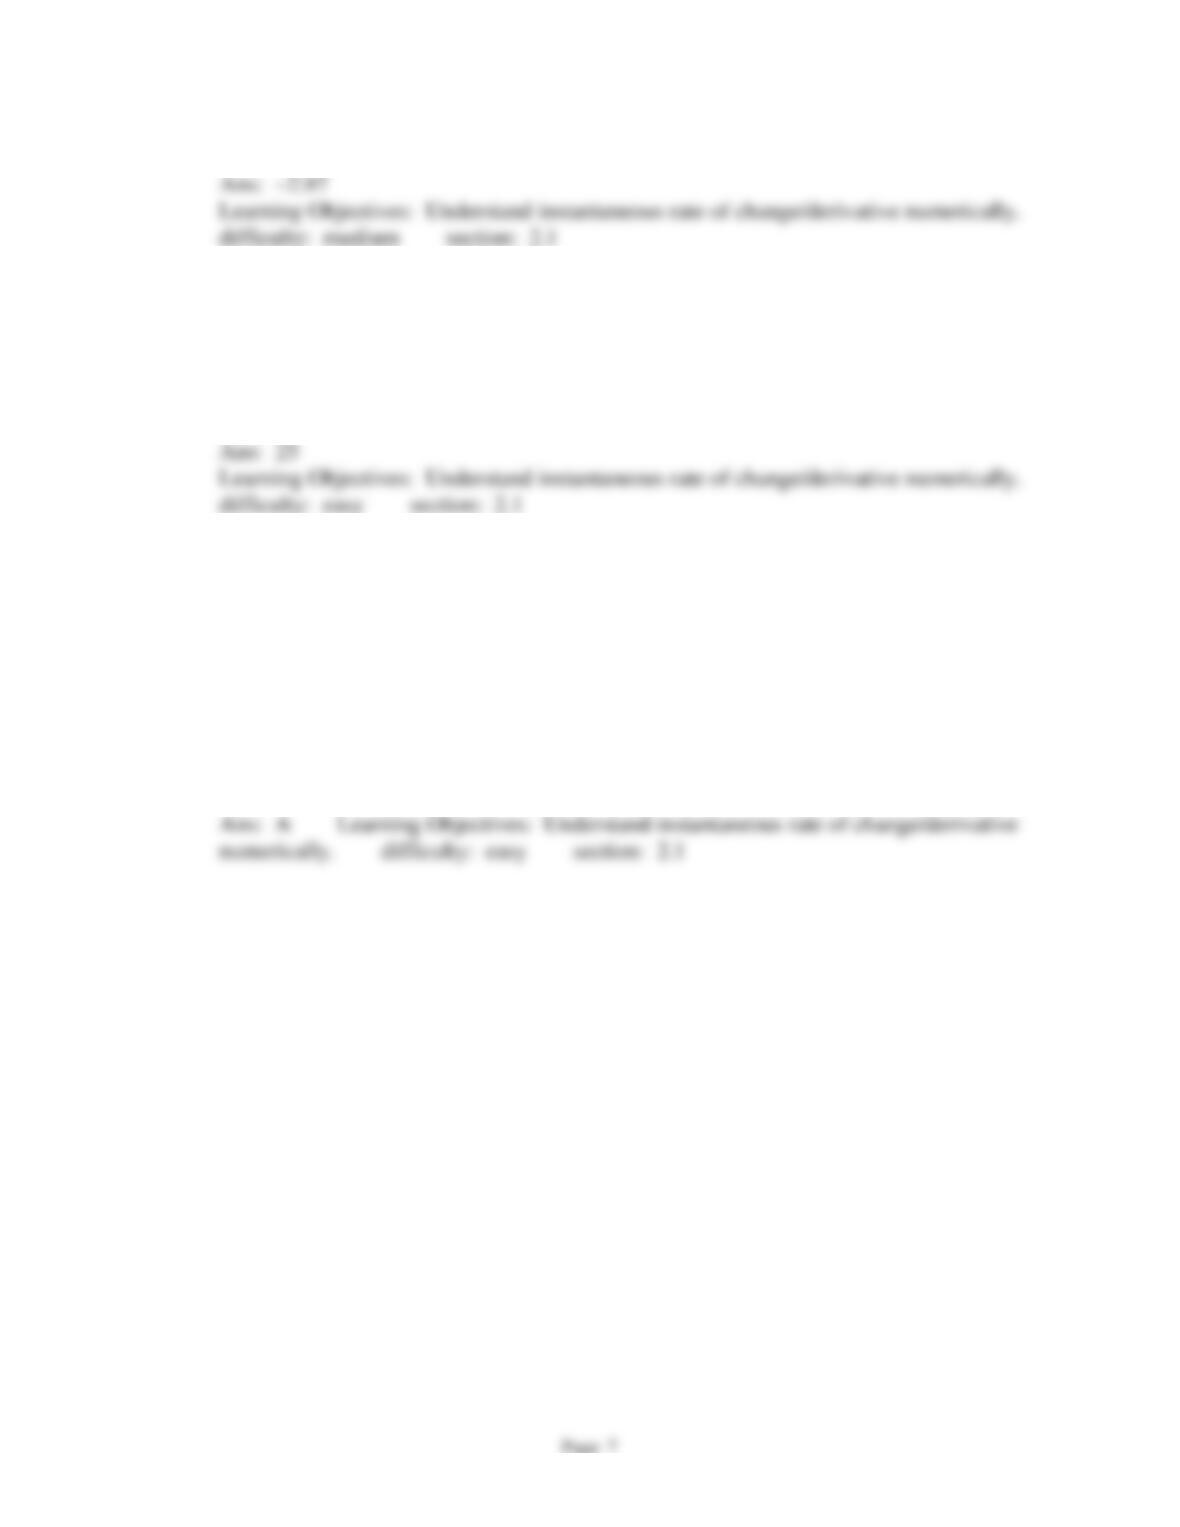
From the following graph, estimate
‘(80)f
.
A)
–3.25
B)
–2.25
C)
–1.25
D)
–0.25
Chapter 2
17.
Using a difference quotient, compute
‘(1)f
to 2 decimal places for
( ) sin(3 )f x x=
.
Ans:
Learning Objectives: Understand instantaneous rate of change/derivative numerically.
difficulty: medium section: 2.1
18.
The height of an object in feet above the ground is given in the following table. The
average velocity over the interval
03t
is _____ feet/sec.
t(sec)
0
1
2
3
4
5
6
y(feet)
10
45
70
85
90
85
70
Ans:
25
19.
The height of an object in feet above the ground is given in the following table.
t(sec)
0
1
2
3
4
5
6
y(feet)
10
45
70
85
90
85
70
If the height of the object is doubled, the average velocity over any interval
A)
doubles also.
B)
stays the same.
C)
is cut in half.
Ans: A Learning Objectives: Understand instantaneous rate of change/derivative
numerically. difficulty: easy section: 2.1
Chapter 2
20.
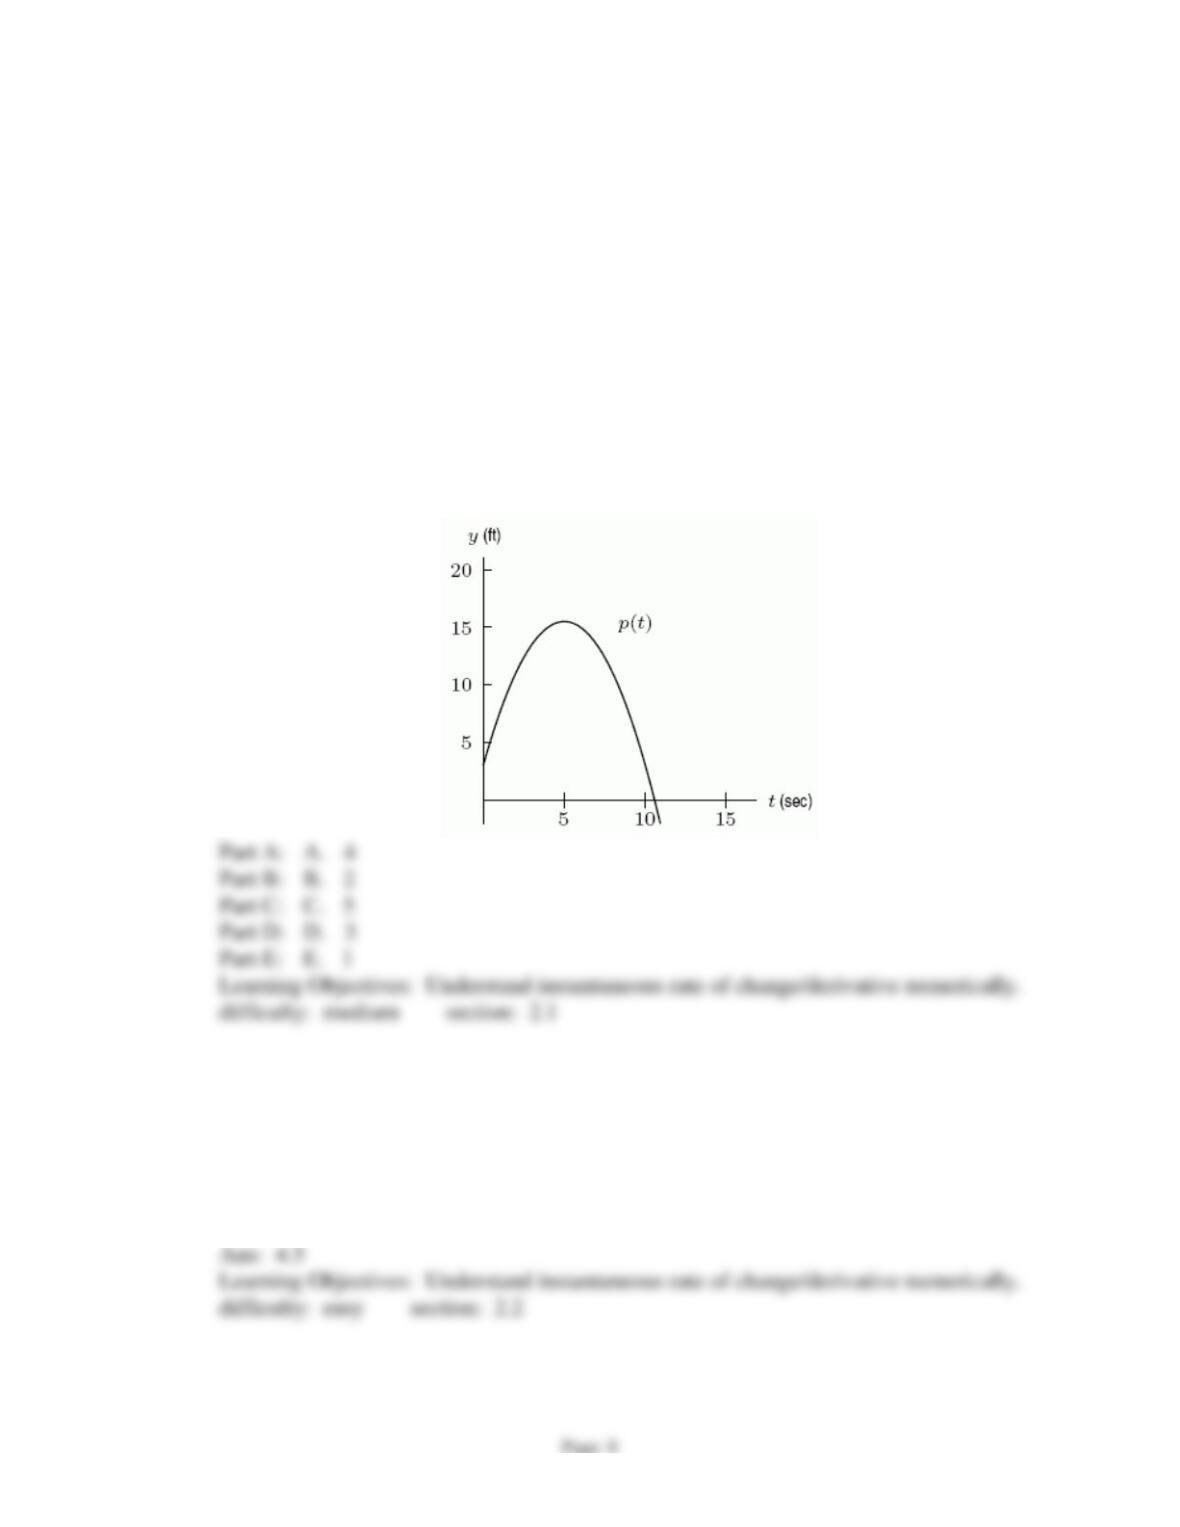
The graph of
()pt
in the figure gives the position of a particle at time t. Arrange the
following values in order from smallest to largest by placing a “1” by the smallest, a “2”
by the next smallest, and so forth.
A. average velocity on
13t
.
B. average velocity on
8 10t
.
C. instantaneous velocity at t=1.
D. instantaneous velocity at t=3.
E. instantaneous velocity at t=10.
21.
Estimate the value of
‘(2)f
using the following table. Use the nearest right-hand
value to make your estimate.
x
0
0.5
1
1.5
2
2.5
()fx
1
1.25
2
3.25
5
7.25
Chapter 2
22.
Using the following table, tell whether
‘(–1)f
is likely greater than 0, likely less than
0, or might be equal to 0. Type “<“,”>”, or “=”.
x
-4
-3
-2
-1
0
1
2
3
4
()fx
7
6
2
1
2
3
2
-1
-5
23.
A certain bacterial colony was observed for several hours and the following conditions
were reported. Let
()Nt
be the number of bacteria present after t hours.
•
There were 1000 bacteria after 5 hours.
•
The growth rate was never negative and never exceeded 100 per hour.
•
The growth rate was decreasing for the first 5 hours.
•
At 7 hours, the growth rate was zero.
Is it possible that
(7) 1150N=
?
24.
A certain bacterial colony was observed for several hours and the following conditions
were reported. Let
()Nt
be the number of bacteria present after t hours.
•
There were 1000 bacteria after 5 hours.
•
The growth rate was never negative and never exceeded 100 per hour.
•
The growth rate was decreasing for the first 5 hours.
•
At 7 hours, the growth rate was zero.
Is it possible that
‘(7) 0N=
?
Chapter 2
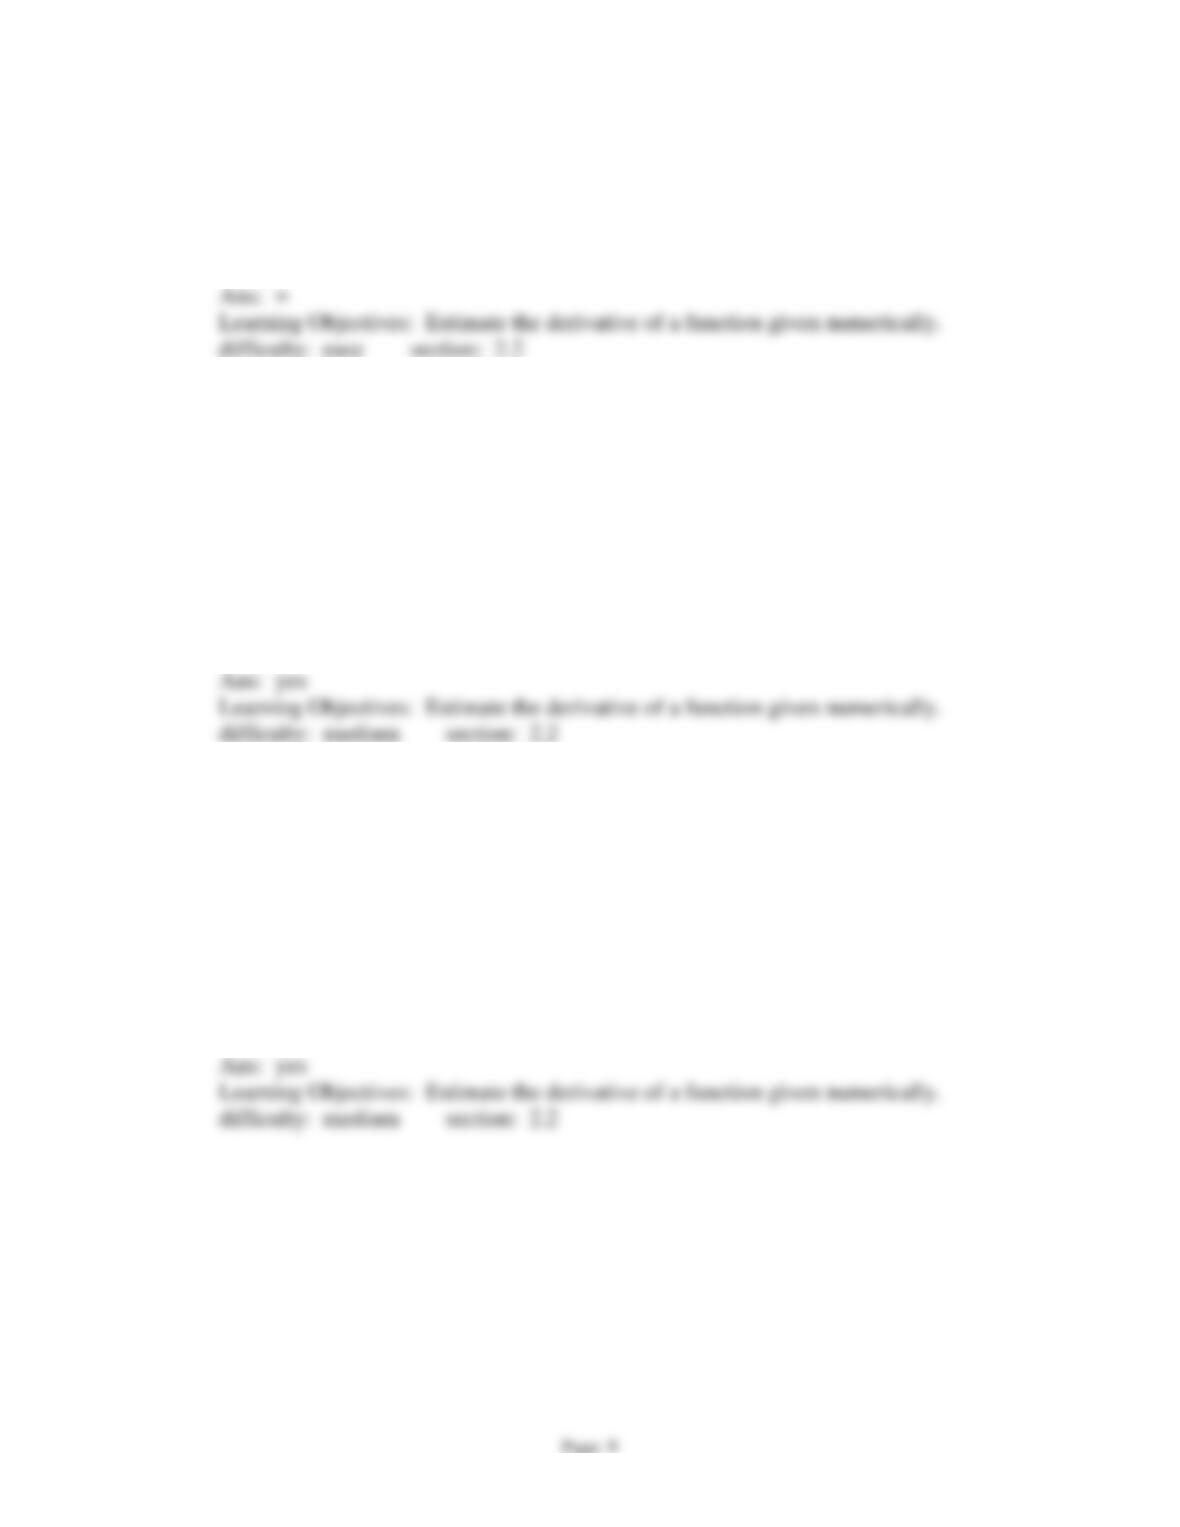
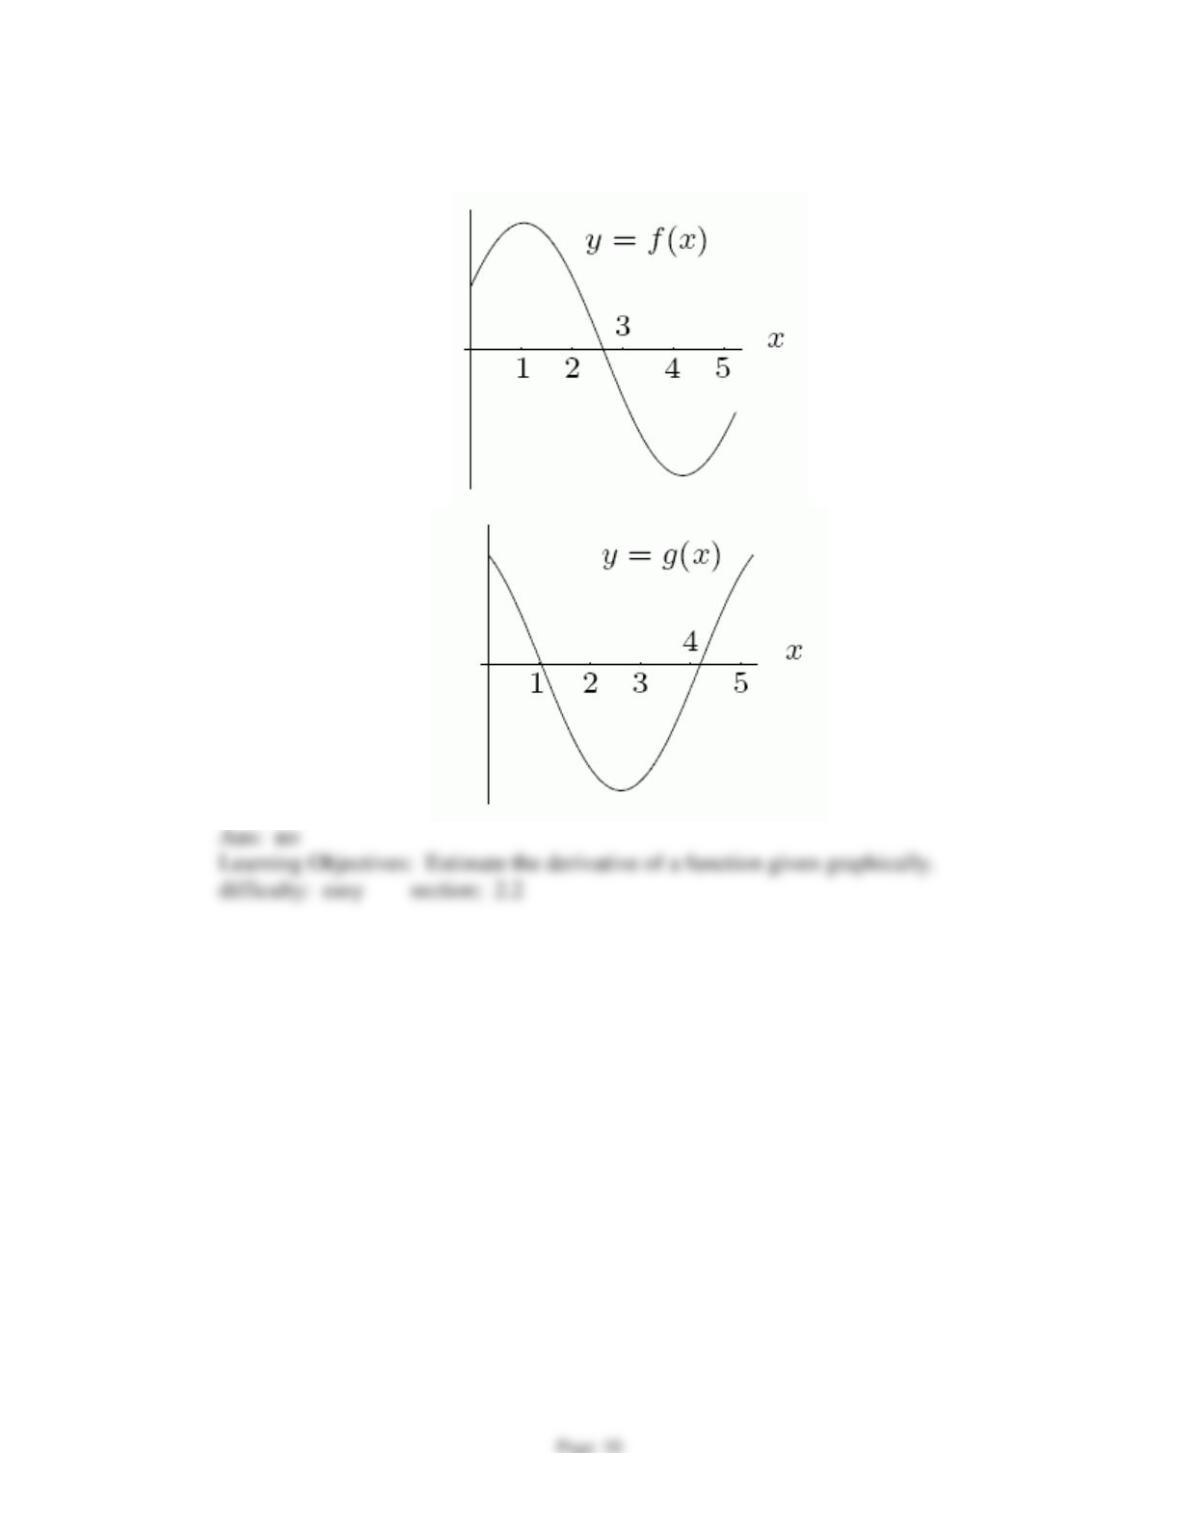
25.
Considering the graphs below, could f(x) be the derivative of g(x)?
Chapter 2
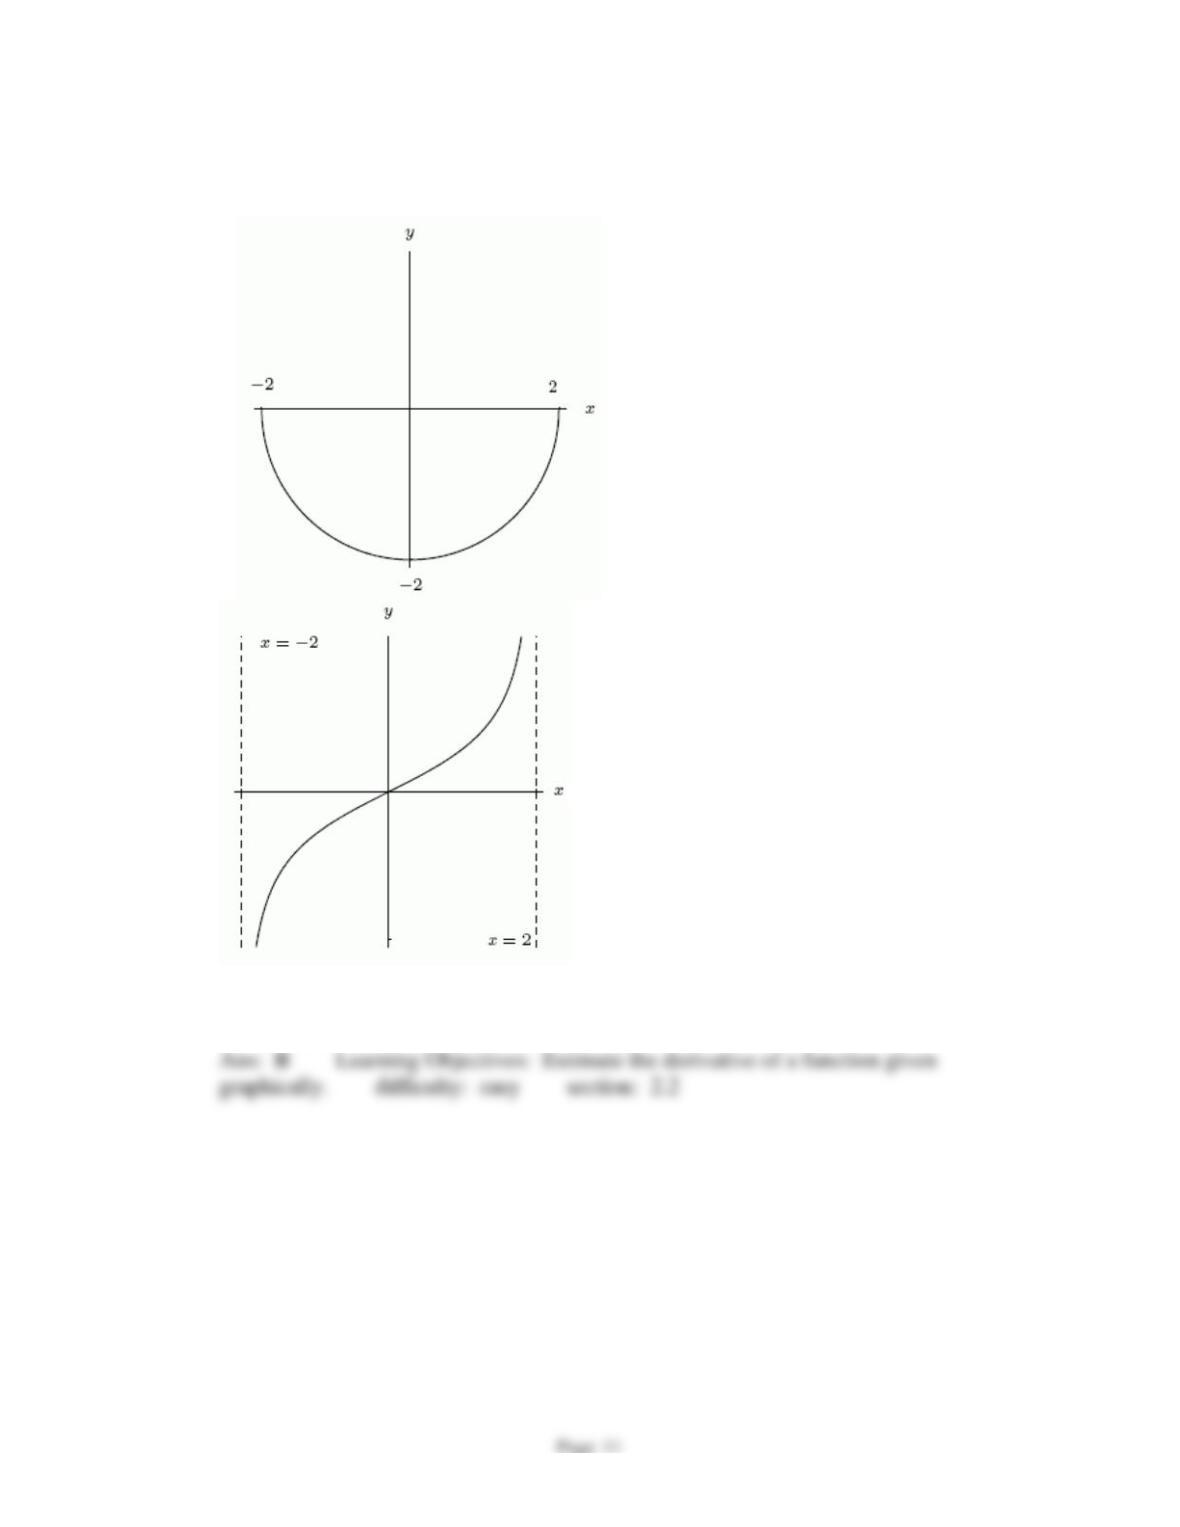
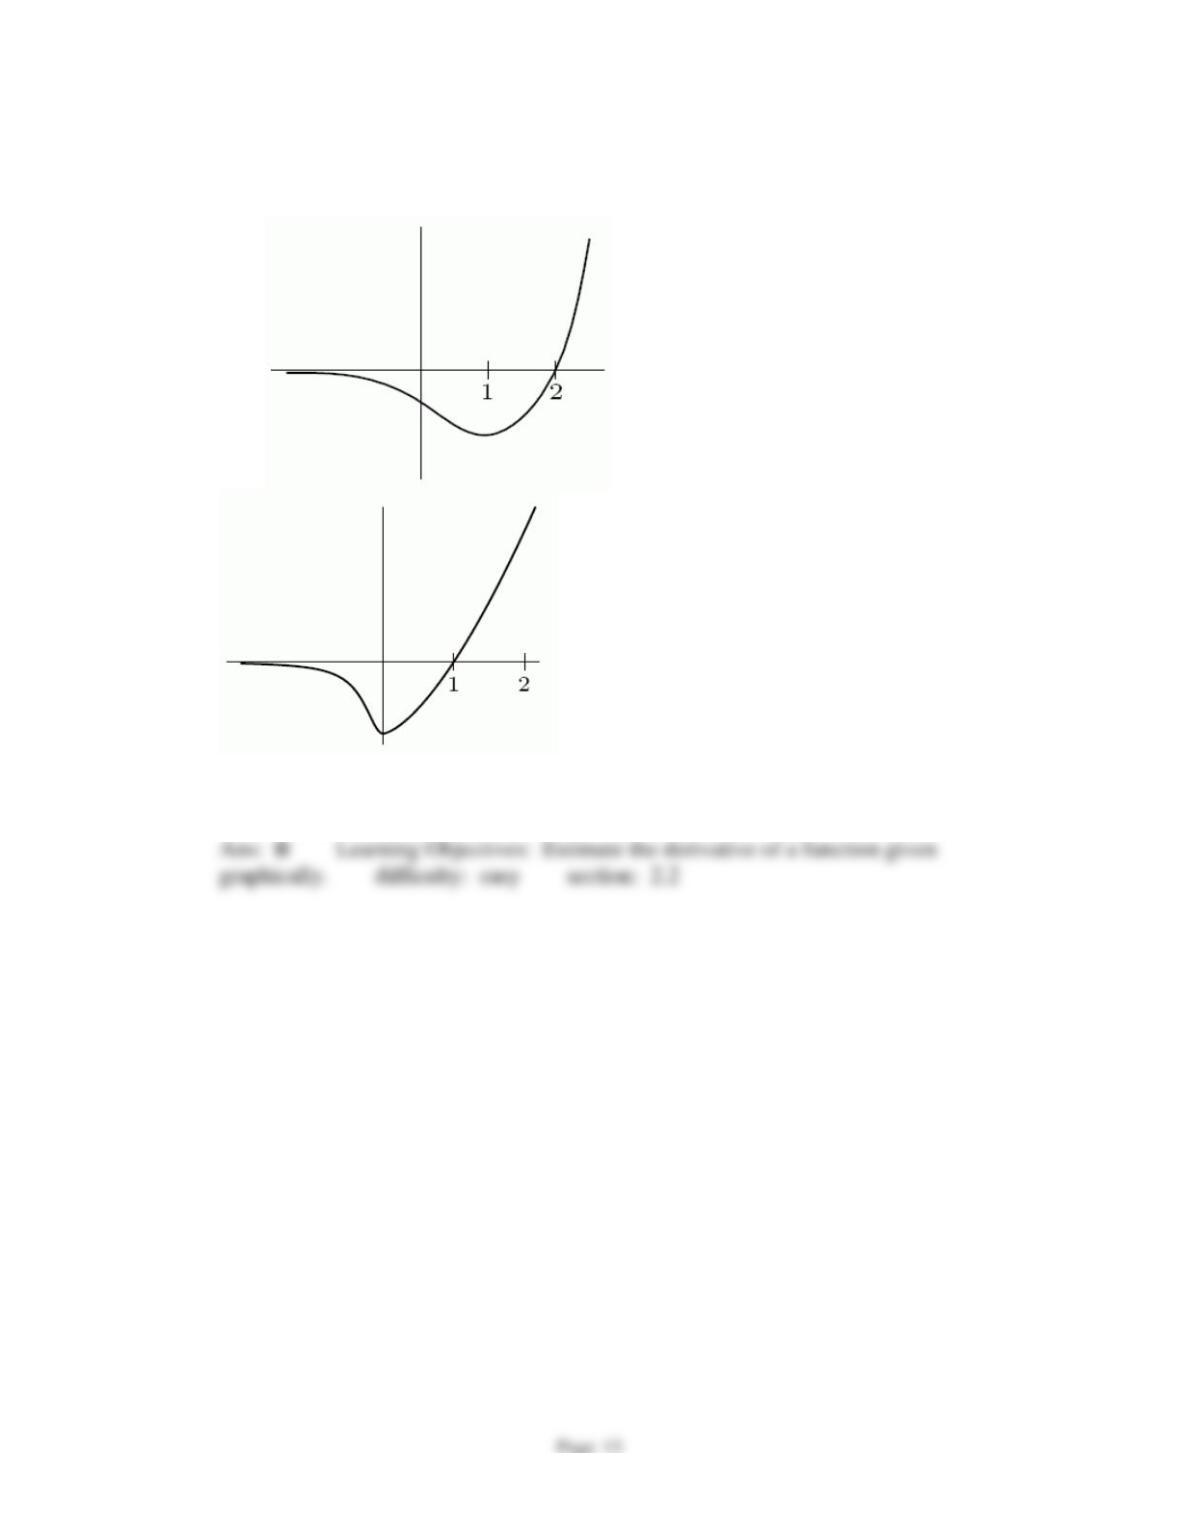
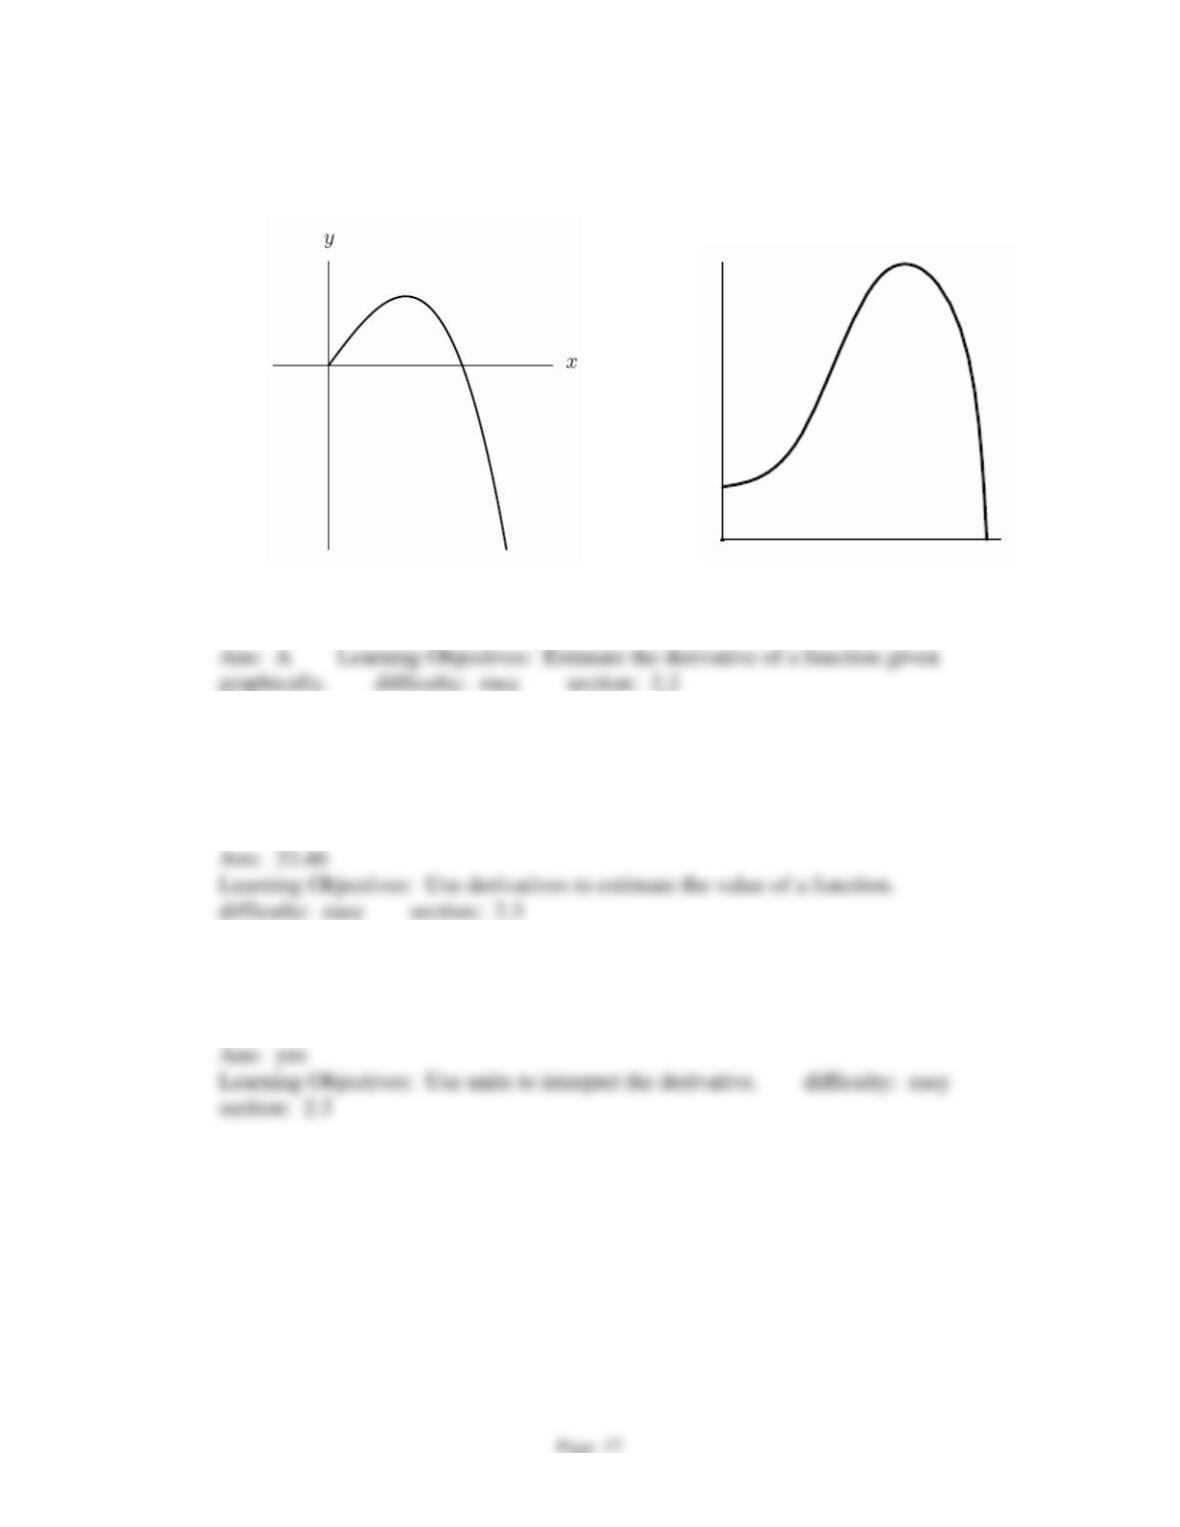
26.
Consider the two functions shown below.
A. B.
A)
The function in graph A is the derivative of the function in graph B.
B)
The function in graph B is the derivative of the function in graph A.
C)
Neither function is the derivative of the other.
graphically. difficulty: easy section: 2.2
Chapter 2
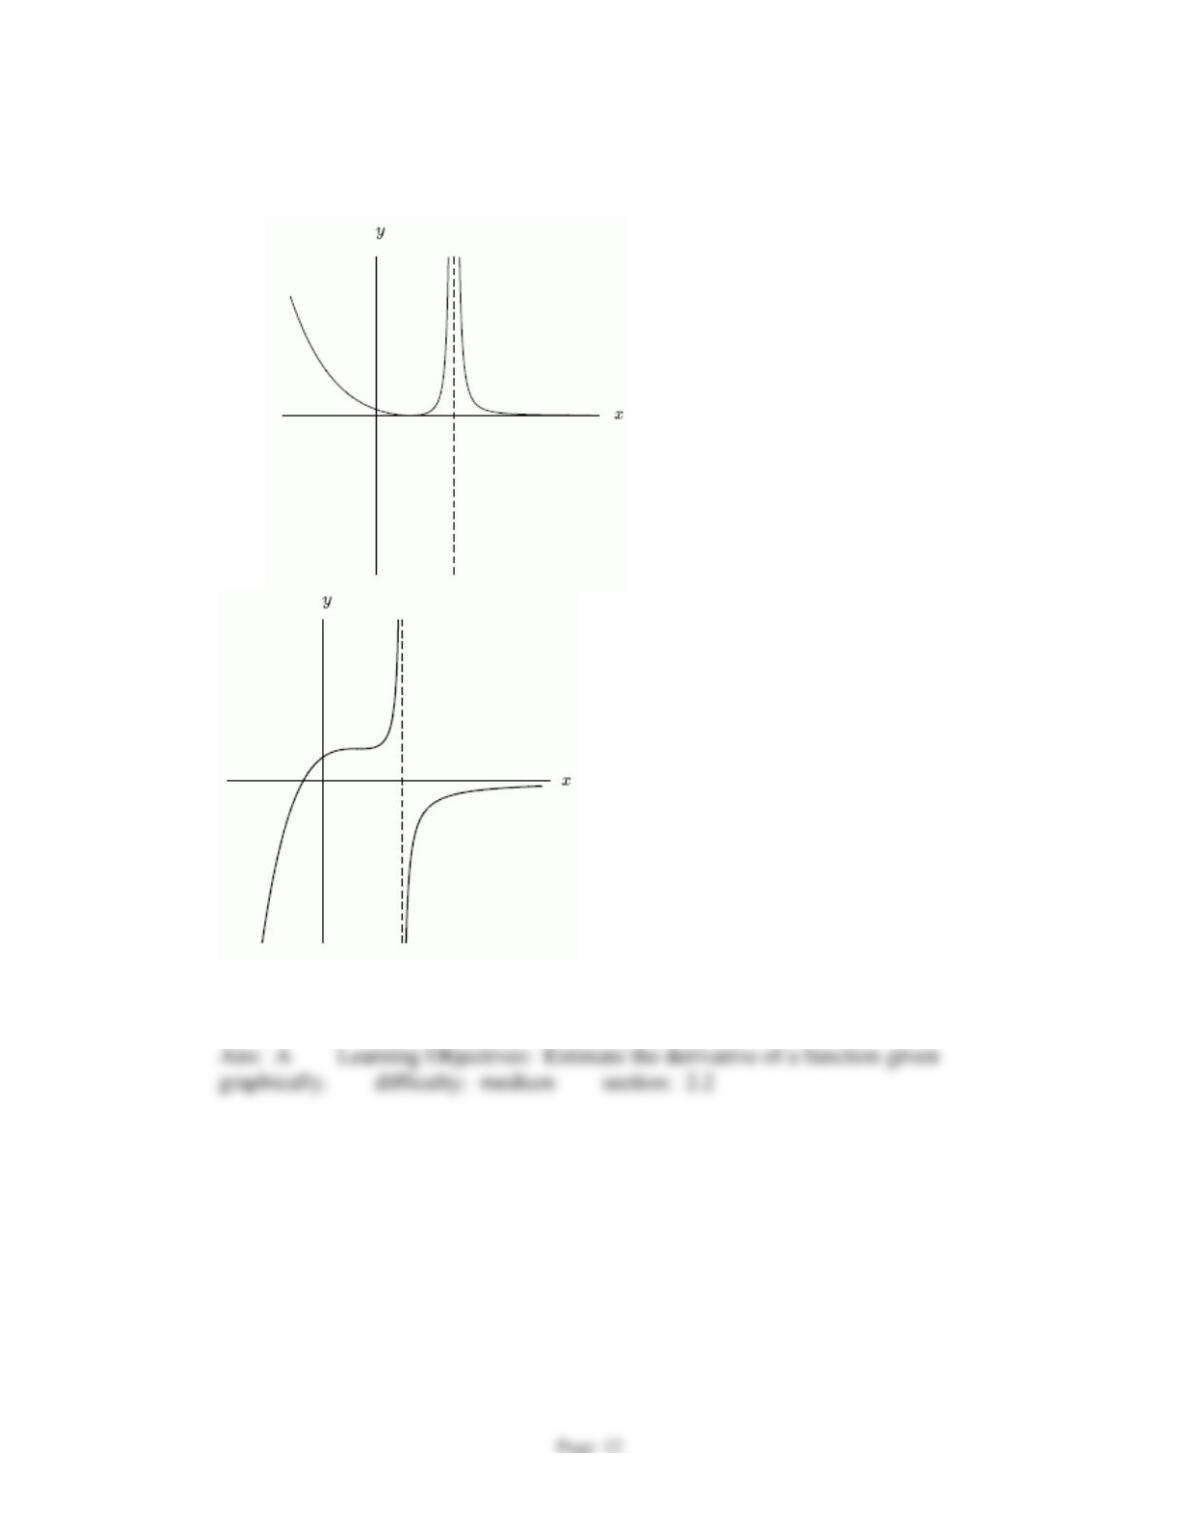
27.
Consider the two functions shown below.
A. B.
A)
The function in graph A is the derivative of the function in graph B.
B)
The function in graph B is the derivative of the function in graph A.
C)
Neither function is the derivative of the other.
graphically. difficulty: medium section: 2.2
Chapter 2
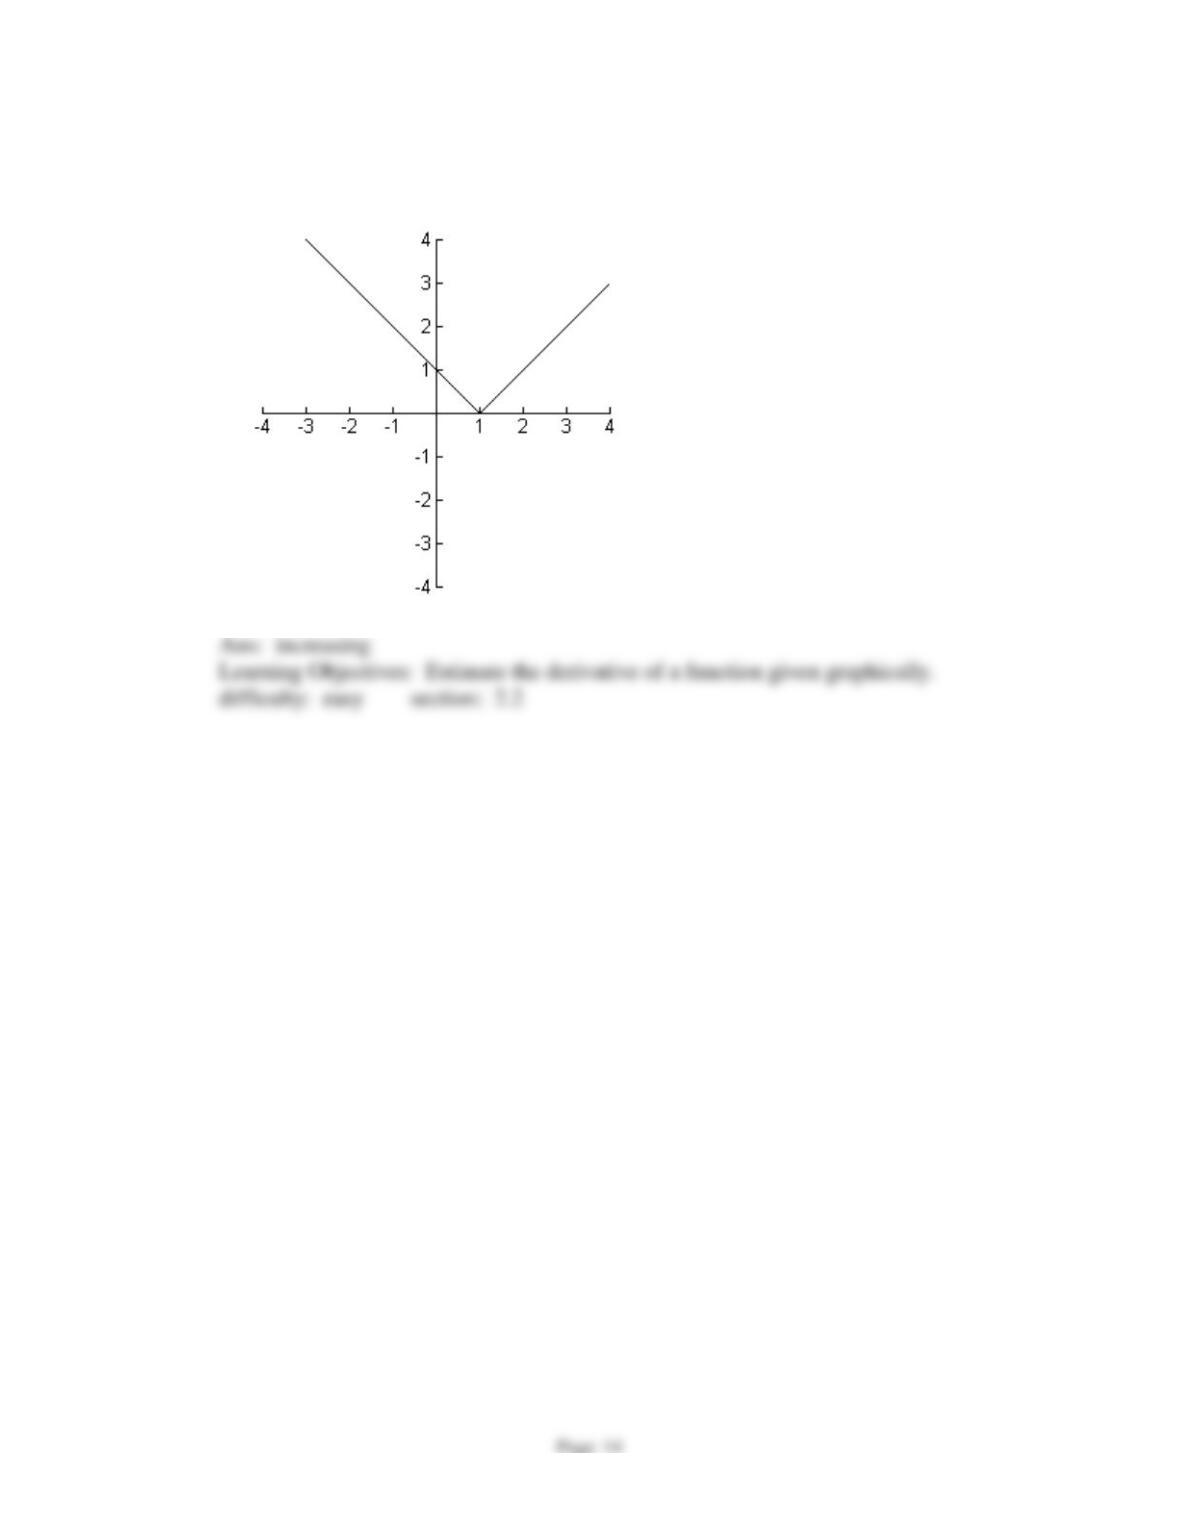
28.
Consider the two functions shown below.
A. B.
A)
The function in graph A is the derivative of the function in graph B.
B)
The function in graph B is the derivative of the function in graph A.
C)
Neither function is the derivative of the other.
graphically. difficulty: easy section: 2.2
Chapter 2
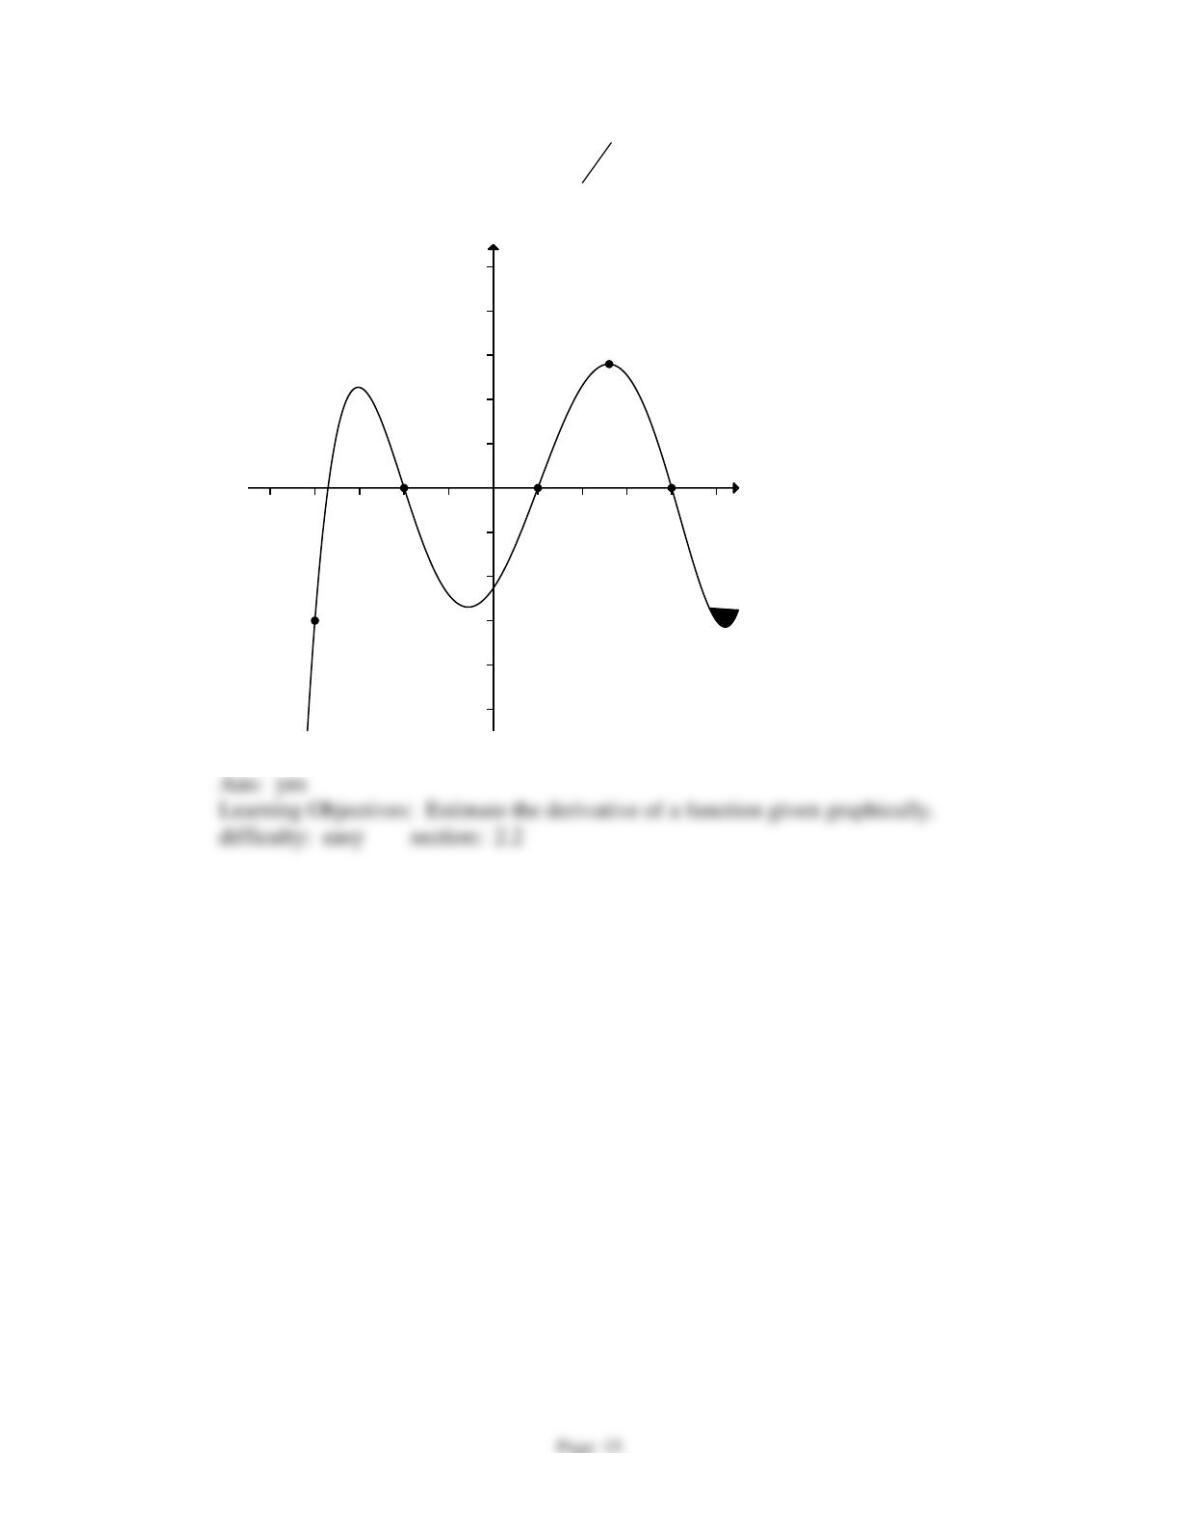
29.
The graph below is the graph of
()Mx
, the derivative of
()Mx
. At 2 is the original
function M(x) increasing, decreasing, constant or undefined?
Chapter 2
30.
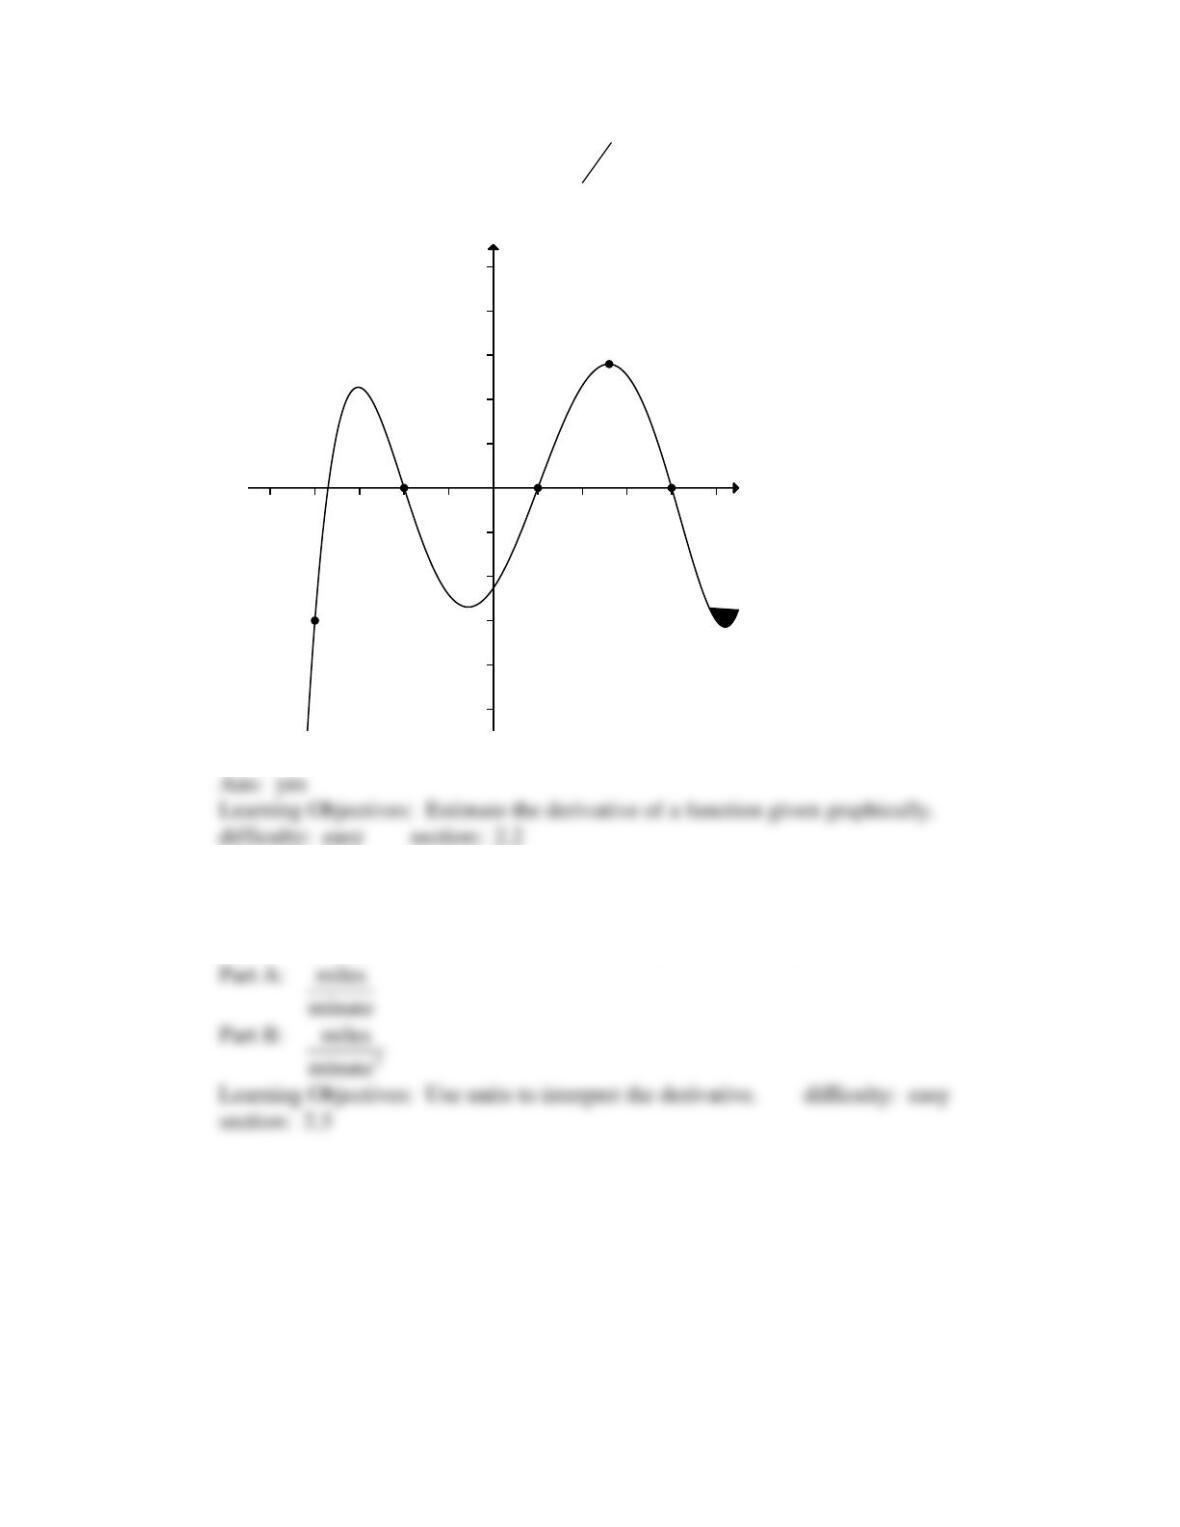
Using the graph of
()fx
, at x=C is
dy
dx
positive ?
B C E
A
D
-5
-4
-3
-2
-1
1
2
3
4
5
-5 -4 -3 -2 -1 1 2 3 4 5
x
y
Chapter 2
Page 16
31.
Using the graph of
()fx
, at x=B is
dy
dx
positive ?
32.
The distance that a bird flies is measured by y miles for x minutes, and is given by the
function
()y f x=
. What are the units of A)
‘(10)f
and B)
(10)f
?
B C E
A
D
-5
-4
-3
-2
-1
1
2
3
4
5
-5 -4 -3 -2 -1 1 2 3 4 5
x
y
Chapter 2
33.
Consider the two functions shown below.
A. B.
A)
The function in graph A is the derivative of the function in graph B.
B)
The function in graph B is the derivative of the function in graph A.
C)
Neither function is the derivative of the other.
graphically. difficulty: easy section: 2.2
34.
Let
()gv
be the fuel efficiency of a car moving at v miles per hour. with efficiency
measured in miles per gallon. Suppose
(55) 34g=
and
‘(55) –0.54g=
. What would
you expect
(56)g
to be?
Ans:
33.46
difficulty: easy section: 2.3
35.
Suppose
()gt
is the height in inches of a person who is t years old. Is it reasonable
that
(30) 70g=
?
Ans:
yes
section: 2.3
Chapter 2
36.
Let
()th
be the temperature in degrees Celsius at a height h (in meters) above the
surface of the earth. Which of the following gives the rate of change of temperature
with respect to a height at 70 meters above the surface of the earth, in degrees per
meter?
A)
(70)t
B)
‘(70)t
C)
h such that
( ) 70th =
D)
h such that
‘( ) 70th=
difficulty: easy section: 2.3
37.
Suppose
()gt
is the height in inches of a person who is t years old. Would you expect
‘(45)g
to be
A)
greater than 0
B)
less than 0
C)
equal to 0
difficulty: medium section: 2.3
38.
Let
()fT
be the time, in minutes, that it takes for an oven to heat up to
T
F. What
are the units of
‘( )fT
?
A)
degrees per minute
B)
minutes per degree
difficulty: easy section: 2.3
39.
Let
()fT
be the time, in minutes, that it takes for an oven to heat up to
T
F. What is
the sign of
‘( )fT
?
A)
positive
B)
negative
difficulty: easy section: 2.3
Chapter 2
40.
Suppose that
()fT
is the cost to heat my house, in dollars per day, when the outside
temperature is
T
Fahrenheit. If
(23) 11.93f=
and
‘(23) –0.17f=
, approximately
what is the cost to heat my house when the temperature is
20 F
?
Ans:
$12.44
difficulty: medium section: 2.3
41.
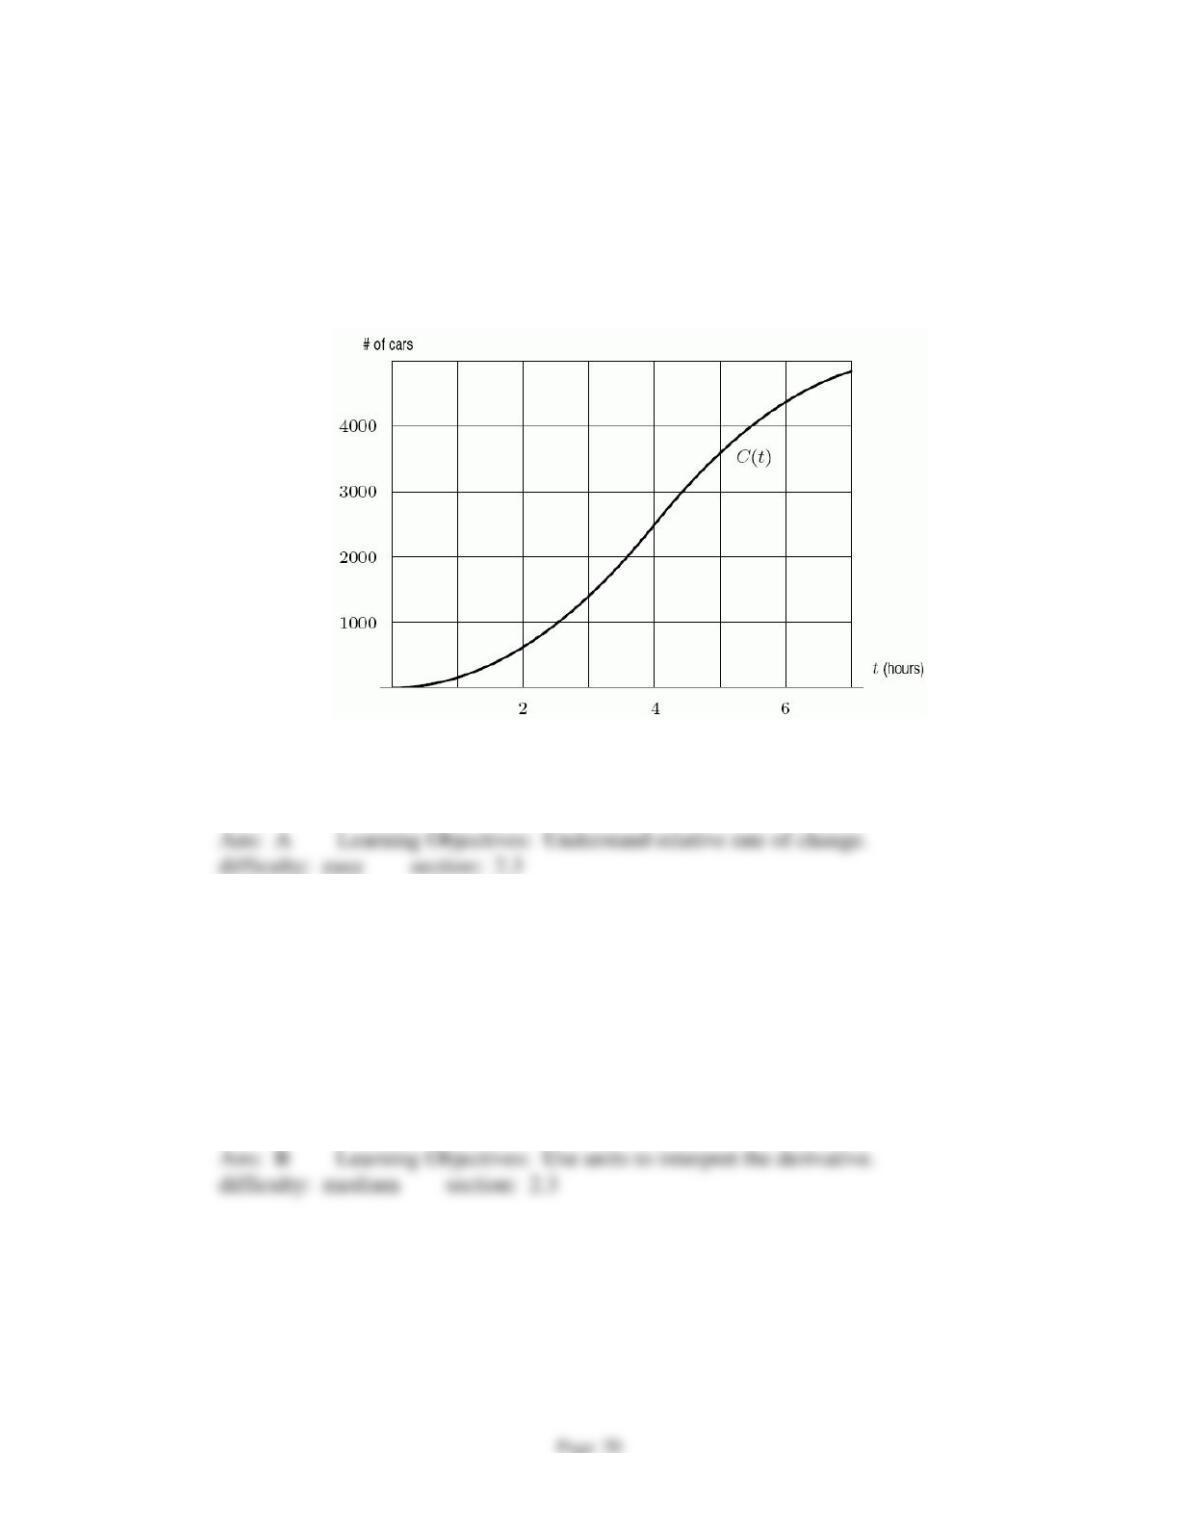
To study traffic flow along a major road, the city installs a device at the edge of the road
at 4:00 am. The device counts the cars driving past, and records the total periodically.
The resulting data is plotted on a graph, with time (in hours) on the horizontal axis and
the number of cars on the vertical axis. The graph is shown below. It is a graph of the
function
()Ct
= Total number of cars that have passed by after t hours. When is the
traffic flow the greatest?
A)
At t=6 hours.
B)
At t=3 hours.
C)
At t=4 hours.
D)
At t=5 hours.
difficulty: easy section: 2.3
Chapter 2
42.
To study traffic flow along a major road, the city installs a device at the edge of the road
at 4:00 am. The device counts the cars driving past, and records the total periodically.
The resulting data is plotted on a graph, with time (in hours) on the horizontal axis and
the number of cars on the vertical axis. The graph is shown below. It is a graph of the
function
()Ct
= Total number of cars that have passed by after t hours. Estimate
‘(3)C
.
A)
1000
B)
1300
C)
1600
D)
1900
Ans: A Learning Objectives: Understand relative rate of change.
difficulty: easy section: 2.3
43.
Let
()Lr
be the amount of lumber, in board-feet, produced from a tree of radius r
(measured in inches). Which of the following gives the rate of change in the amount of
lumber, in board-feet per inch, with respect to the radius when the radius is 21 inches?
A)
(21)L
B)
‘(21)L
C)
r such that
( ) 21Lr =
D)
r such that
‘( ) 21Lr=
Ans: B Learning Objectives: Use units to interpret the derivative.
difficulty: medium section: 2.3