Chapter 02 Test Bank KEY
1. In the context of the basic work-leisure model, “work” is defined as
2. In the context of the basic work-leisure model, “leisure” time includes
3. The slope of an indifference curve at any point reflects the
4. Indifference curves are convex to the origin because
5. The convex shape of a standard indifference curve reflects
6. On an indifference map reflecting the tradeoff between income and leisure, higher levels of utility are achieved by
moving
7. For income and leisure time, a higher level of utility is achieved by moving to the _____ on an indifference
_____.
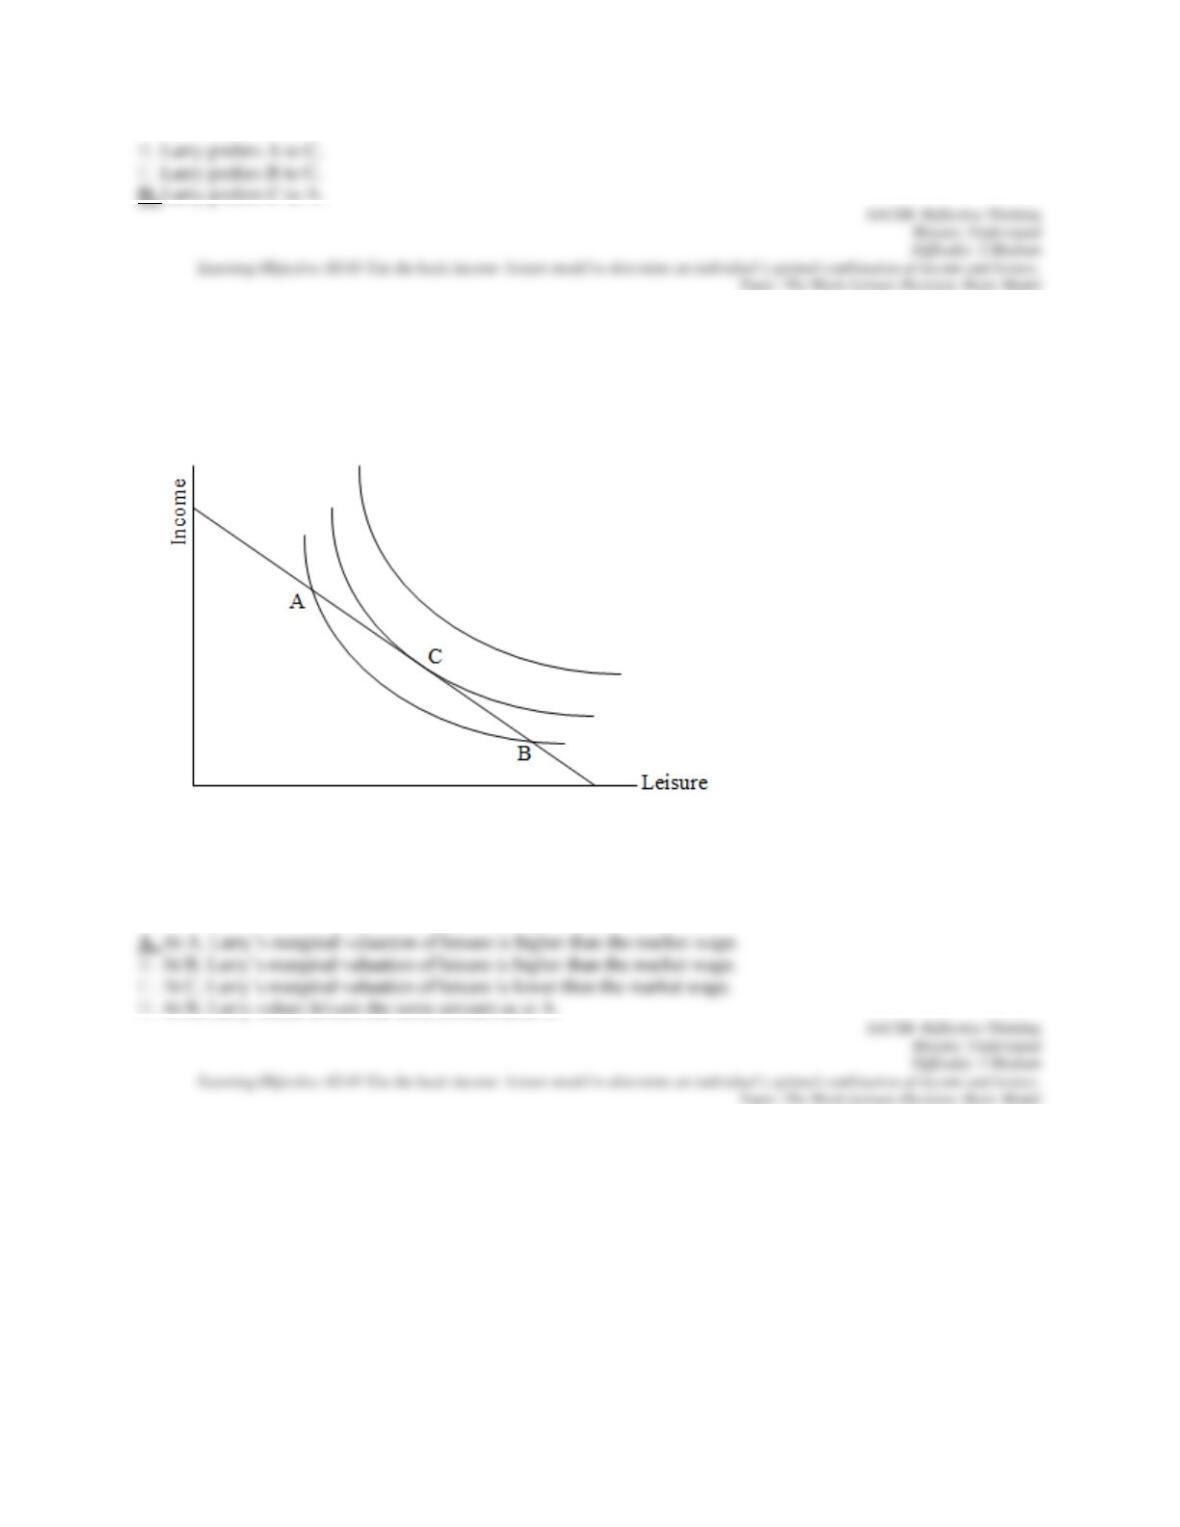
8. Refer to the following diagram representing Larry’s budget constraint and preferences.
Consider the three combinations of leisure and income represented by points A, B, and C. Which of the following is
a correct statement?
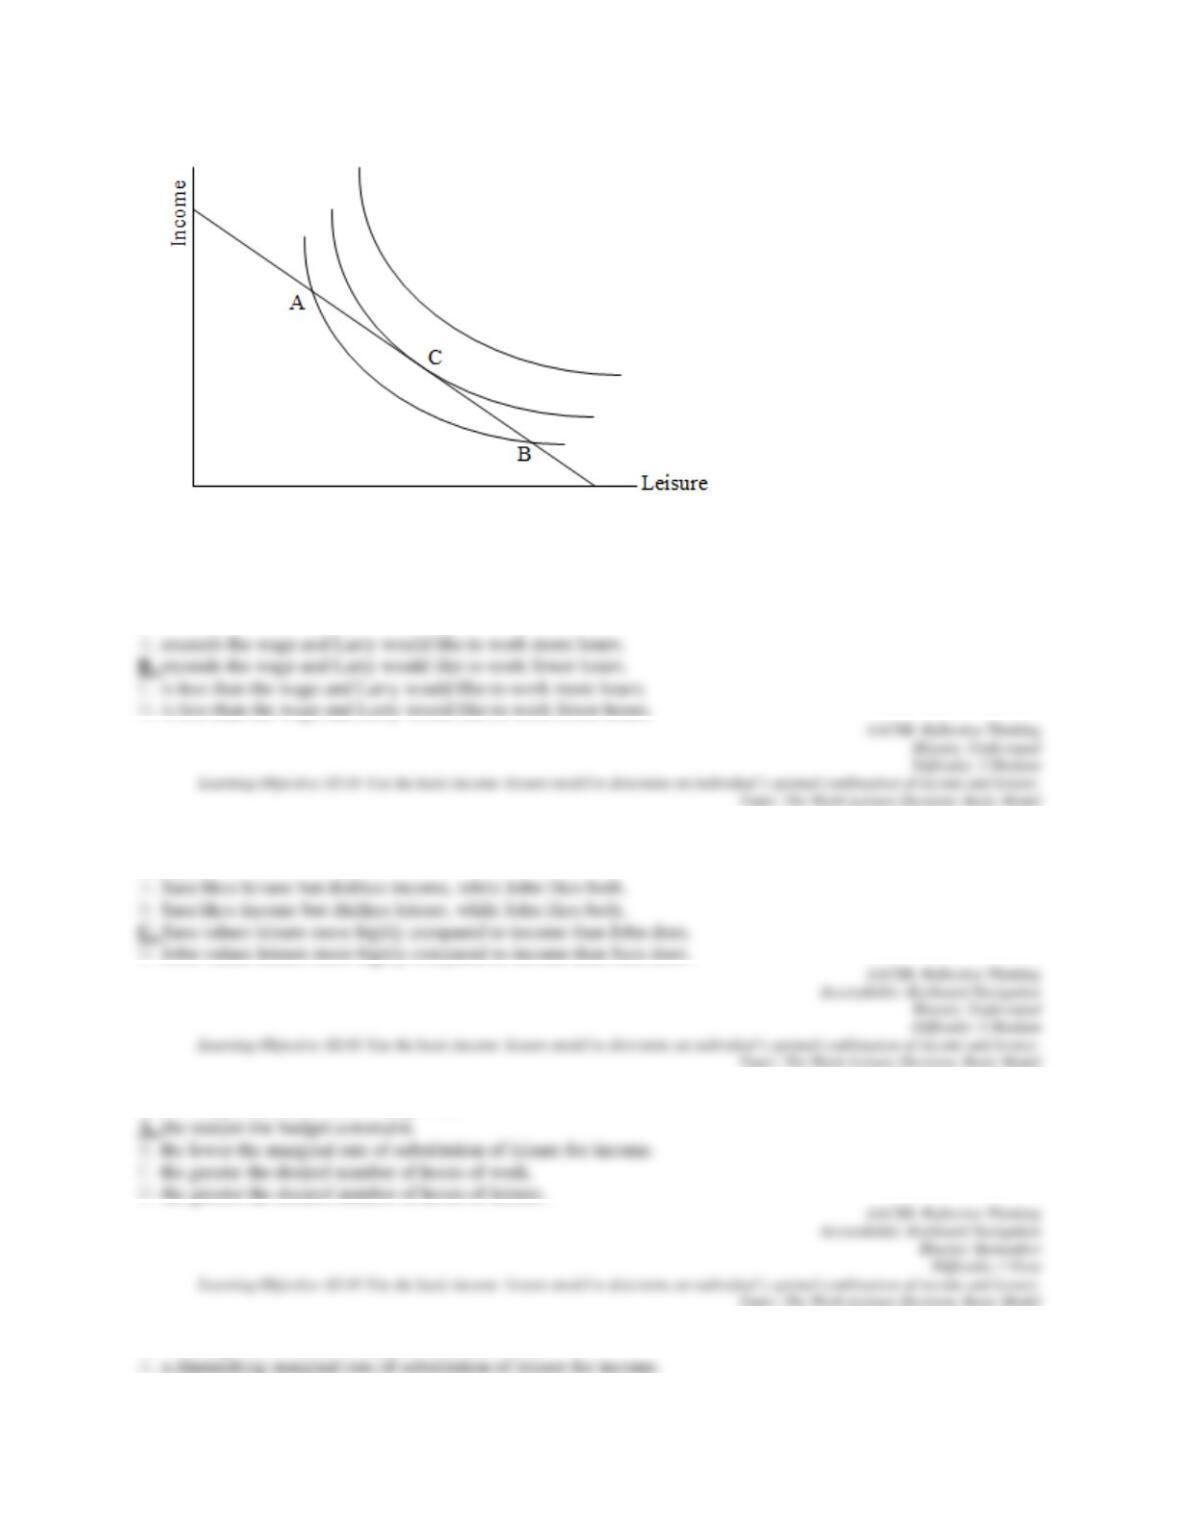
9. Refer to the following diagram representing Larry’s budget constraint and preferences.
Which of the following is a correct statement?
10. Refer to the following diagram representing Larry’s budget constraint and preferences.
At point A, Larry’s marginal rate of substitution of leisure for income
11. On a standard income-leisure diagram, Sara has steeper indifference curves than John. This likely reflects the
fact that
12. The higher the individual’s wage rate,
13. The slope of a standard budget constraint reflects

14. In an income-leisure diagram, the wage rate is graphically represented by the
15. The optimal work-leisure position is achieved where
16. An individual whose MRS L,Y exceeds the wage at her current combination of leisure and income could increase
utility by
17. Refer to the following diagram.
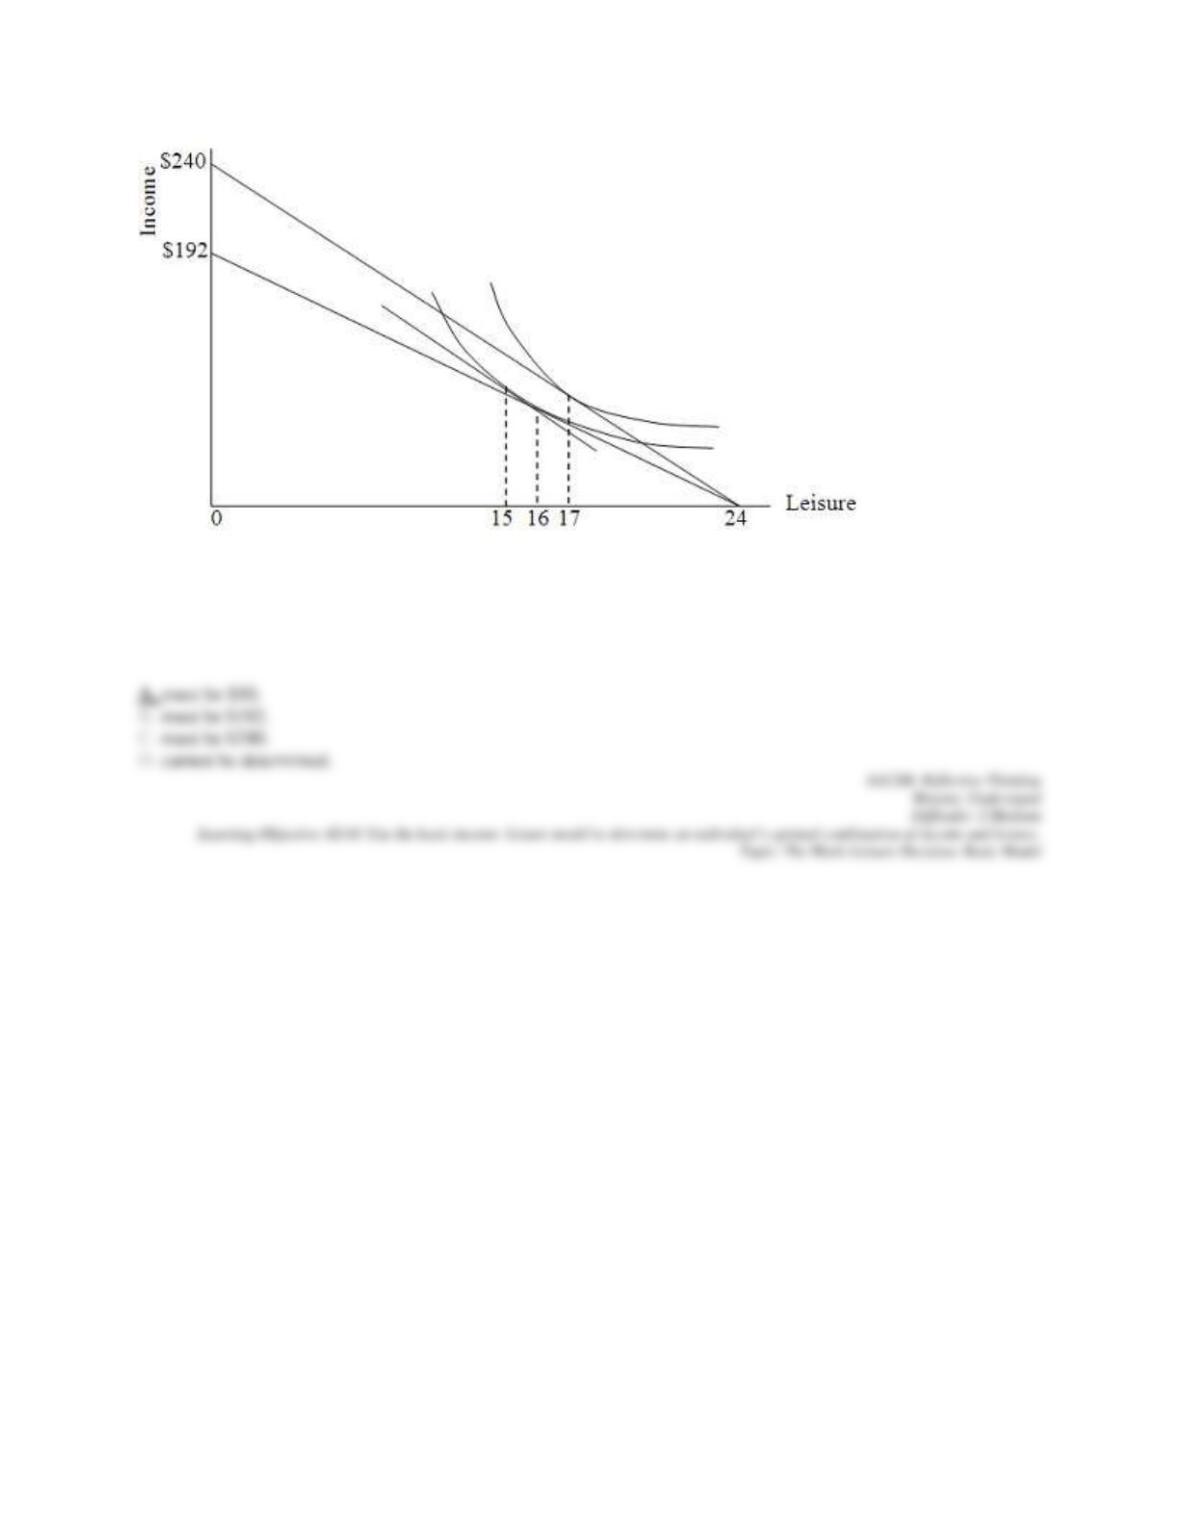
Considering the two budget lines in the diagram, if the person’s optimal number of hours worked is seven hours,
then the wage rate
18. Refer to the following diagram.
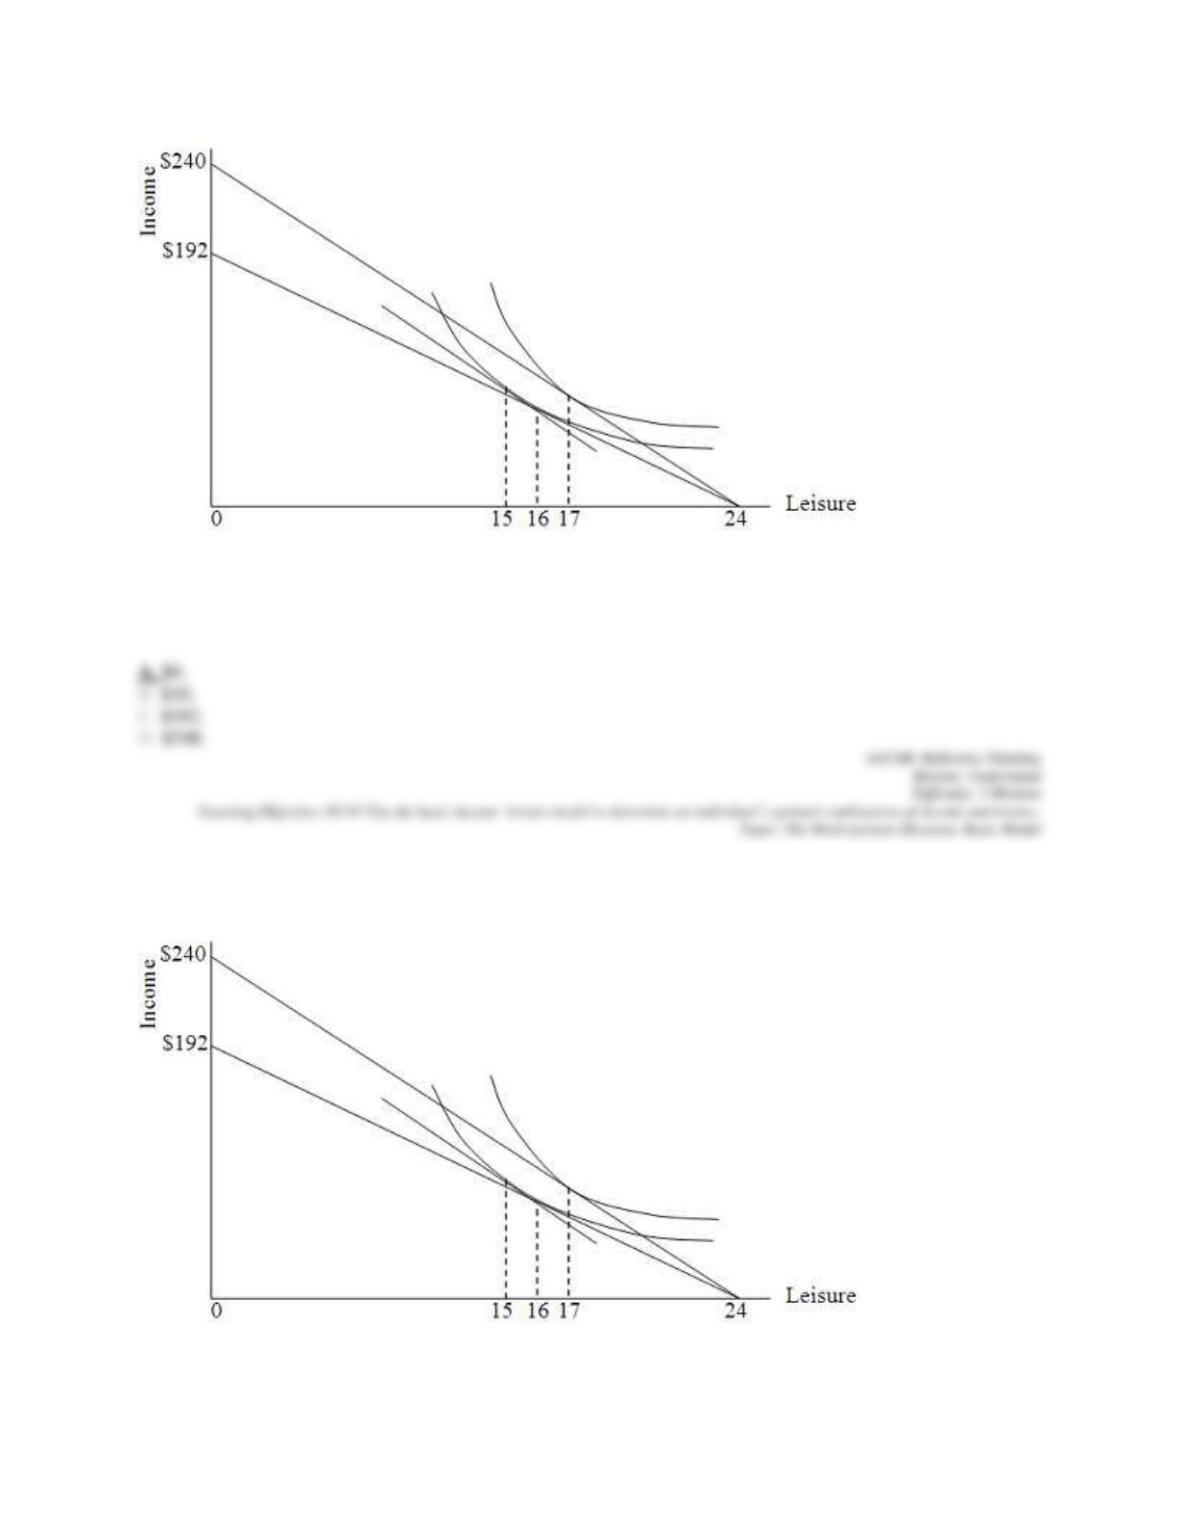
The person has nonwage income of
19. Refer to the following diagram.
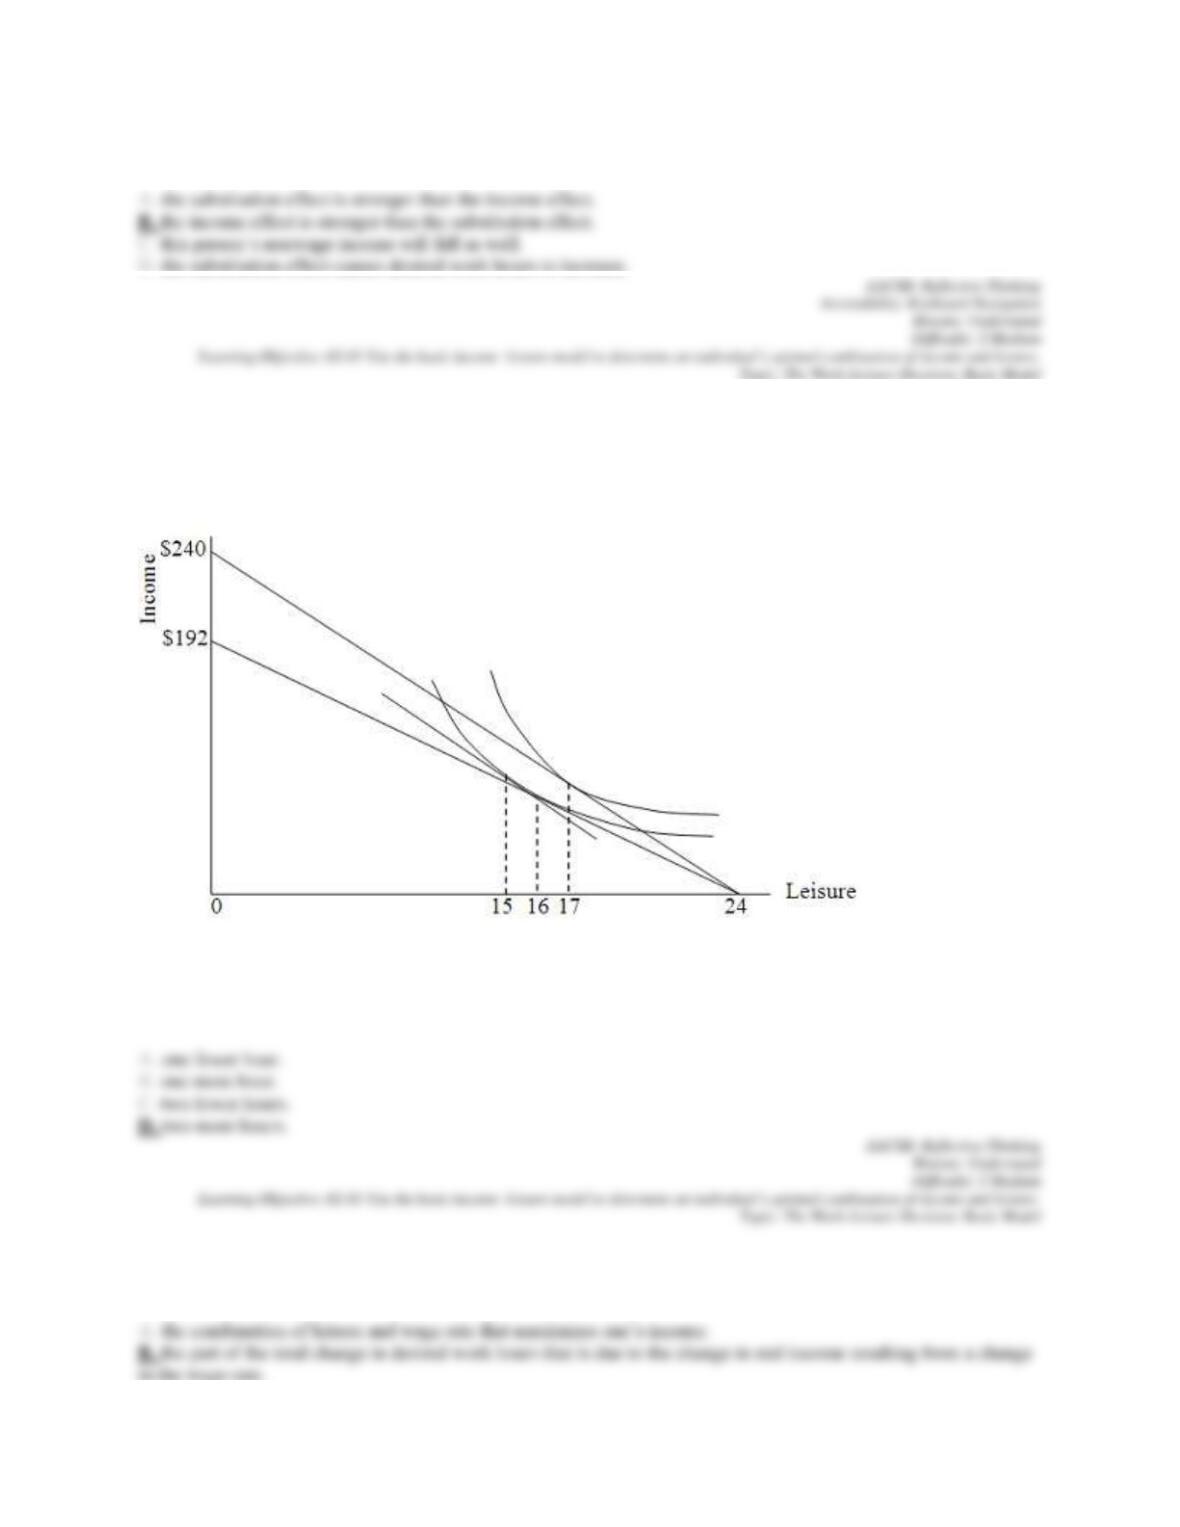
If this person’s wage rate falls as illustrated in the diagram, then
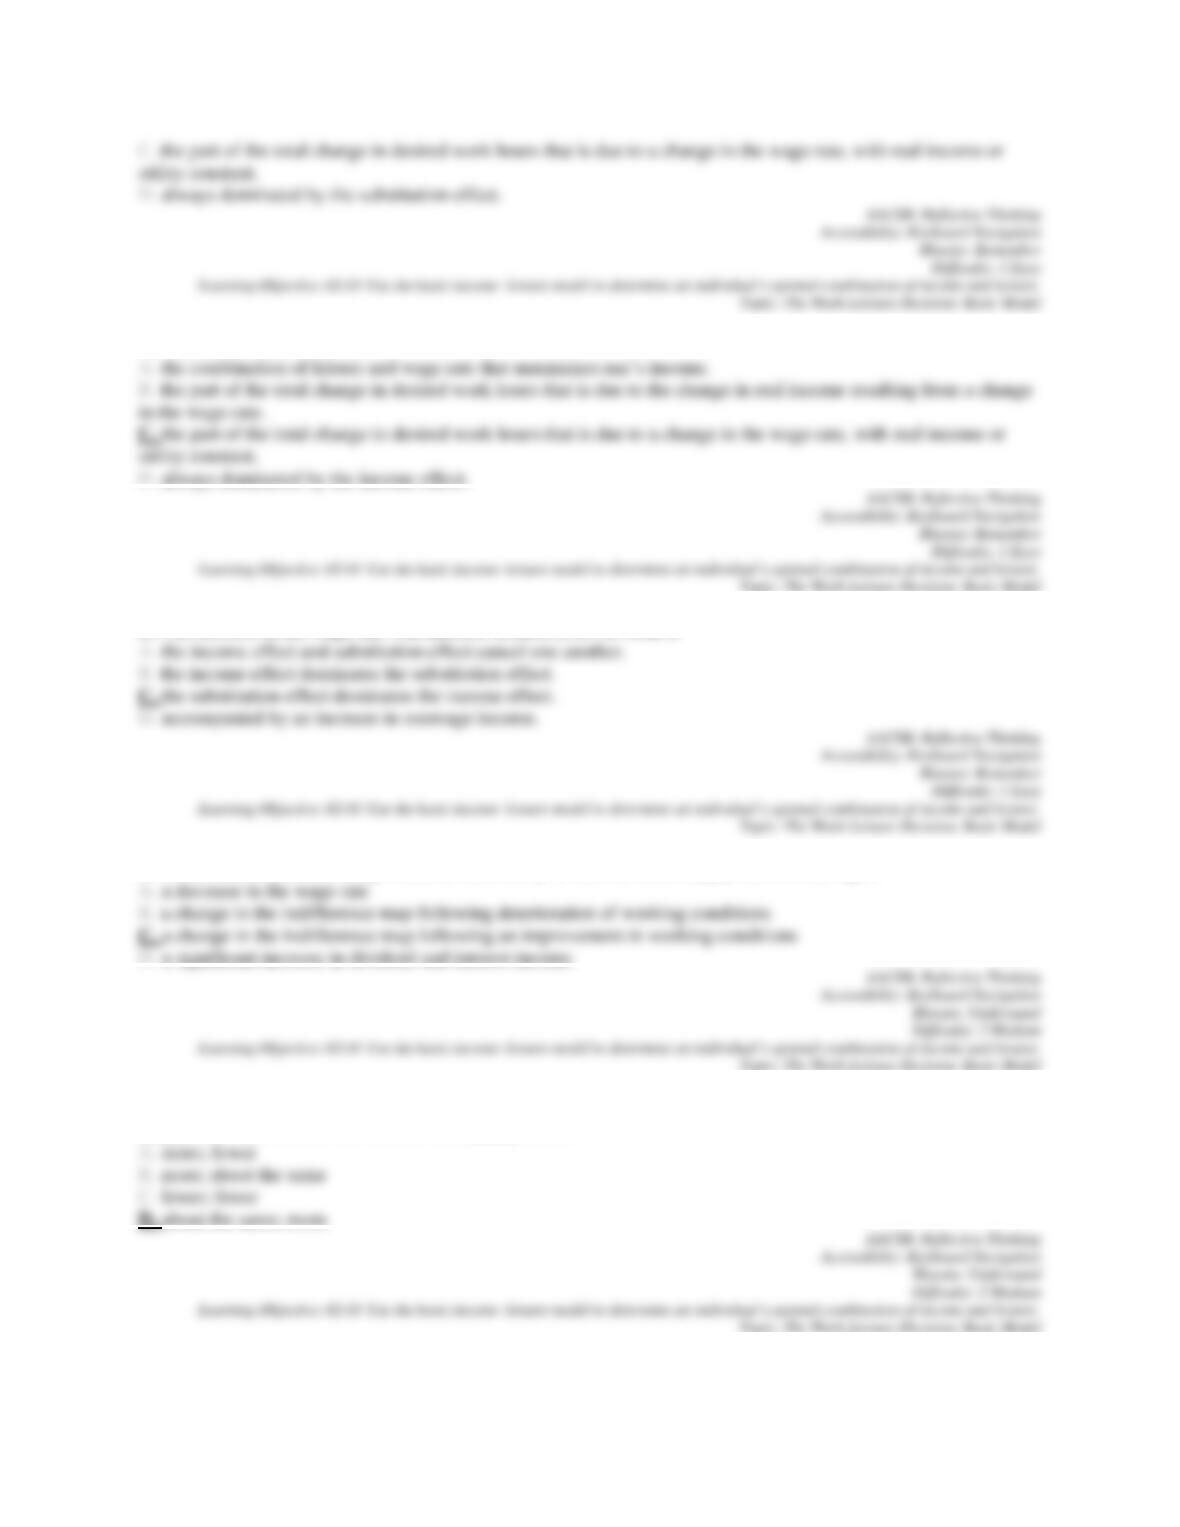
20. Refer to the following diagram.
The income effect of the illustrated wage decrease causes this individual to work
21. The income effect is
22. The substitution effect is
23. An increase in the wage rate will increase desired hours of work if
24. Which one of the following would be most likely to shift the labor supply curve to the right?
25. Consider the impact of a general increase in real wages. Empirical evidence suggests that men will tend to work
_____ hours and women will tend to work _____ hours.
26. Which of the following would unambiguously predict a decrease in desired hours of work?
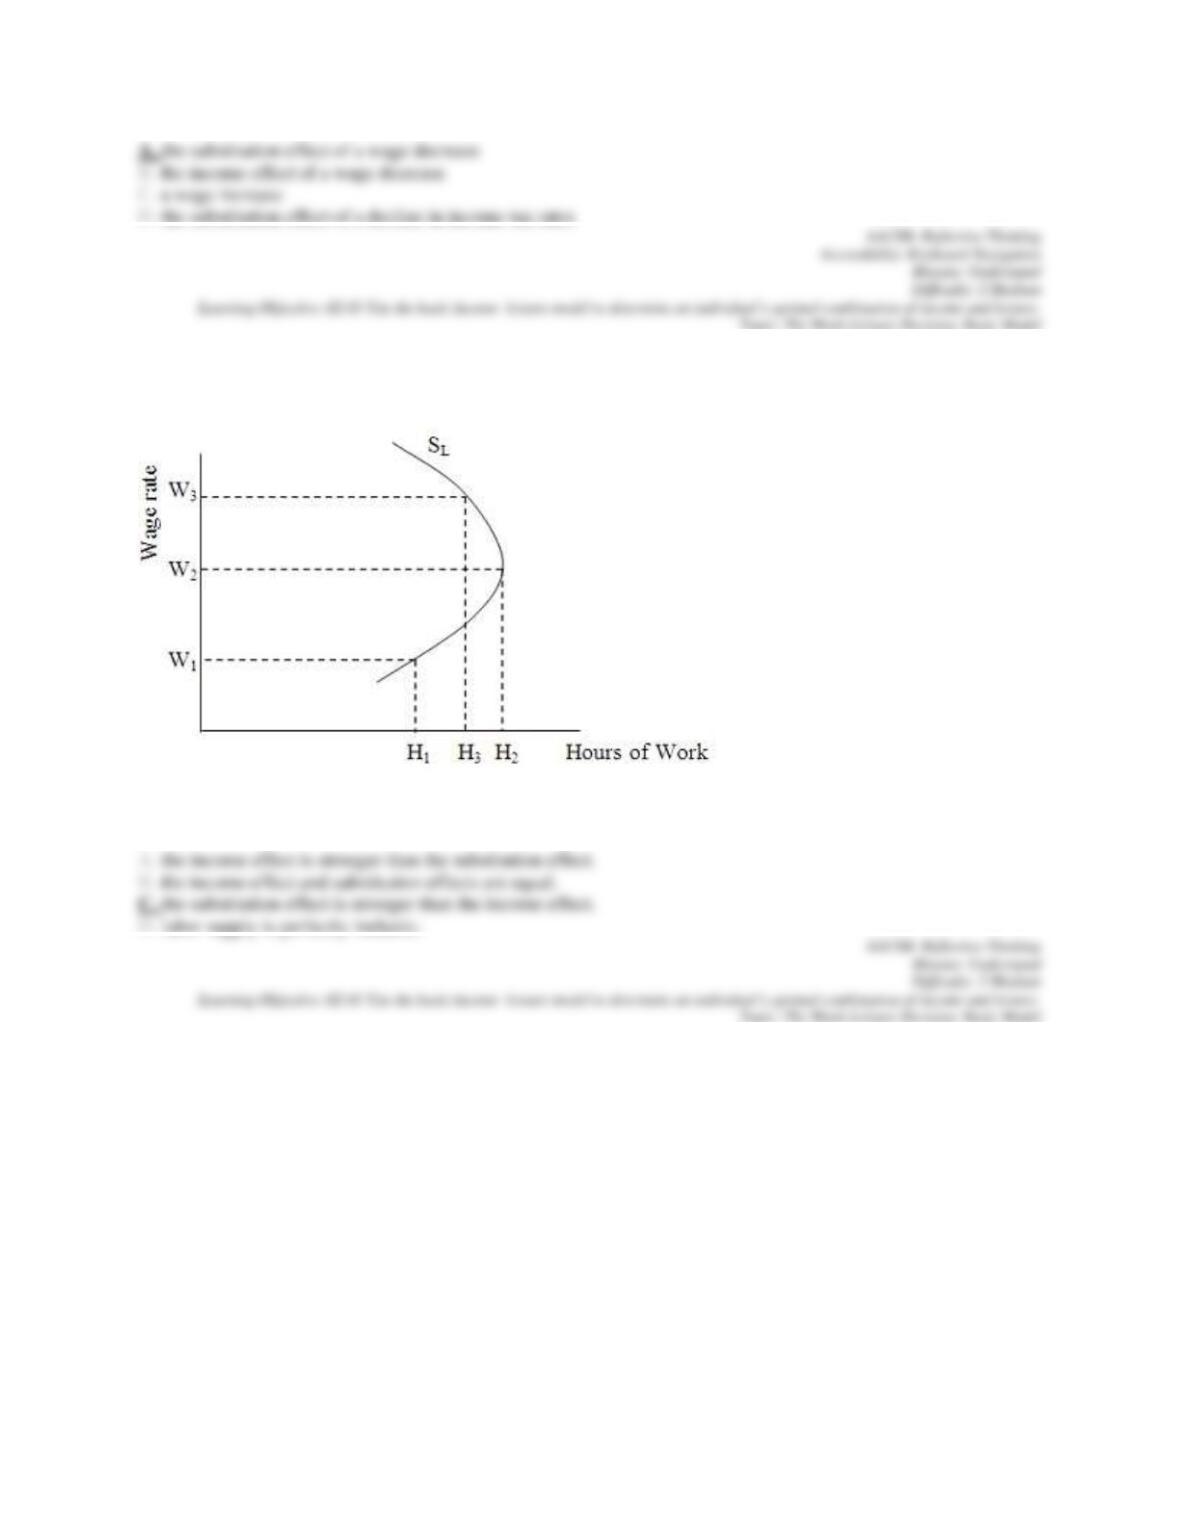
27. Refer to the following diagram, which shows a labor supply curve for an individual.
If the wage rises from W1 to W2, we may conclude that
28. Refer to the following diagram, which shows a labor supply curve for an individual.
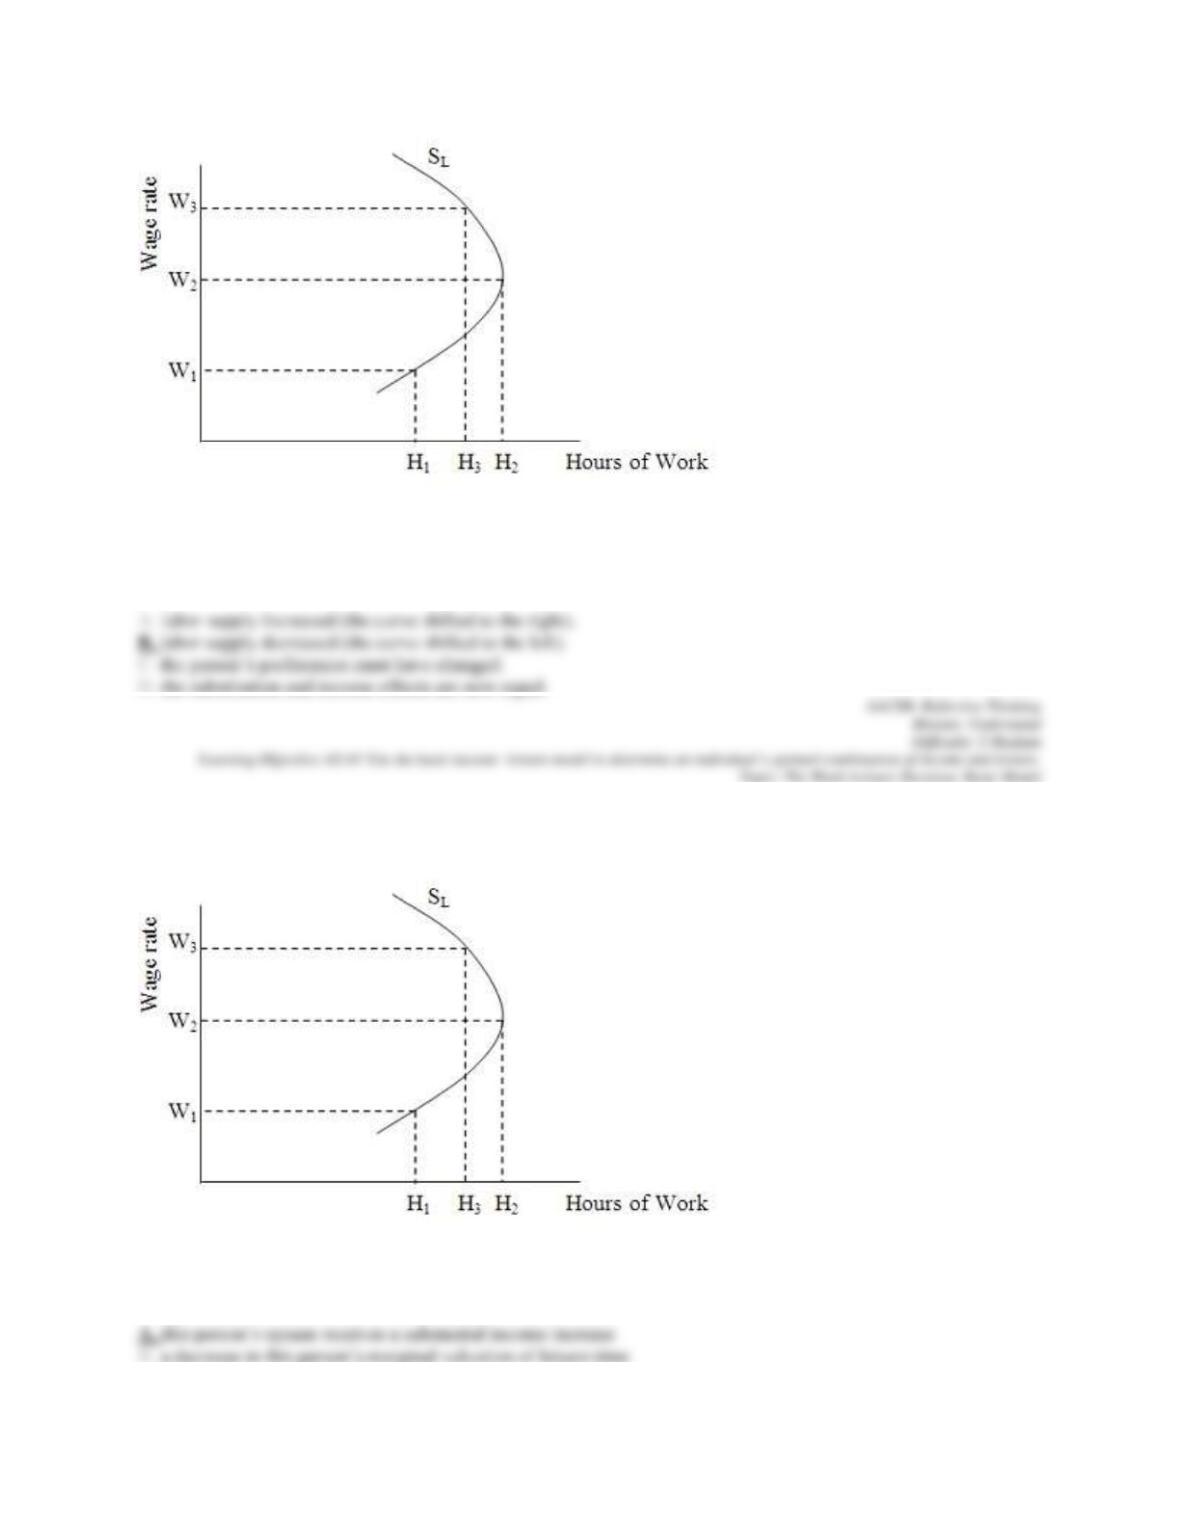
If this person were now willing to supply only H1 hours of work at W3, we could conclude that
29. Refer to the following diagram, which shows a labor supply curve for an individual.
Of the following, which one would most likely cause this person to supply H1 hours of work at W3 rather than the
current H3 hours?