a.
Z to W.
c.
W to X.
b.
W to Y.
d.
X to Y.
102. Movement along this production possibilities curve shown in Exhibit 2-9 indicates:
a.
that labor is not equally productive or homogeneous (nonhomogeneous).
b.
decreasing opportunity costs.
c.
all inputs are homogeneous.
d.
all of these.
Exhibit 2-10 Production possibilities curve data
A
B
C
D
E
Capital goods
0
1
2
3
4
Consumption goods
25
23
19
13
0
103. Suppose an economy is faced with the production possibilities table shown in Exhibit 2-10. If this
economy chooses the combination of goods at point A,
a.
only capital goods are being produced.
b.
every resource in the economy is utilized in the production of capital goods.
c.
no capital goods are being used as factors of production.
d.
every resource in the economy is being used in the production of consumption goods.
e.
no consumption goods are being produced.
104. Suppose an economy is faced with the production possibilities table shown in Exhibit 2-10. The first
unit of capital goods will cost the economy ____ units of consumption goods.
a.
25
b.
2
c.
1
d.
23
e.
11
105. Suppose an economy is faced with the production possibilities table shown in Exhibit 2-10. As
additional units of capital goods are being produced, the number of consumption goods produced must
____, because ____.
a.
increase; the production possibility table shows only the maximum efficiency points
b.
increase; of the law of increasing costs
c.
decrease; of the law of increasing costs
d.
decrease; of the finite nature of the resource base
e.
increase; capital goods will assist in the production of consumer goods
106. Suppose an economy is faced with the production possibilities table shown in Exhibit 2-10. The
second unit of capital goods production will cost ____ units of consumption goods, and the third unit
of capital goods production will cost ____ units of consumption goods.
a.
4; 6
b.
25; 23
c.
23; 19
d.
1; 23
e.
2; 19
107. Suppose an economy is faced with the production possibilities table shown in Exhibit 2-10. As
additional units of capital goods are produced, the opportunity cost in terms of sacrificed units of
consumption goods ____ because of ____.
a.
decreases; greater efficiency in production
b.
increases; decreasing opportunity cost
c.
increases; the law of increasing costs
d.
increases; greater efficiency in production
e.
decreases; the law of increasing costs
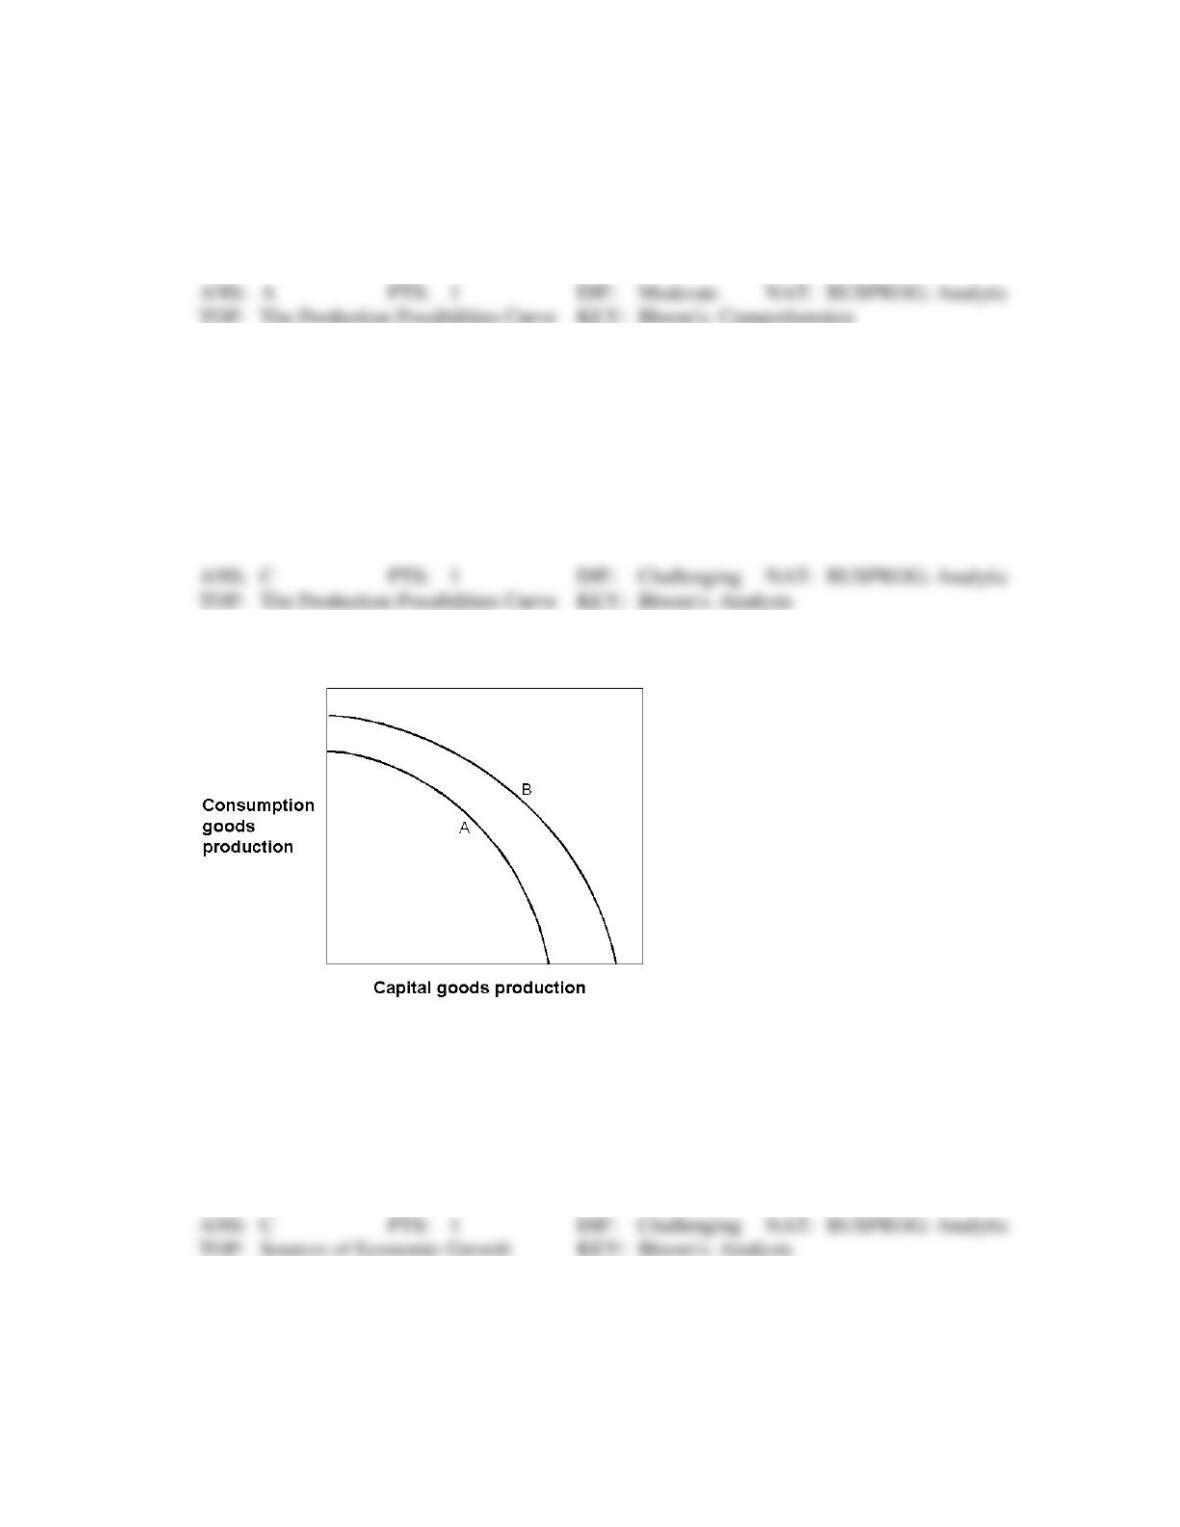
Exhibit 2-11 Production possibilities curves
108. In Exhibit 2-11, which of the following could have caused the production possibilities curve of an
economy to shift from the one labeled A to the one labeled B?
a.
A major natural disaster
b.
An increase in consumption goods production this year
c.
An advance in technology
d.
An increase in unemployment
e.
A decrease in consumption goods production this year
109. In Exhibit 2-11, which of the following could have caused the production possibilities curve to shift
from the one labeled B to the one labeled A?
a.
A major natural disaster.
b.
An increase in resources.
c.
An advance in technology.
d.
A decrease in unemployment.
e.
An improvement in literacy.
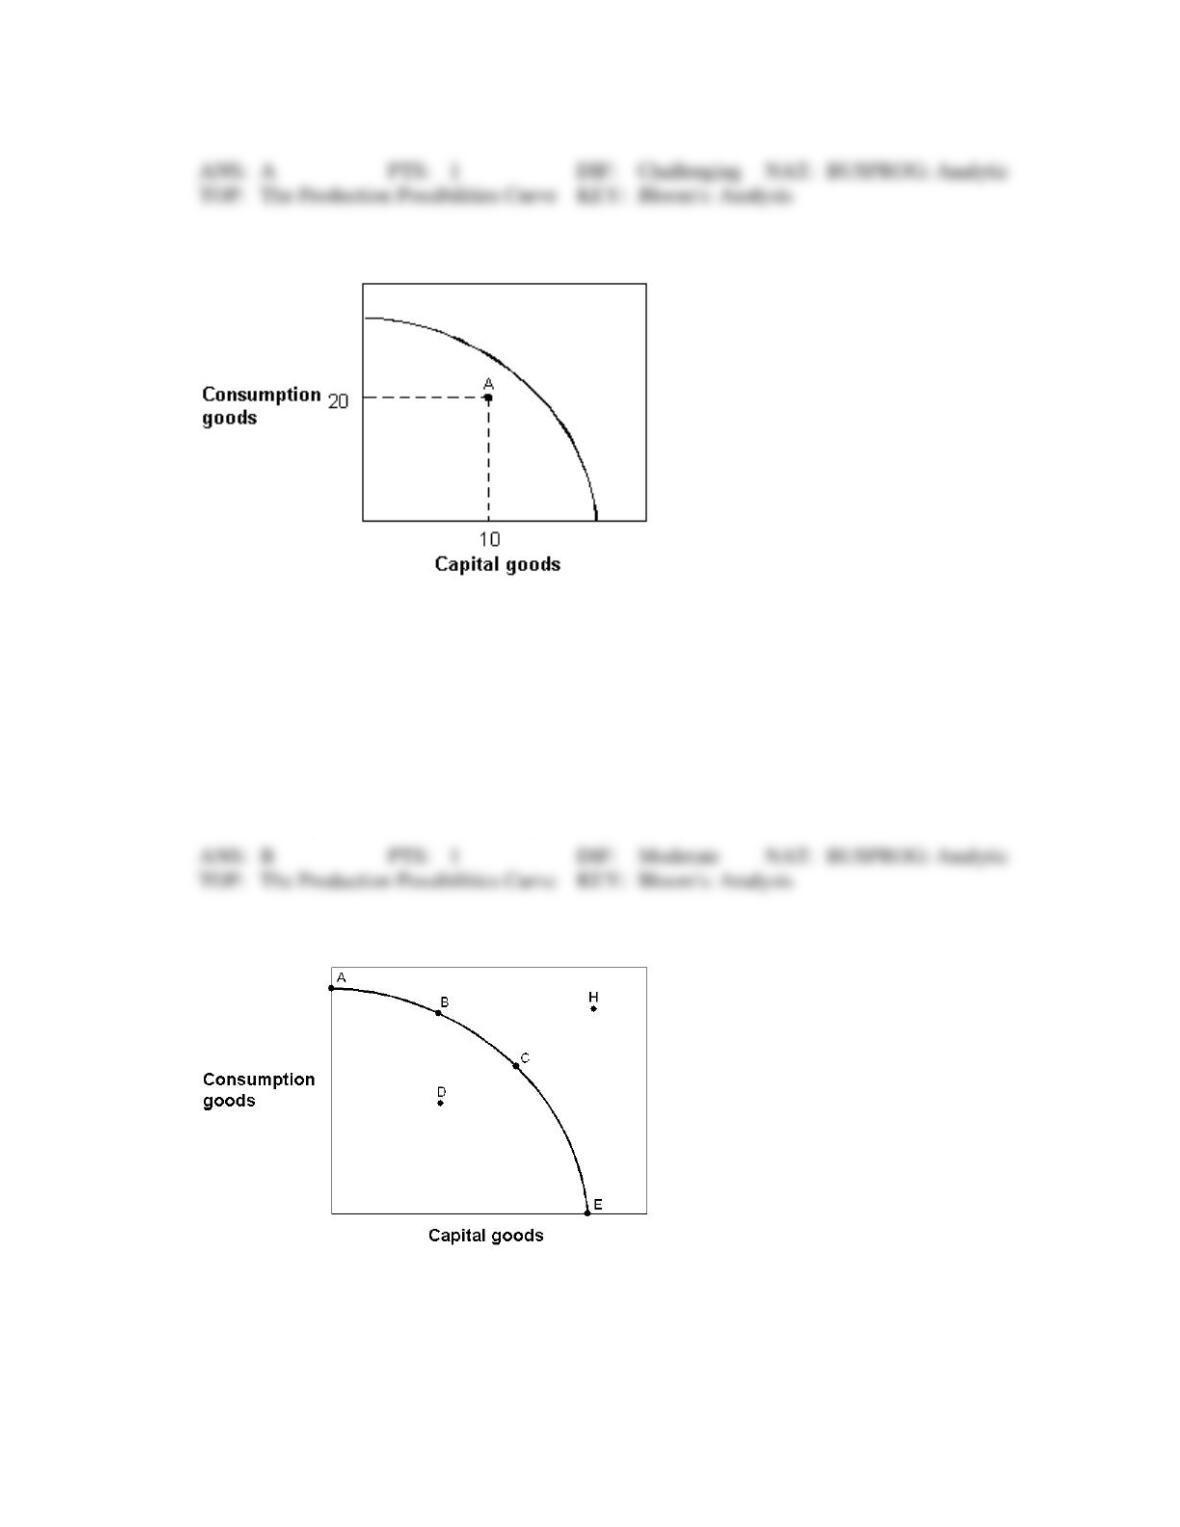
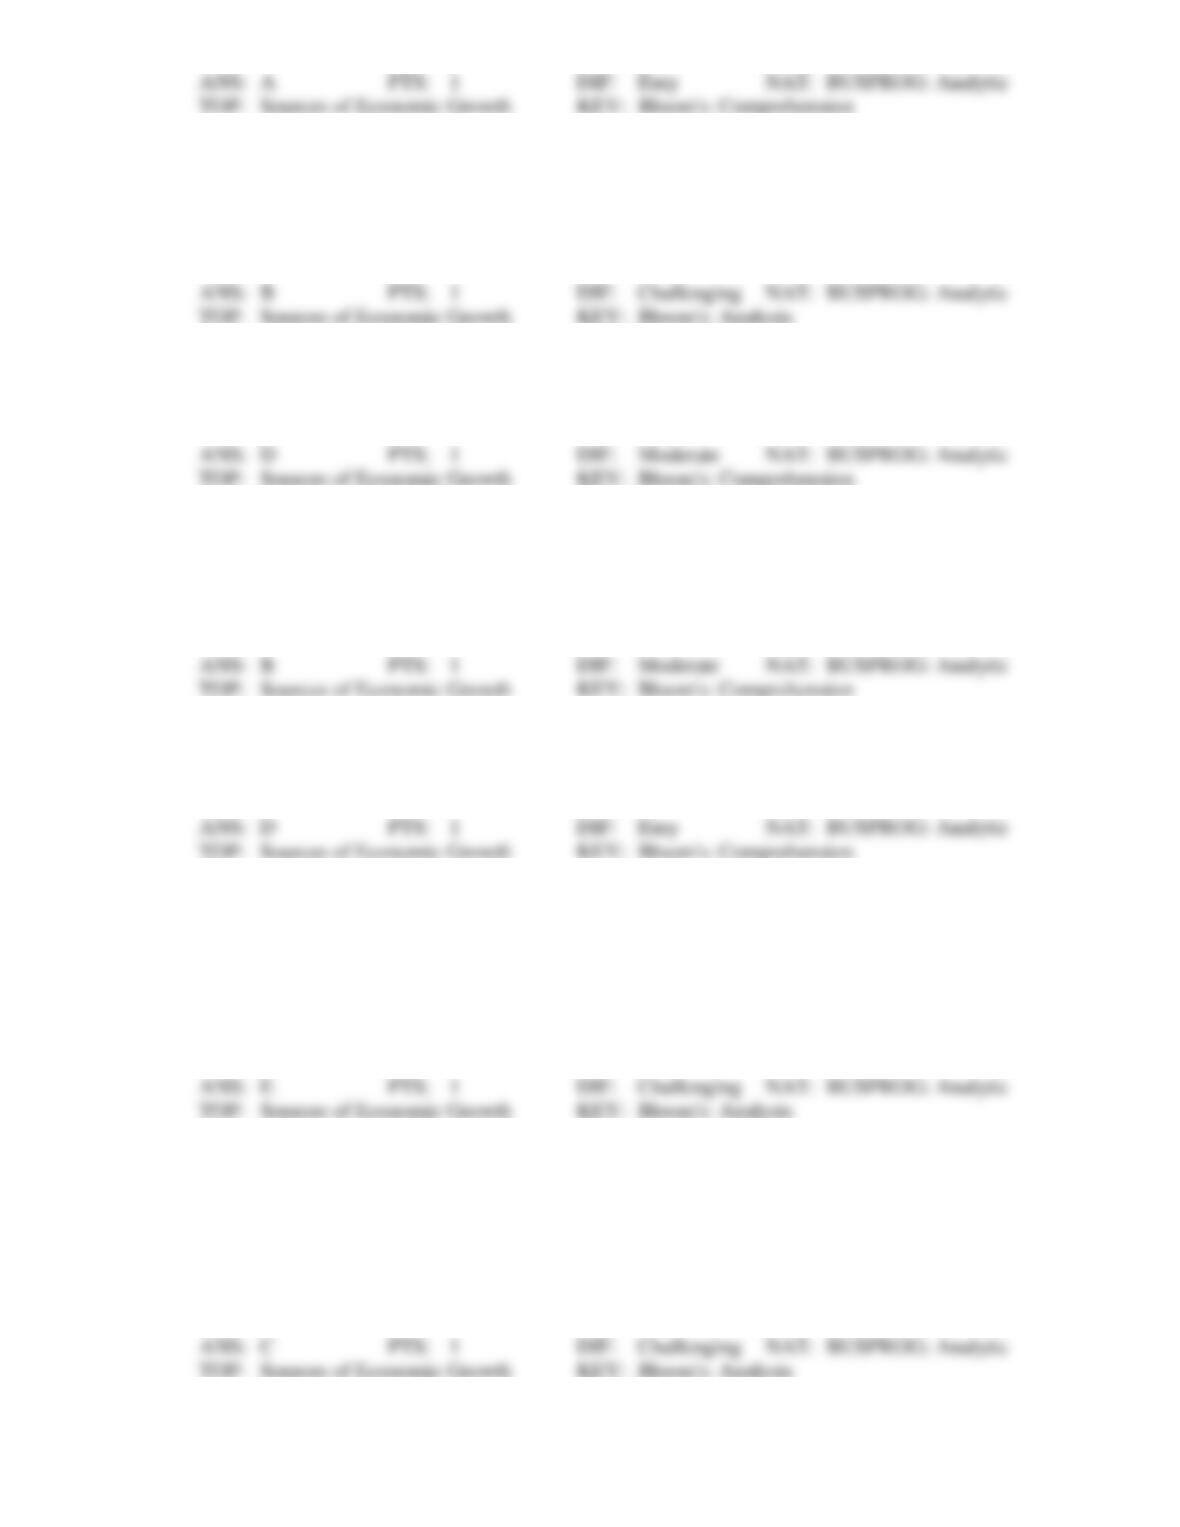
Exhibit 2-12 Production possibilities curve
110. In Exhibit 2-12, suppose an economy with the given production possibilities curve is currently located
at point A in the figure. Which of the following statements is false?
a.
This economy could produce more of both capital and consumption goods.
b.
This economy is experiencing full employment.
c.
This economy could produce more capital goods while holding fixed the number of
consumption goods produced.
d.
This economy could produce more consumption goods while holding fixed the number of
capital goods produced.
e.
Not every resource in this economy is being utilized
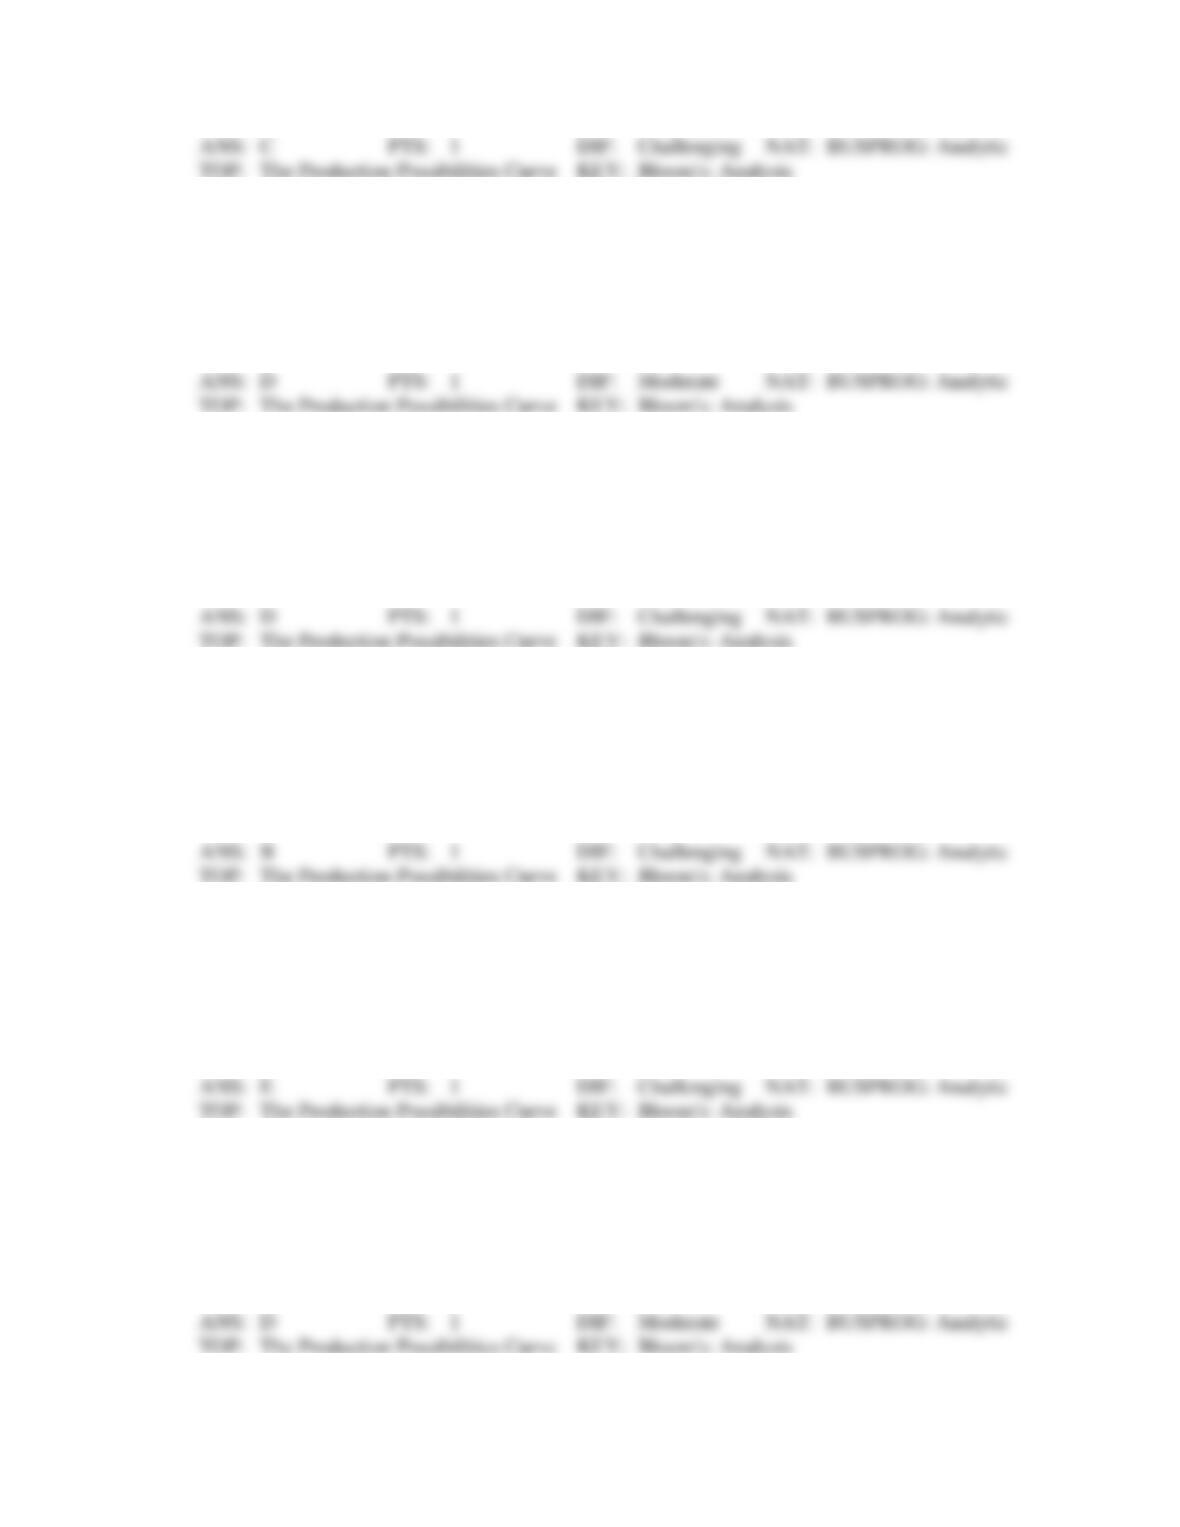
Exhibit 2-13 Production possibilities curve
111. In Exhibit 2-13, in terms of efficiency:
a.
point A is preferred to point B.
b.
point A is preferred to point E.
c.
point A is preferred to point D.
d.
point B is preferred to point A.
e.
point B is preferred to point C.
112. In Exhibit 2-13, if the economy decides to locate at point E, then:
a.
this is the best choice for this economy.
b.
the maximum number of consumption goods is being produced.
c.
the economy has not achieved full employment.
d.
the economy could not survive because no food is being produced.
e.
the economy has not achieved maximum efficiency.
113. In Exhibit 2-13, the combination of goods given by point H could:
a.
never be achieved by this economy.
b.
be achieved today if the economy achieved full employment.
c.
be achieved today if the economy achieved maximum efficiency.
d.
not be achieved today.
e.
be achieved today with the proper allocation of resources.
114. In Exhibit 2-13, which of the following is not true regarding point H? Point H:
a.
cannot be achieved by this economy today.
b.
could be achieved today if the economy only achieved full employment.
c.
could be achieved in the future by an enlargement of the economy’s resource base.
d.
could be achieved in the future by an advancement in technology.
e.
could be achieved in the future by growth in the economy.
115. In Exhibit 2-13, point H is:
a.
achievable with today’s resource base.
b.
not achievable today because the economy has not achieved full employment.
c.
not achievable today because the economy is not at its maximum point of efficiency.
d.
not achievable today because of waste.
e.
not achievable today because of inadequate production capacity.
116. In Exhibit 2-13, point D:
a.
is preferred to point A.
b.
is a point of maximum production for this economy this year.
c.
is not achievable this year because of limited resources.
d.
could result from some degree of unemployment of inefficiency.
e.
is preferred to point H.
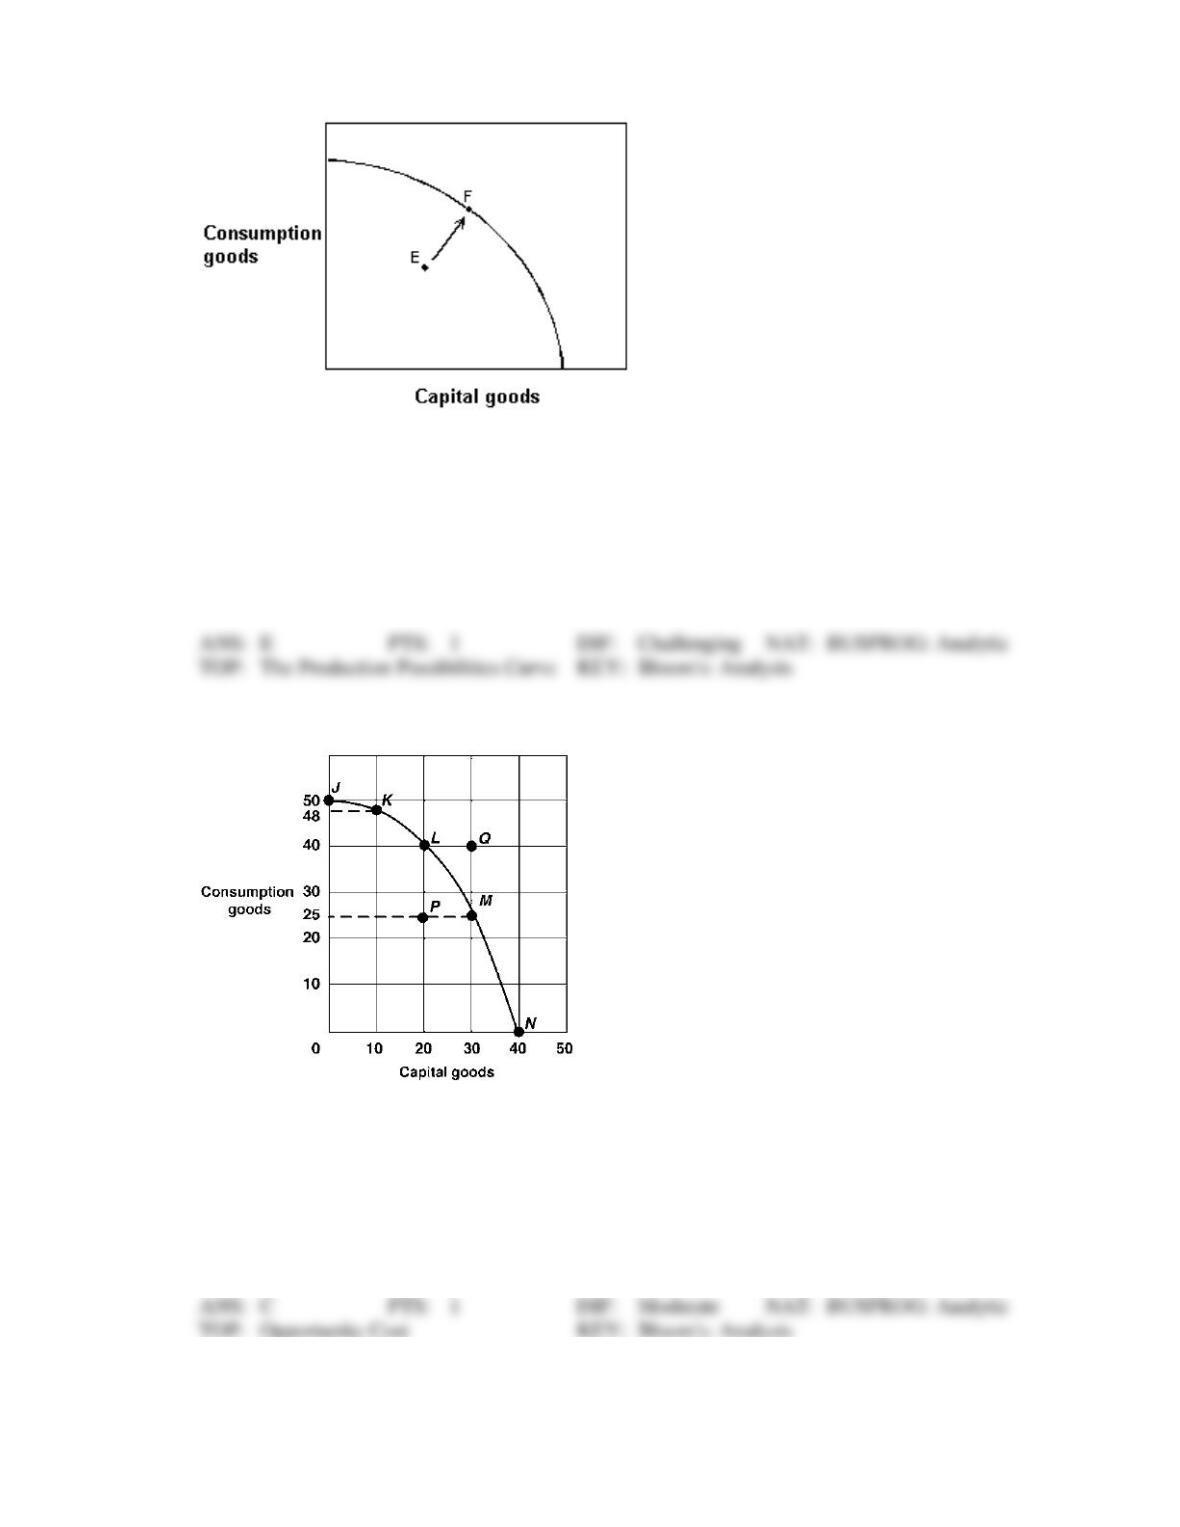
Exhibit 2-14 Production possibilities curve
117. In Exhibit 2-14, this economy was located at point E but has now moved to point F.
a.
This would be an impossible move because the economy does not have sufficient
resources.
b.
The rate of unemployment in this economy would have increased.
c.
Consumption goods production has increased, but capital goods production has decreased.
d.
The economy has decreased unemployment, but some degree of unemployment still exists.
e.
This economy has achieved full employment.
Exhibit 2-15 Production possibilities curve
118. In Exhibit 2-15, if the economy moves from point L to point M, the opportunity cost of producing 10
more capital goods is:
a.
40 less consumer goods.
b.
25 less consumer goods.
c.
15 less consumer goods.
d.
15 more consumer goods.
e.
25 more consumer goods.
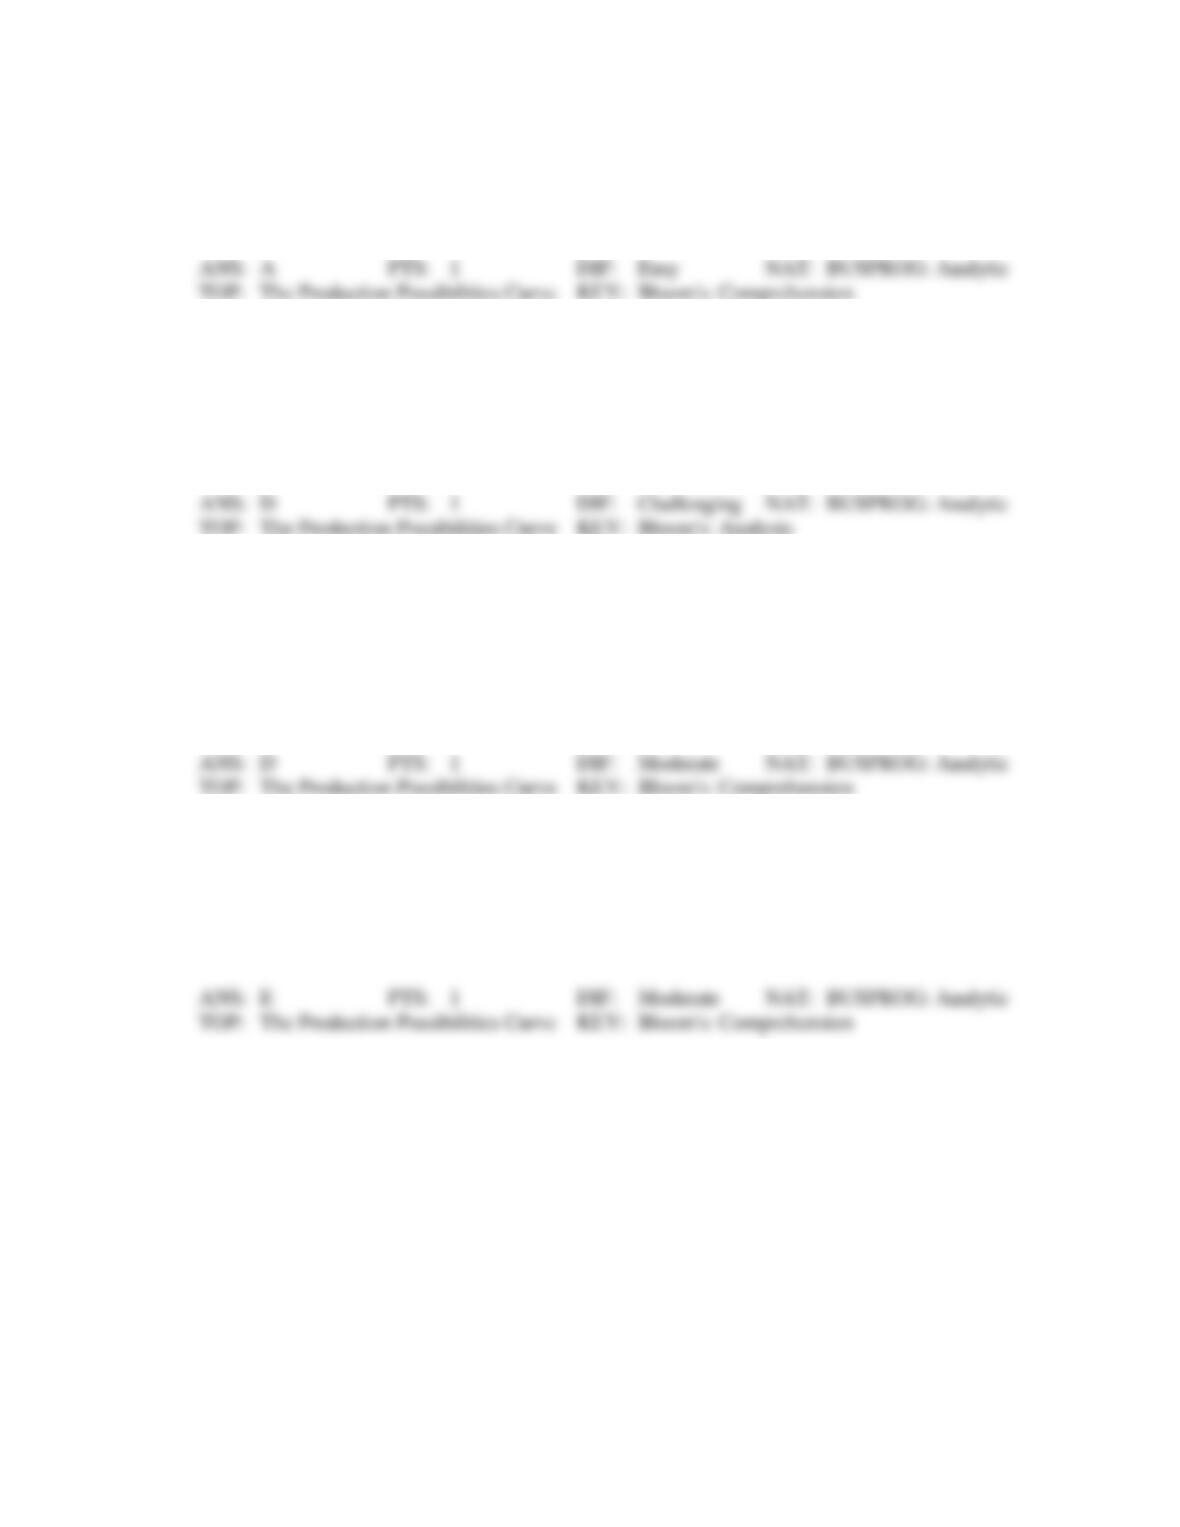
119. In Exhibit 2-15, if the economy produces no capital goods, what is the maximum number of consumer
goods that can be produced?
a.
50.
b.
48.
c.
40.
d.
25.
e.
0.
120. In Exhibit 2-15, the production possibilities curve demonstrates:
a.
changing prices.
b.
economic growth.
c.
decreases in resources.
d.
the law of increasing opportunity costs.
e.
changing technology.
121. In Exhibit 2-15, the economy will experience the most future economic growth if it chooses what point
now?
a.
J.
b.
K.
c.
M.
d.
N.
e.
P.
122. In Exhibit 2-15, inefficient resource use is shown by which of the following points?
a.
N.
b.
J.
c.
Q.
d.
L.
e.
P.
Exhibit 2-16 Production possibilities curve
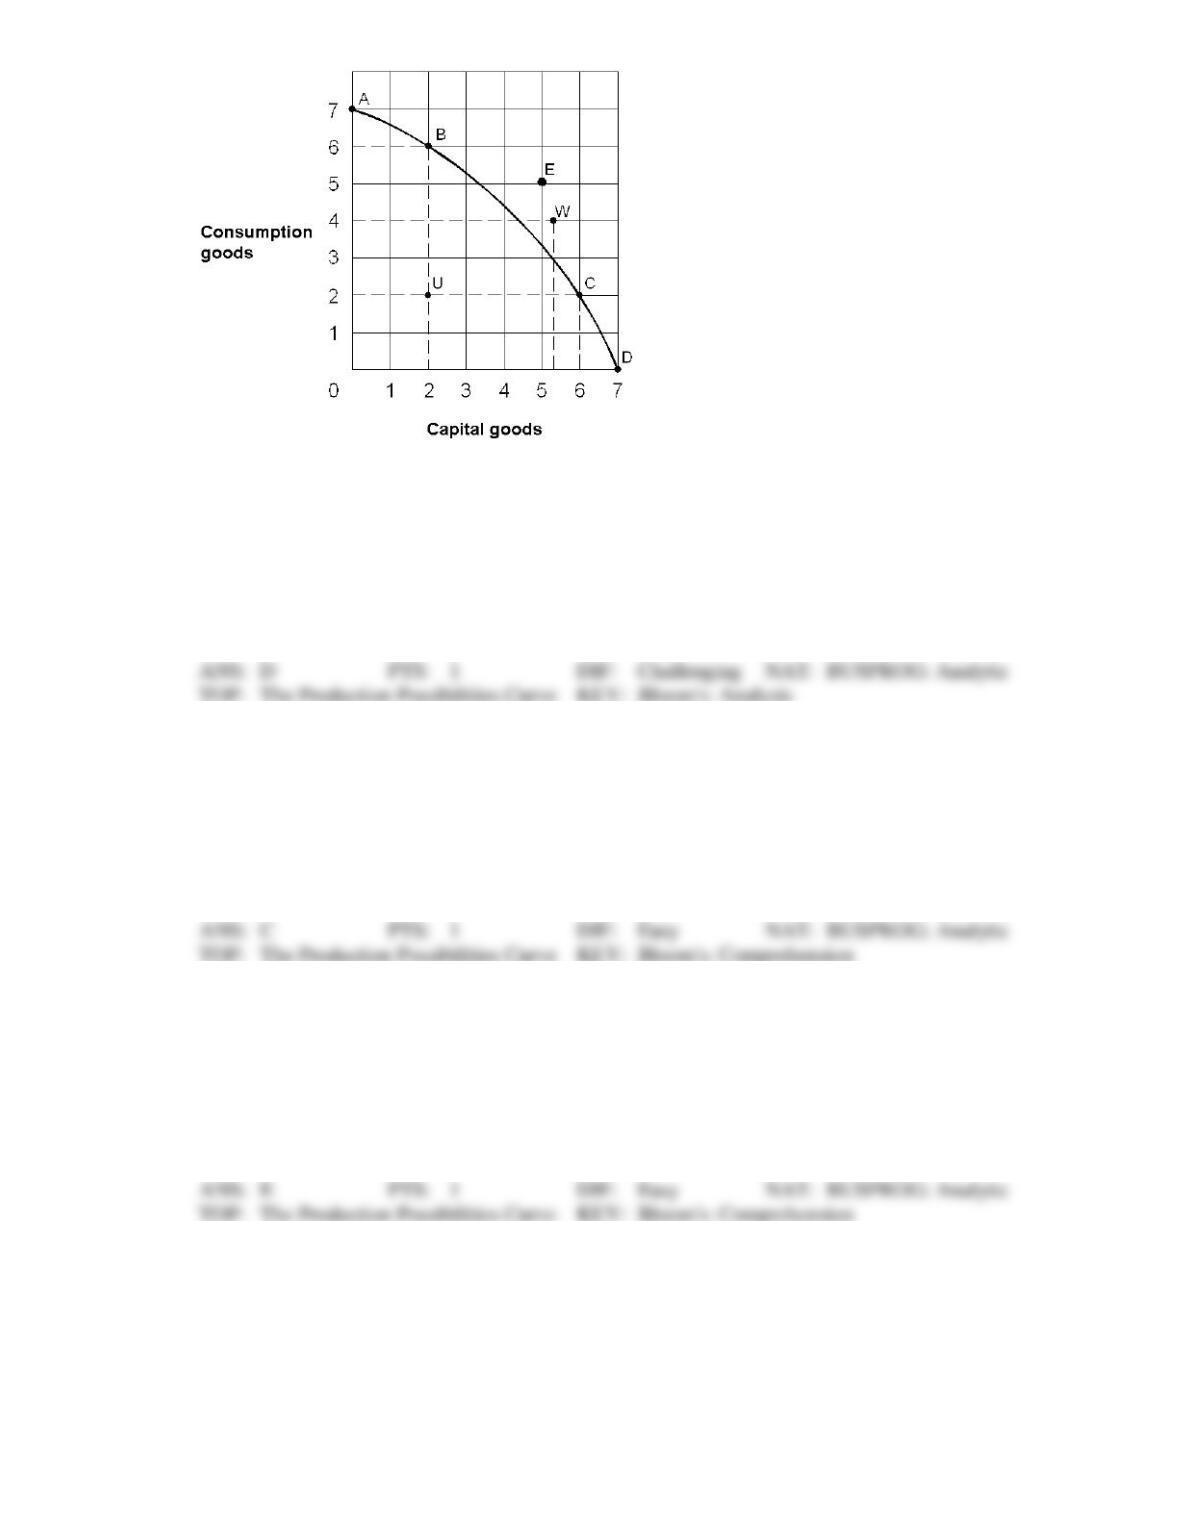
123. From the information in Exhibit 2-16, which of the following points on the production possibilities
curve are attainable with the resources and technology currently available?
a.
A, B, C, E, U
b.
A, B, C, D, W
c.
E, U, W
d.
B, C, D, U
e.
A, B, C, E
124. In Exhibit 2-16, which of the following points on the production possibilities curve are unattainable
with the resources and technology currently available?
a.
A, B, C, U
b.
A, B, C, D, U
c.
E and W
d.
B, C, D, U
e.
A, B, C, D
125. In Exhibit 2-16, which of the following points on the production possibilities curve are efficient
production points?
a.
A, B, C, U
b.
A, B, C, D, U
c.
E, U, W
d.
B, C, D, U
e.
A, B, C, D
126. In Exhibit 2-16, to move from U to B, the opportunity cost:
a.
would be 4 units of consumption goods.
b.
would be 2 units of capital goods.
c.
would be zero.
d.
would be 5 units of capital goods.
e.
cannot be estimated.
127. In Exhibit 2-16, which of the following points on the production possibilities curve are full-
employment production points?
a.
A, B, C, D
b.
A, B, C, D, U
c.
E, U, W
d.
B, C, D, U
e.
A, B, C, U
128. Over time, an increase in a nation’s stock of physical capital will:
a.
shift the production possibilities curve inward.
b.
cause an economy to operate inside its production possibilities curve.
c.
shift the production possibilities curve outward.
d.
eliminate the basic economic problem of scarcity.
129. Which of the following would not lead to a shift in an economy’s production possibilities curve?
a.
Change in technology.
b.
Change in the number of resources.
c.
An earthquake.
d.
Improvement in the education level.
e.
Change in the composition of current output.
130. Adding more resources causes:
a.
downward movement along a production possibilities curve.
b.
the production possibilities curve to shift in.
c.
upward movement along a production possibilities curve.
d.
the production possibilities curve to shift out.
e.
the production possibilities curve to become positively sloped.
131. If an economy keeps increasing its capital stock, then over time its production possibilities curve will:
a.
not move.
b.
shift to the left.
c.
shift to the right.
d.
disappear because scarcity ceases to exist.
e.
demonstrate massive job loss for workers.

132. Compare two economies A and B that start out with identical production possibilities curves. Economy
A chooses an efficient point with 6 consumption goods and 3 capital goods, while economy B also
chooses an efficient point, but with 4 consumption goods and 5 capital goods. In the future we can
predict:
a.
economy A will operate inefficiently.
b.
economy B will operate inefficiently.
c.
economy A and economy B will grow equally fast.
d.
economy A will grow faster than economy B.
e.
economy B will grow faster than economy A.
133. An analysis of production possibilities curves indicates that the reason why underdeveloped nations
have difficulties increasing their economic growth rates is because:
a.
low population growth rates mean fewer workers to produce food and other necessities.
b.
their production possibilities curves shift in when resources are increased.
c.
their production possibilities curves are positively sloped, unlike those in more developed
economies.
d.
they must cut back their already meager consumption levels to increase capital production.
e.
the opportunity cost of shifting resources from consumption goods to capital goods is
relatively low.
134. People in poor countries may have difficulties achieving economic growth because:
a.
their production possibilities curves slope upward instead of downward.
b.
they must cut back on current consumption to increase capital goods.
c.
they have a solid consumption base already in place.
d.
their resource bases are fully developed.
e.
the law of increasing costs makes it hard to produce more goods.
135. Technological innovations will cause:
a.
the production possibilities curve to stay the same.
b.
the production possibilities curve to shift to the left.
c.
the production possibilities curve to shift to the right.
d.
an economy to operate below its production possibilities curve.
e.
the production possibilities curve to increase or decrease.
136. Which of the following causes the production possibilities curve to shift to the right?
a.
d and e.
b.
c and e.
c.
A war.
d.
The development of a new technology that improves productivity.
e.
The discovery of oil reserves.

137. Robinson Crusoe’s decision to produce more capital goods and fewer consumer goods in a given
period causes:
a.
a decrease in the resources available in its economy.
b.
an increase in economic growth in future periods.
c.
a decrease in economic growth in future periods.
d.
no change in the availability of resources in its economy.
e.
a decrease in the ability to produce goods in the next period.
138. A major technological advance would be represented on a production possibilities curve by a(n):
a.
movement off the production possibilities curve toward a point outside the curve.
b.
movement toward the curve from a point inside the curve.
c.
outward shift of the entire curve.
d.
movement to the left along the curve to a higher point.
139. Other things being equal, a decreased supply of natural resources would be represented on a
production possibilities curve by a(n):
a.
movement off the curve to a point inside the curve.
b.
movement down along the curve.
c.
movement up along the curve.
d.
inward shift of the entire curve.
140. Which would be least likely to cause the production possibilities curve to shift to the right?
a.
An increase in the labor force.
b.
Improved methods of production.
c.
An increase in the education and training of the labor force.
d.
A decrease in unemployment.
141. Which of the following would most likely cause the production possibilities curve for DVDs and food
to shift outward?
a.
A choice of more food and more DVDs.
b.
A choice of more food and less DVDs.
c.
A choice of more DVDs and less food.
d.
An increase in the quantity of natural resources.
142. On a production possibilities curve diagram, greater entrepreneurship:
a.
causes the curve to shift outward.
b.
keeps the economy on the curve.
c.
prevents movement along the curve.
d.
keeps the economy at the corners of the curve.
143. In order for an economy to shift its production possibilities curve rightward, it must:
a.
suffer resource unemployment.
b.
experience an increase in its resources and/or an improvement in its technology.
c.
use its resources more efficiently than at points along the curve.
d.
all of these.
144. Reductions in available resources will cause the production possibilities curve to:
a.
expand.
c.
become vertical.
b.
disappear.
d.
shift inward.
145. A rightward (an outward) shift of a nation’s production possibilities curve could be caused by:
a.
a decrease in technology.
b.
an increase in resources.
c.
producing more consumer and fewer capital goods.
d.
a decline in the labor force’s level of education and skills.
146. An outward shift of an economy’s production possibilities curve is caused by:
a.
an increase in capital.
c.
an advance in technology.
b.
an increase in labor.
d.
all of these.
147. The production possibilities curve for the nation of Economania shifts to the right. This could have
been caused by:
a.
a decrease in Economania’s capital stock.
b.
a decrease in the Economania’s labor supply.
c.
high unemployment in Economania the previous time period.
d.
Economania producing all consumer goods in the previous period.
e.
technological innovation in the production of Economania goods.
148. The production possibilities curve for the nation of Economagic shifts to the left. This could have been
caused by:
a.
an increase in Economagic’s labor supply.
b.
innovation in the production of goods in Economagic.
c.
a war that destroyed some of Economagic’s resource base.
d.
unemployment among Economagic’s workers.
e.
Economagic’s choice of more consumption and less capital last period.

149. Which of the following cause(s) economic growth?
a.
c and d.
b.
d and e.
c.
The production of more scarce goods
d.
A technological improvement
e.
The production of more capital goods
150. Economic growth may be represented by a(n):
a.
leftward shift of a production possibilities curve.
b.
outward shift of a production possibilities curve.
c.
movement along a production possibilities curve.
d.
production possibilities curve that remains fixed.
151. A source of economic growth is:
a.
unemployment.
c.
less resources.
b.
inefficiency.
d.
greater entrepreneurship.
152. One source of economic growth is:
a.
producing inside the production possibilities curve.
b.
producing outside the production possibilities curve.
c.
increasing capital.
d.
discouraging profit-seeking entrepreneurs.
153. Which of the following statements is false?
a.
Marginal analysis is an examination of the effects of additions or subtractions from a
current situation.
b.
The production possibilities curve shows the maximum combination of two outputs that an
economy can produce, given its available resources and technology.
c.
Technology is the body of knowledge and skills applied to how goods are produced.
d.
Economic growth is illustrated as an inward shift of the production possibilities curve.
Exhibit 2-17 Production possibilities curve
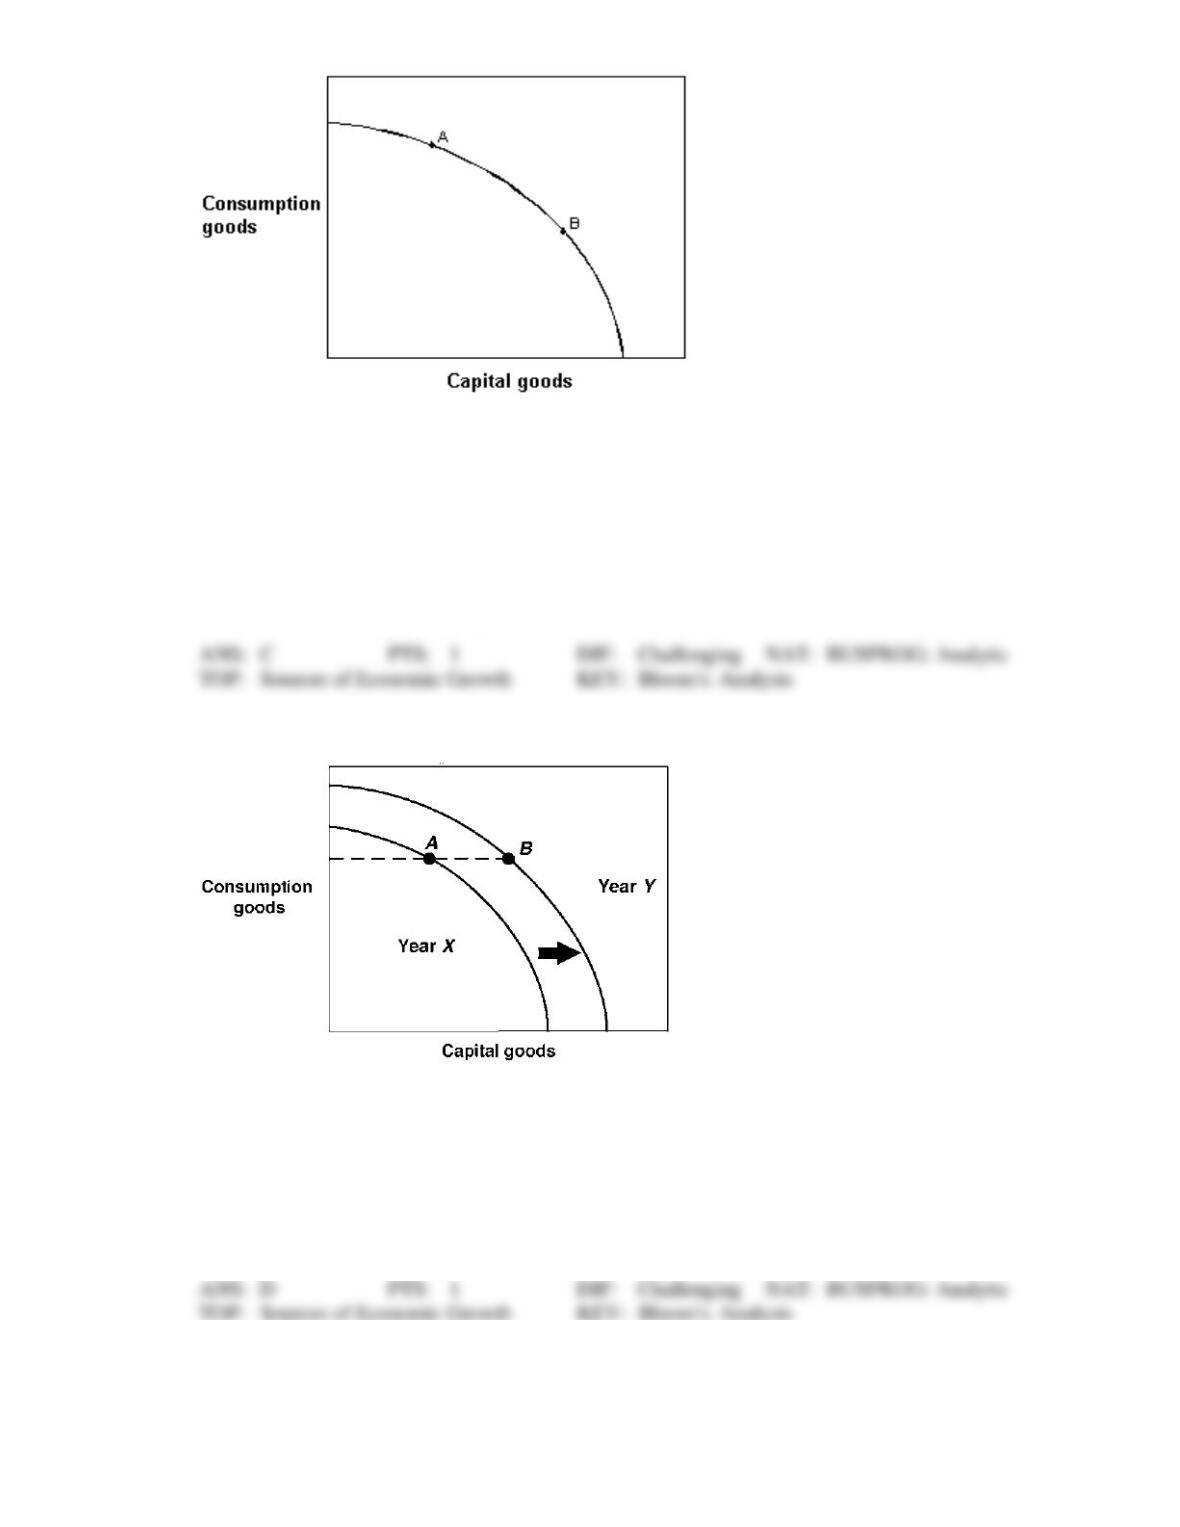
154. In Exhibit 2-17, if countries A and B currently have the same production possibilities curve (PPC) as
given in the figure, but this year country A locates at point A on its PPC and country B locates at point
B on its PPC, then country A:
a.
is better off than country B.
b.
will grow at a faster rate than country B.
c.
will grow at a slower rate than country B.
d.
is producing more capital goods than country B.
e.
is more efficient than country B.
Exhibit 2-18 Production possibilities curves
155. In Exhibit 2-18, a country is located at point A on its Year X production possibilities curve. In Year Y
this same country is located at point B on its Year Y production possibilities curve. Which of the
following could have brought about this outward shift in production possibilities curves?
a.
More efficient production in Year X.
b.
A natural disaster in Year X which leads to a destruction of resources.
c.
Higher unemployment in Year X.
d.
An advance in technology occurred in Year X.
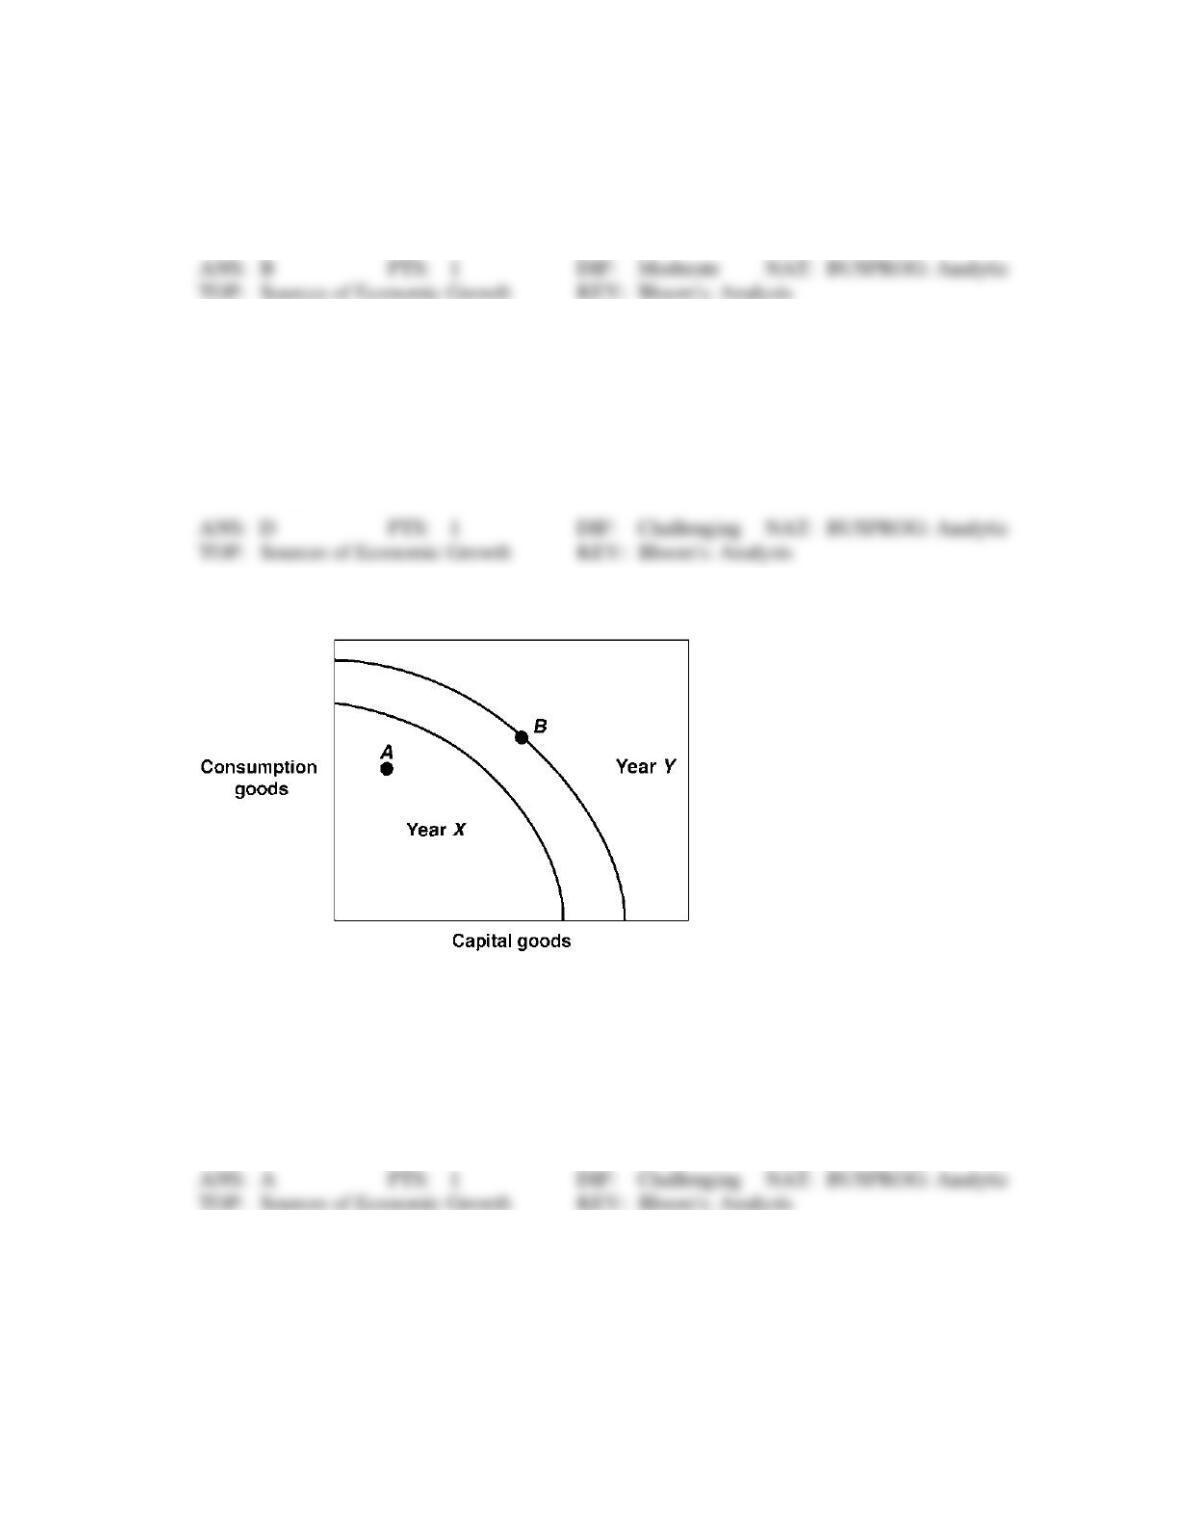
156. In Exhibit 2-18, the production possibilities curves for a country are shown for the years Year X and
Year Y. Suppose this country was located at point A in Year X and point B in Year Y. This country:
a.
is producing the same number of capital goods in both years.
b.
is producing the same number of consumption goods in both years.
c.
has shown no growth between Year X and Year Y.
d.
has higher unemployment in Year X than in Year Y.
e.
has higher unemployment in Year Y than in Year X.
157. In Exhibit 2-18, the production possibilities curves for a country are shown for the years Year X and
Year Y. Suppose this country was located at point A in Year X and point B in Year Y. This economy:
a.
is worse off in Year Y than in Year X.
b.
has stagnated production in this two year period.
c.
is more efficient in Year Y than in Year X.
d.
has shown growth between these two years.
e.
has higher unemployment in Year Y than in Year X.
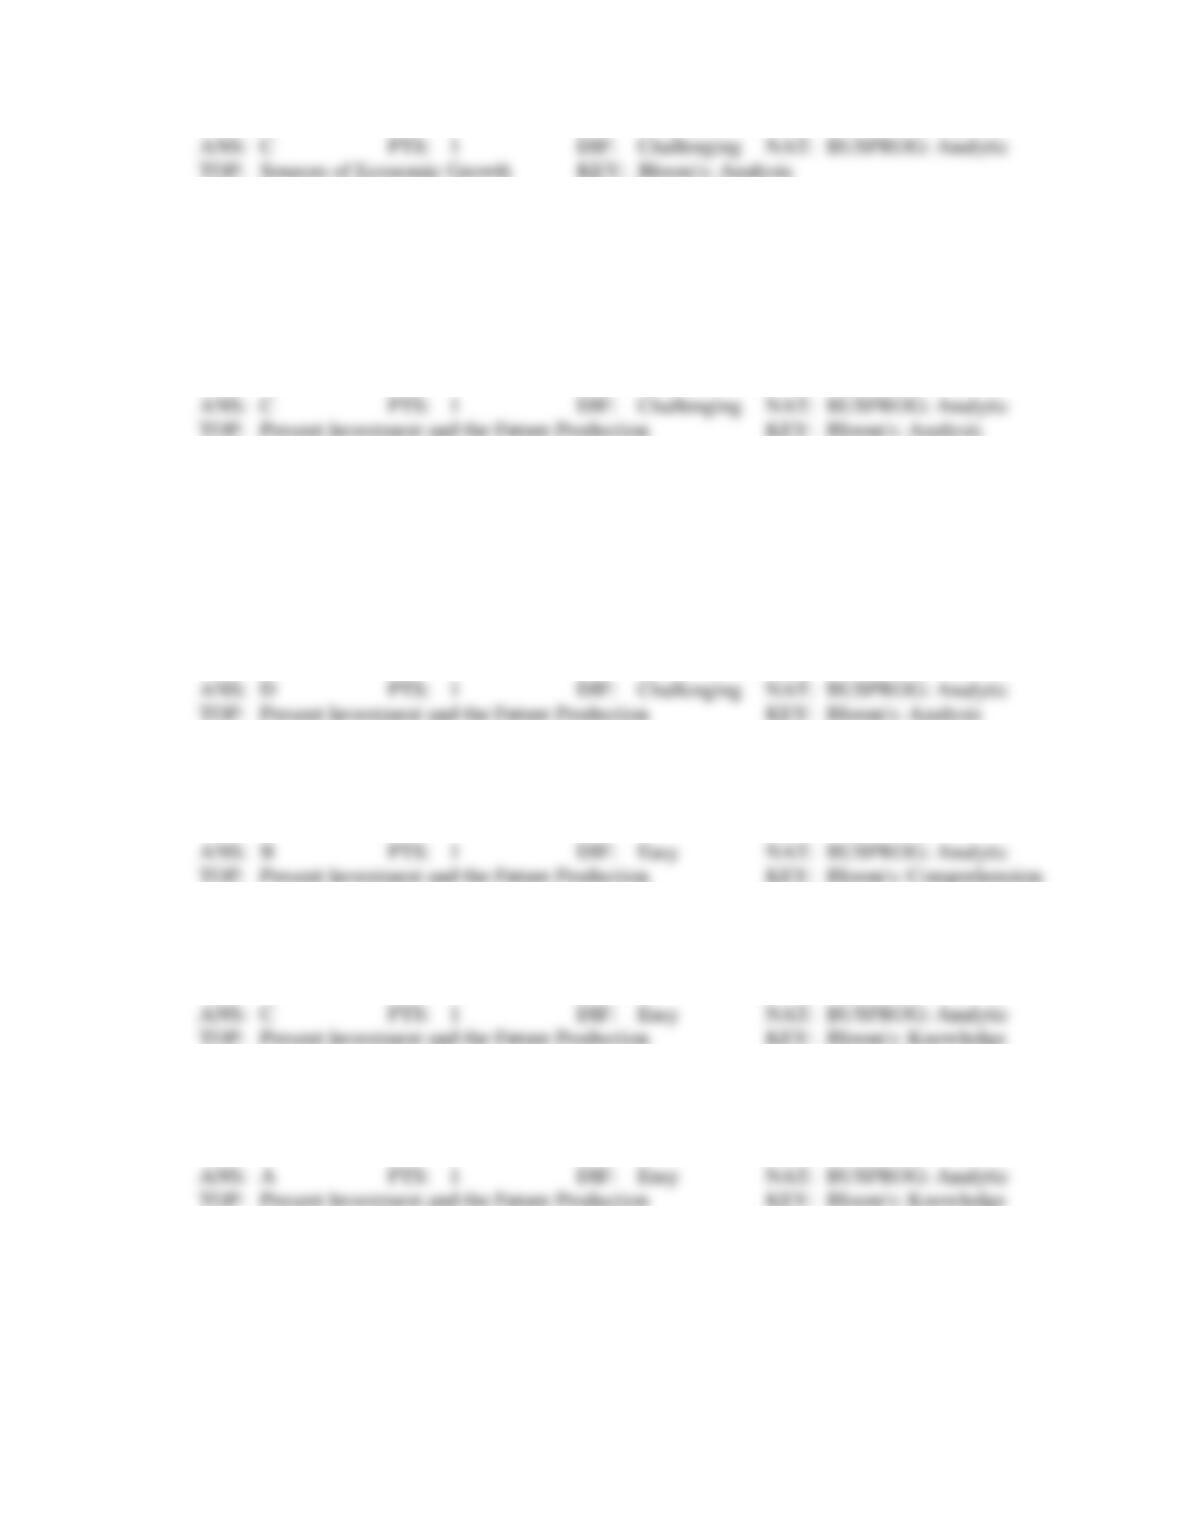
Exhibit 2-19 Production possibilities curves
158. In Exhibit 2-19, the production possibilities curves for a country are shown for the years Year X and
Year Y. Suppose this country was located at point A in Year X and point B in Year Y. This economy:
a.
has lower unemployment in Year Y than in Year X.
b.
was more efficient in Year X than in Year Y.
c.
achieved full employment in Year X and in Year Y.
d.
showed no growth between Year X and Year Y.
e.
is worse off in Year Y than in Year X.
159. In Exhibit 2-19, the production possibilities curves for a country are shown for the years Year X and
Year Y. Which of the following could have caused a shift for Year X to Year Y in production
possibilities curves?
a.
An increase in unemployment.
b.
A decline in technology.
c.
An increase in the stock of capital goods.
d.
A natural disaster.
e.
More efficient production.
160. With time, which one of the following strategies would most likely result in an outward shift in the
production possibilities curve of an economy?
a.
passage of legislation reducing the workweek to 30 hours.
b.
instituting a tax policy encouraging consumption at the expense of investment.
c.
instituting a tax policy encouraging investment at the expense of consumption.
d.
an increase in the marginal income tax rate, which would reduce the work effort of
individuals.
161. Which of the following is true?
a.
The production possibilities curve indicates that it will be impossible to expand total
output with the passage of time.
b.
As long as resources are scarce, output cannot be increased.
c.
The size of the economic pie is fixed, and therefore, if one individual has more income,
others must have less.
d.
Over time, the output of goods and services can be increased through human ingenuity and
discovery of better ways of doing things.
162. The process through which an economy’s production possibilities curve shifts outward is:
a.
full-employment management.
c.
resource renewal.
b.
investment.
d.
out-resourcing.
163. The process of accumulating capital is called:
a.
capitalization.
c.
investment.
b.
loanable funds.
d.
debt management.
164. In economics, investment refers to the process of accumulating:
a.
capital goods.
c.
money.
b.
consumer goods.
d.
stocks and bonds.
165. A nation can accelerate its economic growth by:
a.
reducing the number of immigrants allowed into the country.
b.
adding to its stock of capital.
c.
printing more money.
d.
imposing tariffs and quotas on imported goods.
TRUE/FALSE
1. Only socialist economies need to answer the What, How, and For Whom questions.
2. When making a rational decision which requires the consideration of costs and benefits involved, the
opportunity cost of a decision is often not taken into consideration when indeed it should be.
3. An opportunity cost is the highest valued alternative foregone whenever one chooses an alternative.
4. The opportunity cost of producing a good or service is the good or service that is foregone by choosing
to produce another good with the same resources in a given period of time.
5. The opportunity cost of attending a movie is the purchase price of a ticket.
6. Every economic choice has an opportunity cost.
7. The basic approach in marginal analysis is to compare a policy’s total benefits with its total costs.
8. Marginal analysis examines the effects of additions to or subtractions from a current situation.
9. If more of one good can be produced without producing less of another output, the economy must have
been operating efficiently.
10. If some resources went to waste rather to use in production, the economy would operate outside its
production possibility curve.
11. Each and every point along a production possibilities curve represents an efficient output option for an
economy.
12. If some resources were used inefficiently, the economy would operate outside its production
possibilities curve.
13. Of all the points on the production possibilities curve, only one point represents an efficient point.
14. The most efficient point on the production possibilities curve is the midpoint on the curve.
15. On the production possibilities curve, a movement between points that yields a loss of one good in
order to raise the output of another good will maintain efficient production.
16. All points on the production possibilities curve represent efficient levels of production.
17. A nation’s current location on its production possibilities curve can determine the future location of
that nation’s production possibilities curve.
18. Assuming an economy is already experiencing full employment, then it must produce more consumer
goods and fewer capital goods if it wishes to experience greater rates of economic growth over time.
19. A nation can accelerate economic growth by increasing its production of consumer goods.
20. Investment in capital accumulation, as well as investment in education and other labor productivity
enhancing programs, is necessary for economic growth.
21. In economics terminology, the process of accumulating money is investment.
22. Investment is an economic term for the act of increasing the stock of money available for business
loans.
ESSAY
1. Discuss the three fundamental economic questions that all nations must address.
2. Why are all costs really “opportunity costs”?
3. What can a nation do to increase its economic growth? Why is economic growth among the major
national economic goals of all countries?

4. Graphically express a production possibilities curve. What do points on, inside and outside the curve
represent? What does a rightward shift of the curve represent? How is economic growth expressed in
terms of the production possibilities model?