
Page 1
1.
The following table gives the average daily intake of animal fats in grams per day and
the age-adjusted death rate from breast cancer per 100,000 women.
Country
Japan
Spain
Austria
U.S.
U.K.
Average daily fat intake (grams)
F
20
40
90
100
120
Death rate per 100,000 D
3
7
17
19
23
A) Use the regression capability of your calculator to find a formula for D as a
function of F.
B) Use the function to predict the death rate from breast cancer in Mexico where
the average daily fat intake is F = 23 grams.
C) Use the function to estimate the average daily fat intake in a country where there
are 15 deaths from breast cancer for every 100,000 women.
2.
A student who works as a waiter records the cost C of meals and the tip T left by diners.
His data recorded for one evening are:
Cost $
14.86
19.38
13.72
29.78
20.93
Tip $
2.22
3.48
3.01
5.65
3.55
A) Use linear regression to find T as a function of C.
B) How much can the waiter expect his tip to increase from a $6 increase in the bill?
3.
Use regression to find a linear function that best fits the data in the table:
x
6.2
8.3
10.4
16.4
21.5
y
25.30
40.64
62.23
84.76
99.42
Round values to 2 decimal places, if necessary.
Page 2
4.
The data below gives the mean annual cost for tuition and fees at private four-year
colleges in the United States since 1980. It is clear that the cost of education is
going up.
Mean Cost of Tuition and Fees for Private Colleges
Year
Private Ed $
1980
$3,617
1981
$4,113
1982
$4,639
1983
$5,093
1984
$5,556
1985
$6,121
1986
$6,658
1987
$7,116
1988
$7,722
1989
$8,446
1990
$9,340
1991
$10,017
1992
$10,449
1993
$11,007
1994
$11,709
A) Using Linear Regression techniques, find the linear equation that is the best fit
to this data. Find the annual costs, C, at private four-year colleges in the
United States as a function of the number of years after 1980, y.
B) If costs continue to rise at the same rate, what would be the approximate cost
in year 2010?
Round values to 2 decimal places, if necessary.
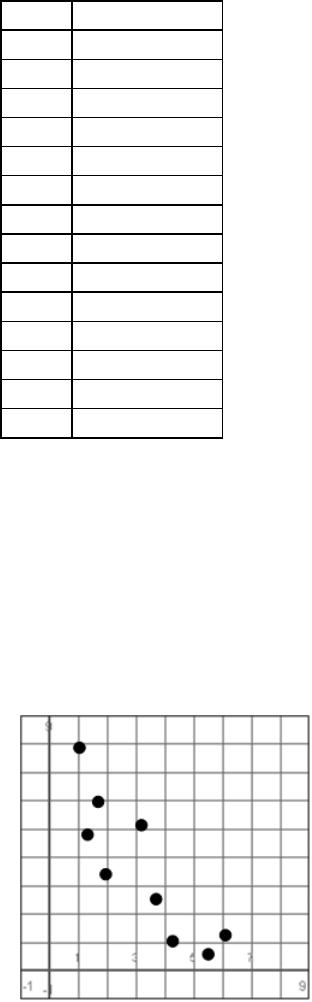
5.
Tell whether the graph has a positive or negative relationship.
A)
Positive
B)
Negative
Page 3
6.
The following equation represents the best-fit regression line for median personal total
income of adult males vs. years of education past eighth grade in Northern Wisconsin.
Median personal income = 4,822 + 7,147 years of education
What is the rate of change of median personal total income with respect of years of
education?
7.
The following equation represents the best-fit regression line for median personal total
income of adult males vs. years of education past eighth grade in Northern Wisconsin.
Median personal income = 4,370 + 5,796 years of education
What would be the expected annual personal income of a male who had 0 years of
education past eighth grade?
8.
The following equation represents the best-fit regression line for median personal total
income of adult males vs. years of education past eighth grade in Northern Wisconsin.
Median personal income = 5,813 + 5,567 years of education
What would be the expected annual personal income of a male who had 8 years of
education past eighth grade?
9.
The following equation represents the best-fit regression line for median personal total
income of adult males vs. years of education past eighth grade in Northern Wisconsin.
Median personal income = 4,131 + 6,503 years of education
If a male desired to earn $30,143 / year, how many years of education past eighth grade
should they pursue?
Page 4
Answer Key