Page 1
1.
For the following table, reinitialize the independent variable so it starts at 1970. (So the
vertical intercept occurs at 1970.)
Year
Cost ($1000s)
1970
$46.20
1975
$53.59
1980
$59.43
1985
$84.83
1990
$118.86
Year
Cost ($1000s)
0
2.
Use points D and E from this table to estimate the slope of the linear model for this data.
Advertising
Expense ($1000s)
Sales
($1000s)
A
$38.7
$268.58
B
$41.5
$291.30
C
$50.1
$345.34
D
$44.0
$308.60
E
$60.0
$411.00
Round the answer to 2 decimal places.
3.
This table shows the final exam scores (y) compared to the hours studied (x) for 5
randomly selected students.
Time spent
Studying (hours)
Final Exam
Score
A
2.8
46
B
4.0
66
C
5.0
75
D
4.4
68
E
5.9
81
A). Use points A and D from this table to estimate the slope of the linear model for this
data.
Round the answer to 2 decimal places.
B). Use point A to determine the vertical intercept of the linear model.
Round the answer to 2 decimal places.
Page 2
4.
Create an estimate of a linear model for this data. Use points C and E from this table to
estimate the slope, and then use point C to estimate the vertical intercept. Round the
answers to 2 decimal places.
Ounces of Polymer
in Mold
Time to Cool
(Min.)
A
3.2
8.46
B
3.9
9.82
C
4.8
12.24
D
4.3
11.84
E
6.1
15.08
5.
Create an estimate of a linear model for this data. Use points B and D from this table to
estimate the slope, and then use point B to estimate the vertical intercept. Round the
answers to 2 decimal places.
Number of
children
Weekly Food
Expense ($)
A
3
$669.40
B
3
$668.70
C
1
$471.58
D
4
$768.86
E
5
$867.82
6.
Use an estimate of a linear model for this data to extrapolate the requested information.
Use points B and E from this table to estimate the slope, and then use point B to
estimate the vertical intercept. Round the answers to 2 decimal places.
Number of children
in Household
Weekly Food
Expense ($)
A
2
$561.71
B
4
$754.69
C
1
$465.17
D
6
$948.07
E
7
$1044.61
Extrapolate the weekly food expense for a household with 9 children. Round the
answer to 2 decimal places.
Page 3
7.
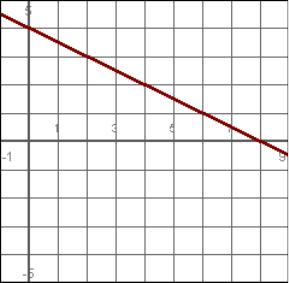
Choose the equation that matches the graph.
A)
y = 4
+
0.5x
B)
y = 0.5
–
4x
C)
y = 4
–
0.5x
D)
y = 4
–
x
8.
Find the equation to describe the data in the table.
x
y
0
6
4
14
8
22
12
30
16
38
9.
State whether the data shown in the table is exactly linear or approximately linear.
x
3
6
9
12
y
–2.5
–1
0.5
2
A)
Linear
B)
Approximately linear
Page 4
Answer Key