22.
A circular-flow diagram is a visual model of the economy.
a.
True
b.
False
23.
The circular flow model is not used anymore because it fails to perfectly replicate real world
situations.
a.
True
b.
False
24.
In the circular-flow diagram, households and firms are the decision makers.
a.
True
b.
False
25.
In the circular-flow diagram, firms produce goods and services using the factors of production.
a.
True
b.
False
26.
In the circular-flow diagram, factors of production are the goods and services produced by firms.
a.
True
b.
False
27.
In the circular-flow diagram, factors of production include land, labor, and capital.
a.
True
b.
False
28.
In the circular-flow diagram, firms own the factors of production and use them to produce goods
and services.
a.
True
b.
False
29.
In the circular-flow diagram, firms consume all the goods and services that they produce.
a.
True
b.
False
30.
In the circular-flow diagram, the two types of markets in which households and firms interact are
the markets for
goods and services and the markets for factors of production.
a.
True
b.
False
31.
In the markets for goods and services in the circular-flow diagram, households are buyers and
firms are sellers.
a.
True
b.
False
32.
In the markets for the factors of production in the circular-flow diagram, households are buyers
and firms are
sellers.
a.
True
b.
False
33.
In the circular-flow diagram, one loop represents the flow of goods, services, and factors of
production, and the
other loop represents the corresponding flow of dollars.
a.
True
b.
False
34.
In the circular-flow diagram, one loop represents the flow of goods and services, and the other
loop represents the
flow of factors of production.
a.
True
b.
False
35.
In the circular-flow diagram, payments for labor, land, and capital flow from firms to households
through the
markets for the factors of production.
a.
True
b.
False
36.
The production possibilities frontier is a graph that shows the various combinations of outputs that
the economy can
possibly produce given the available factors of production and the available
production technology.
a.
True
b.
False
428 Thinking Like an Economist
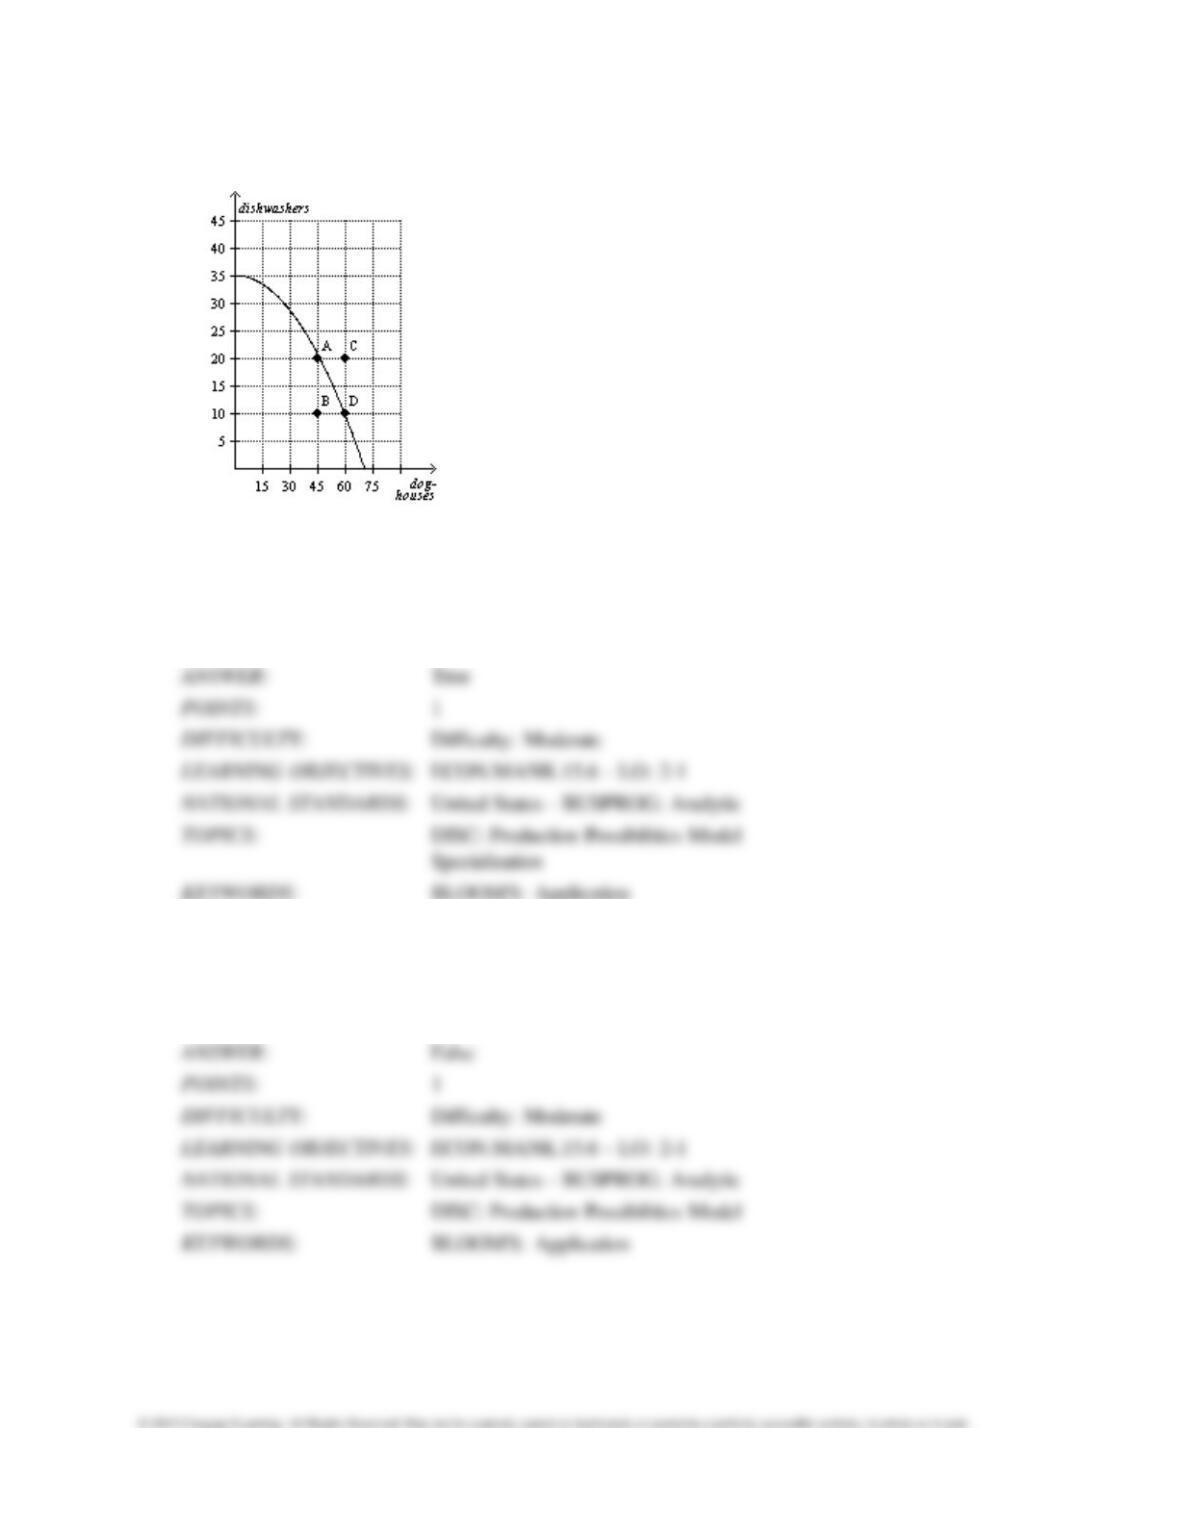
Figure 2-23
37.
Refer to Figure 2-23. If this economy uses all its resources in the dishwasher industry, it
produces 35
dishwashers and no doghouses.
a.
True
b.
False
38.
Refer to Figure 2-23. It is possible for this economy to produce 75 doghouses.
a.
True
b.
False
39.
Refer to Figure 2-23. It is possible for this economy to produce 30 doghouses and 20
dishwashers.
a.
True
b.
False
40.
Refer to Figure 2-23. It is possible for this economy to produce 45 doghouses and 30
dishwashers.
a.
True
b.
False
41.
Refer to Figure 2-23. When this economy produces 30 doghouses and 25 dishwashers there is
full employment.
a.
True
b.
False
42.
Refer to Figure 2-23. This economy fully employs its resources when it produces 35
dishwashers and zero
doghouses.
a.
True
b.
False
43.
Refer to Figure 2-23. Given the technology available for manufacturing doghouses and
dishwashers, this
economy does not have enough of the factors of production to support the level
of output represented by point C.
a.
True
b.
False
44.
Refer to Figure 2-23. Points A, B, and D represent feasible outcomes for this economy.
a.
True
b.
False
45.
Refer to Figure 2–23. Points B and C represent infeasible outcomes for this economy.
a.
True
b.
False
46.
Refer to Figure 2-23. Points A, B, and D represent efficient outcomes for this economy.
a.
True
b.
False
47.
Refer to Figure 2–23. Point B represents an inefficient outcome for this economy.
a.
True
b.
False
48.
Refer to Figure 2-23. Unemployment could cause this economy to produce at point B.
a.
True
b.
False
49.
Refer to Figure 2-23. The opportunity cost of moving from point A to point D is 10 dishwashers.
a.
True
b.
False
50.
Refer to Figure 2-23. The opportunity cost of moving from point B to point D is 15 doghouses.
a.
True
b.
False
51.
Refer to Figure 2–23. The opportunity cost of moving from point B to point A is zero.
a.
True
b.
False
52.
Refer to Figure 2-23. The opportunity cost of an additional doghouse increases as more
doghouses are produced.
a.
True
b.
False
53.
With the resources it has, an economy can produce at any point on or outside the production
possibilities frontier,
but it cannot produce at points inside the frontier.
a.
True
b.
False
54.
Points inside the production possibilities frontier represent feasible levels of production.
a.
True
b.
False
55.
Points inside the production possibilities frontier represent inefficient levels of production.
a.
True
b.
False
56.
Points on the production possibilities frontier represent efficient levels of production.
a.
True
b.
False
57.
Points outside the production possibilities frontier represent infeasible levels of production.
a.
True
b.
False
58.
If a major union goes on strike, then the country would be operating inside its production
possibilities frontier.
a.
True
b.
False
59.
An outcome is said to be efficient if an economy is getting all it can from the scarce resources it
has available.
a.
True
b.
False

60.
An outcome is said to be efficient if an economy is conserving the largest possible quantity of its
scarce resources
while still meeting the basic needs of society.
a.
True
b.
False
61.
A production point is said to be efficient if there is no way for the economy to produce more of
one good without
producing less of another.
a.
True
b.
False
62.
If an economy can produce more of one good without giving up any of another good, then the
economy’s current production point is inefficient.
a.
True
b.
False
63.
Unemployment causes production levels to be inefficient.
a.
True
b.
False
64.
The opportunity cost of something is what you give up to get it.
a.
True
b.
False
65.
The production possibilities frontier shows the opportunity cost of one good as measured in terms
of the other good.
a.
True
b.
False
66.
When a production possibilities frontier is bowed outward, the opportunity cost of one good in terms
of the other is
constant.
a.
True
b.
False
67.
When a production possibilities frontier is bowed outward, the opportunity cost of one good in terms
of the other
depends on how much of each good is being produced.
a.
True
b.
False
68.
When a production possibilities frontier is bowed outward, the opportunity cost of the first good in
terms of the
second good increases as more of the second good is produced.
a.
True
b.
False
69.
When a production possibilities frontier is bowed outward, the opportunity cost of the second good
in terms of the
first good increases as more of the second good is produced.
a.
True
b.
False
70.
A production possibilities frontier has a bowed shape if the opportunity cost is constant at all levels
of output.
a.
True
b.
False
71.
Economists believe that production possibilities frontiers rarely have a bowed shape.
a.
True
b.
False
72.
A production possibilities frontier will be bowed outward if some of the economy’s resources are
better suited to producing one good than another.
a.
True
b.
False
73.
The trade-off between the production of one good and the production of another good can change
over time
because of technological advances.
a.
True
b.
False
74.
A technological advance in the production of the first good increases the opportunity cost of the
first good in terms
of the second good.
a.
True
b.
False
75.
While the production possibilities frontier is a useful model, it cannot be used to illustrate economic
growth.
a.
True
b.
False
76.
Economic growth causes a production possibilities frontier to shift outward.
a.
True
b.
False
77.
If new government regulations designed to protect wetlands remove very productive farmland
from production,
then the production possibilities frontier will shift inward.
a.
True
b.
False
78.
Production possibilities frontiers can be used to illustrate scarcity, trade-offs, opportunity cost,
efficiency,
unemployment, technological advances, and economic growth.
a.
True
b.
False
79.
Microeconomics is the study of how households and firms make decisions and how they interact in
specific
markets.
a.
True
b.
False
80.
Macroeconomics is the study of economy-wide phenomena.
a.
True
b.
False