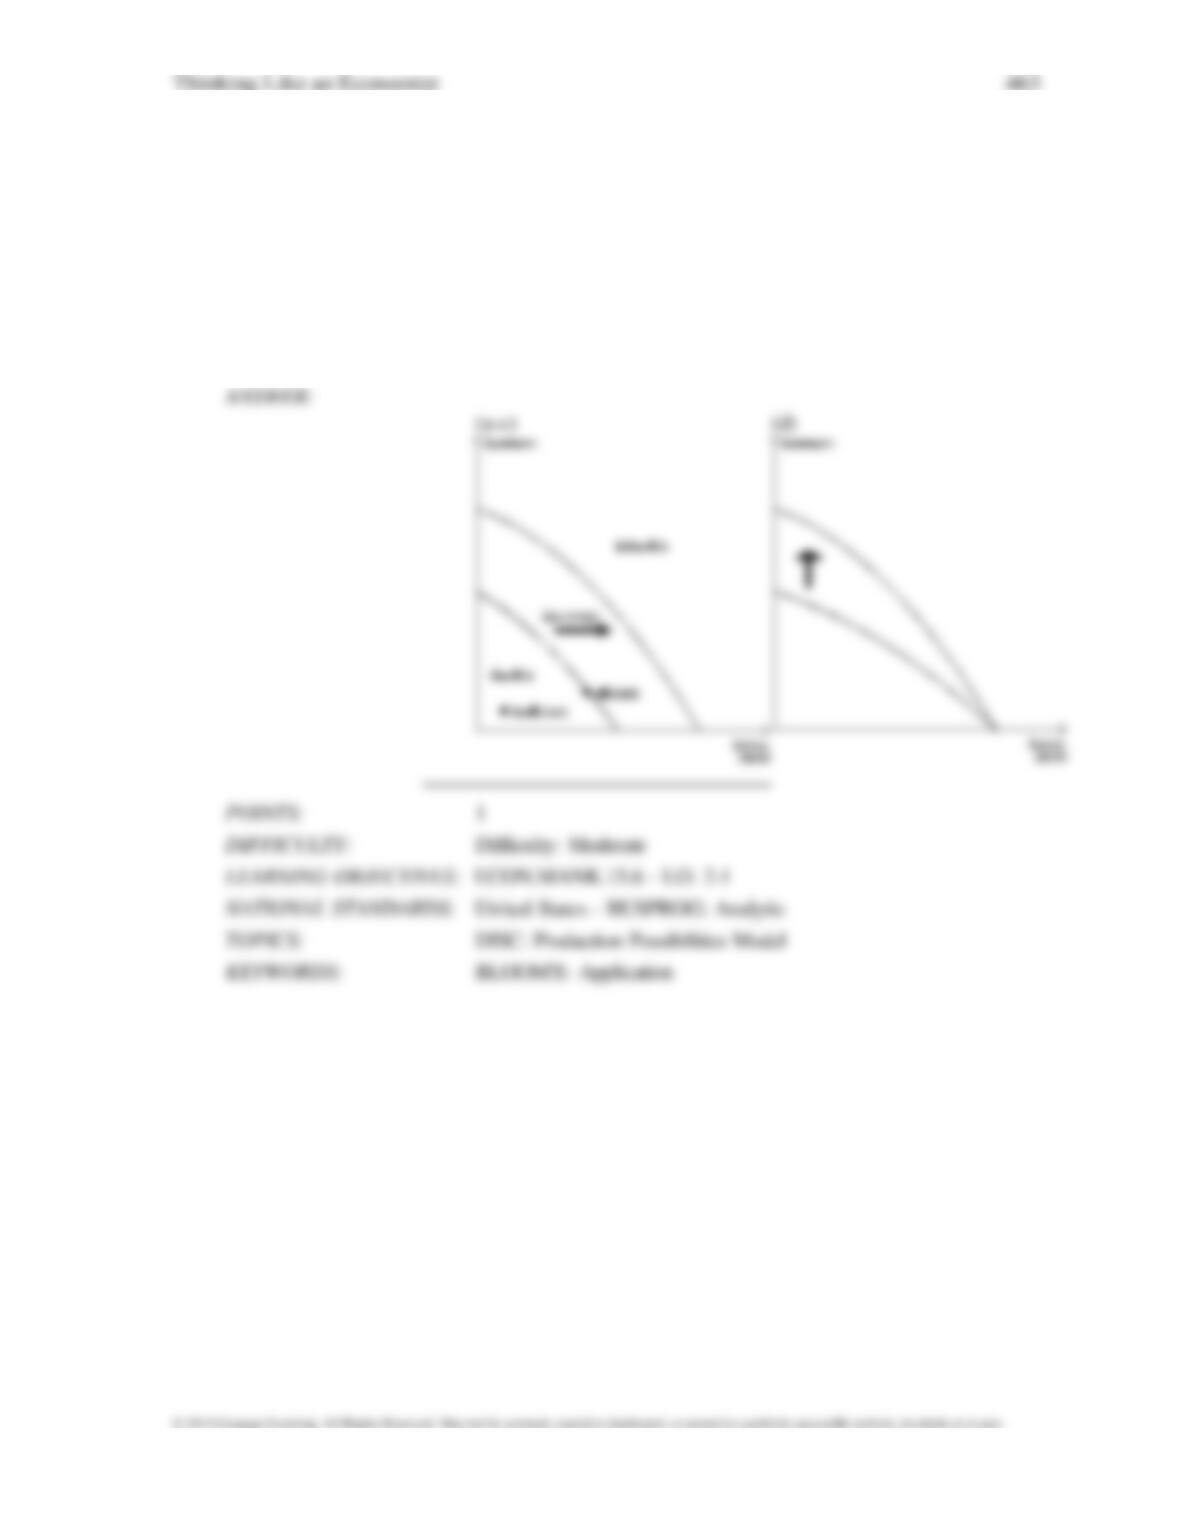
133.
Draw a production possibilities frontier showing increasing opportunity cost of hammers in terms
of horseshoes.
a.
On the graph, identify the area of feasible outcomes and the area of infeasible outcomes.
b.
On the graph, label a point that is efficient and a point that is inefficient.
c.
On the graph, illustrate the effect of the discovery of a new vein of iron ore, a resource
needed to make both horseshoes and hammers, on this economy.
d.
On a second graph, illustrate the effect of a new computerized assembly line in the
production
of hammers on this economy.
134.
Identify each of the following topics as being part of microeconomics or macroeconomics:
a.
the impact of a change in consumer income on the purchase of luxury automobiles
b.
the effect of a change in the price of Coke on the purchase of Pepsi
c.
the impact of a war in the Middle East on the rate of inflation in the United States
d.
factors influencing the rate of economic growth
e.
factors influencing the demand for tractors
f.
the impact of tax policy on national saving
g.
the effect of pollution taxes on the U.S. copper industry
h.
the degree of competition in the cable television industry
i.
the effect of a balanced-budget amendment on economic stability
j.
the impact of deregulation on the savings and loan industry
135.
Which of the following statements are positive and which are normative?
a.
The minimum wage creates unemployment among young and unskilled workers.
b.
The minimum wage ought to be abolished.
c.
If the price of a product in a market decreases, then, other things equal, quantity demanded
will
increase.
d.
A little bit of inflation is worse for society than a little bit of unemployment.
e.
There is a tradeoff between inflation and unemployment in the short run.
f.
If consumer income increases, then, other things equal, the demand for automobiles will
increase.
g.
The U.S. income distribution is not fair.
h.
U.S. workers deserve more liberal unemployment benefits.
i.
If interest rates increase, then investment will decrease.
j.
If welfare benefits were reduced, then the country would be better off.
136.
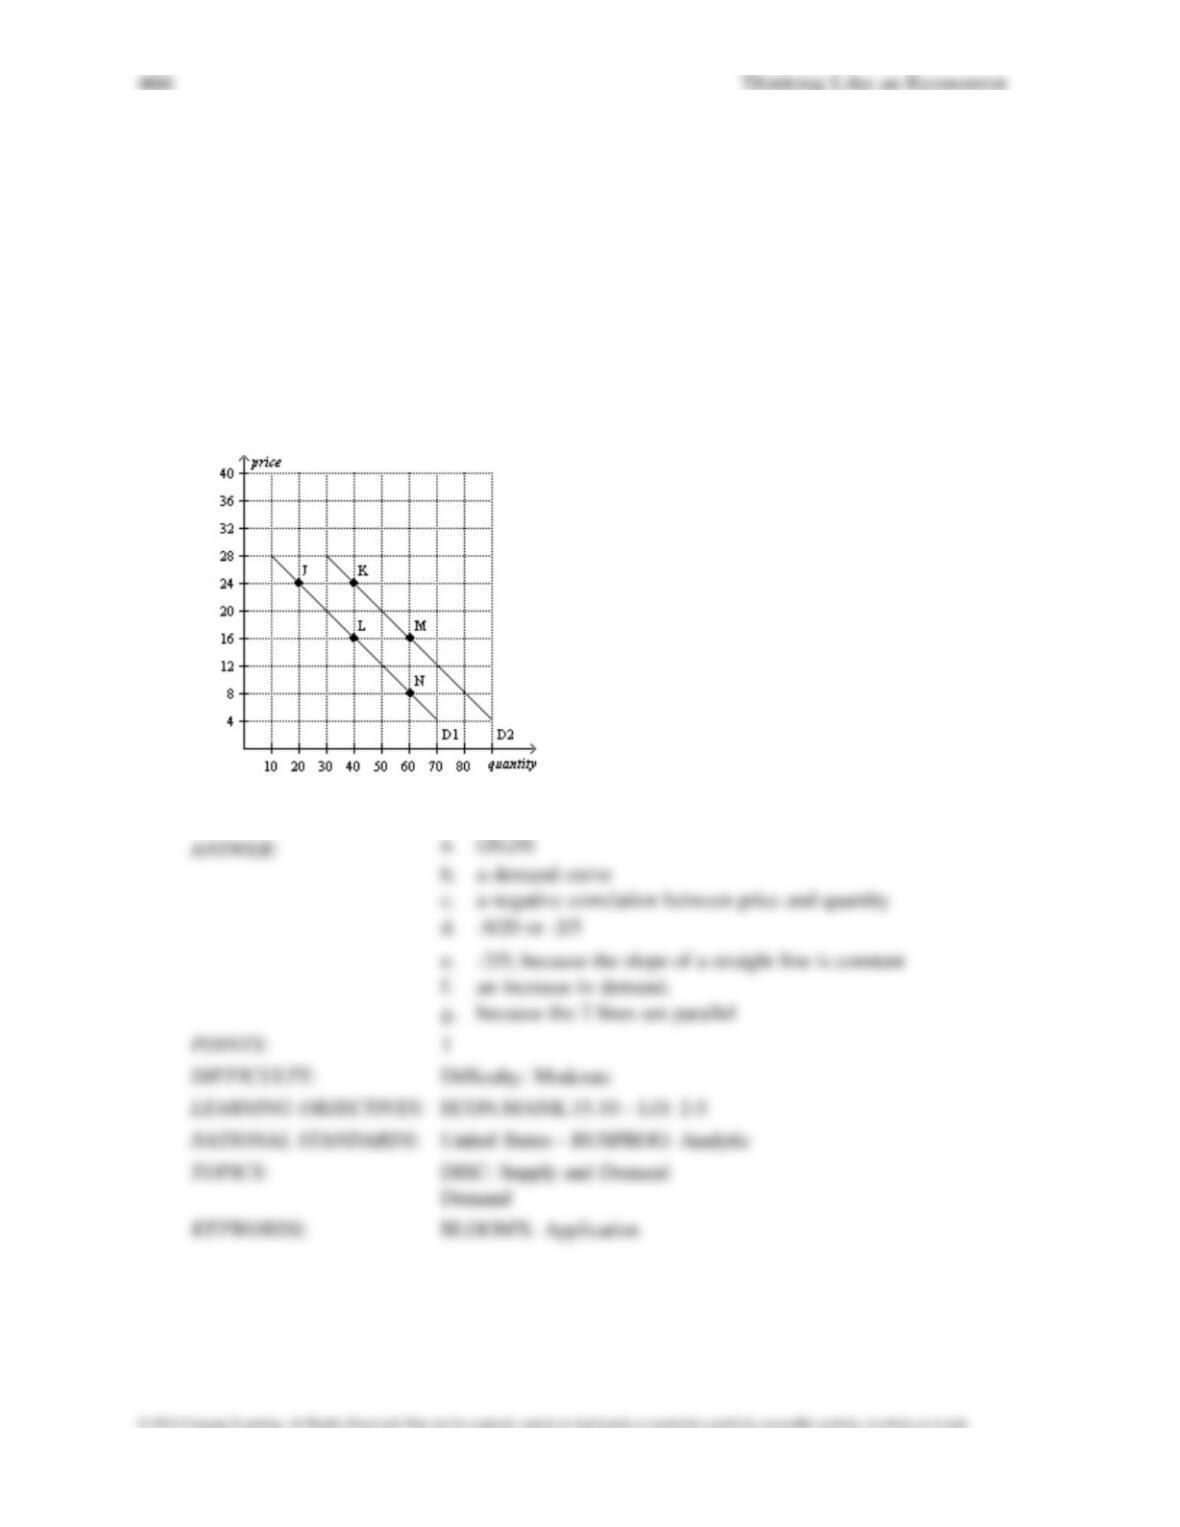
Use the following graph to answer the following questions.
a.
How would point J be represented as an ordered pair?
b.
What type of curve is this?
c.
Does this curve show a positive or negative correlation between price and quantity?
d.
Compute the slope of D1 between points J and L.
e.
What is the slope of D1 between points L and N? Why would you not have to calculate
this
answer?
f.
What is it called if we move from D1 to D2?
g.
How do you know that the slope of D2 is the same as the slope of D1?
Thinking Like an Economist 467
Problems
1.
Like biologists and physicists, economists use the dispassionate development and testing of how the
world works
known as the
2.
As a substitute for laboratory experiments, economists use evidence available through history’s
3.
Suppose a war in the Middle East interrupts the flow of crude oil and oil prices skyrocket around
the world. For
economists, this historical episode serves as a
4.
Just like other scientific models, economic models simplify reality using
5.
The three main factors of production, or categories of inputs, used by firms to produce goods and
services are
6.
In the circular flow diagram, who owns the factors of production and consumes all of the goods and
services
produced?
7.
In the circular flow diagram, when Brian provides labor through the markets for factors of production
to ABC
Company, the flow of money he receives in exchange is called
8.
In the markets for goods and services in the circular flow diagram, households act as
9.
In the circular flow diagram, when Daphne purchases a new mobile phone, she participates in the
markets for
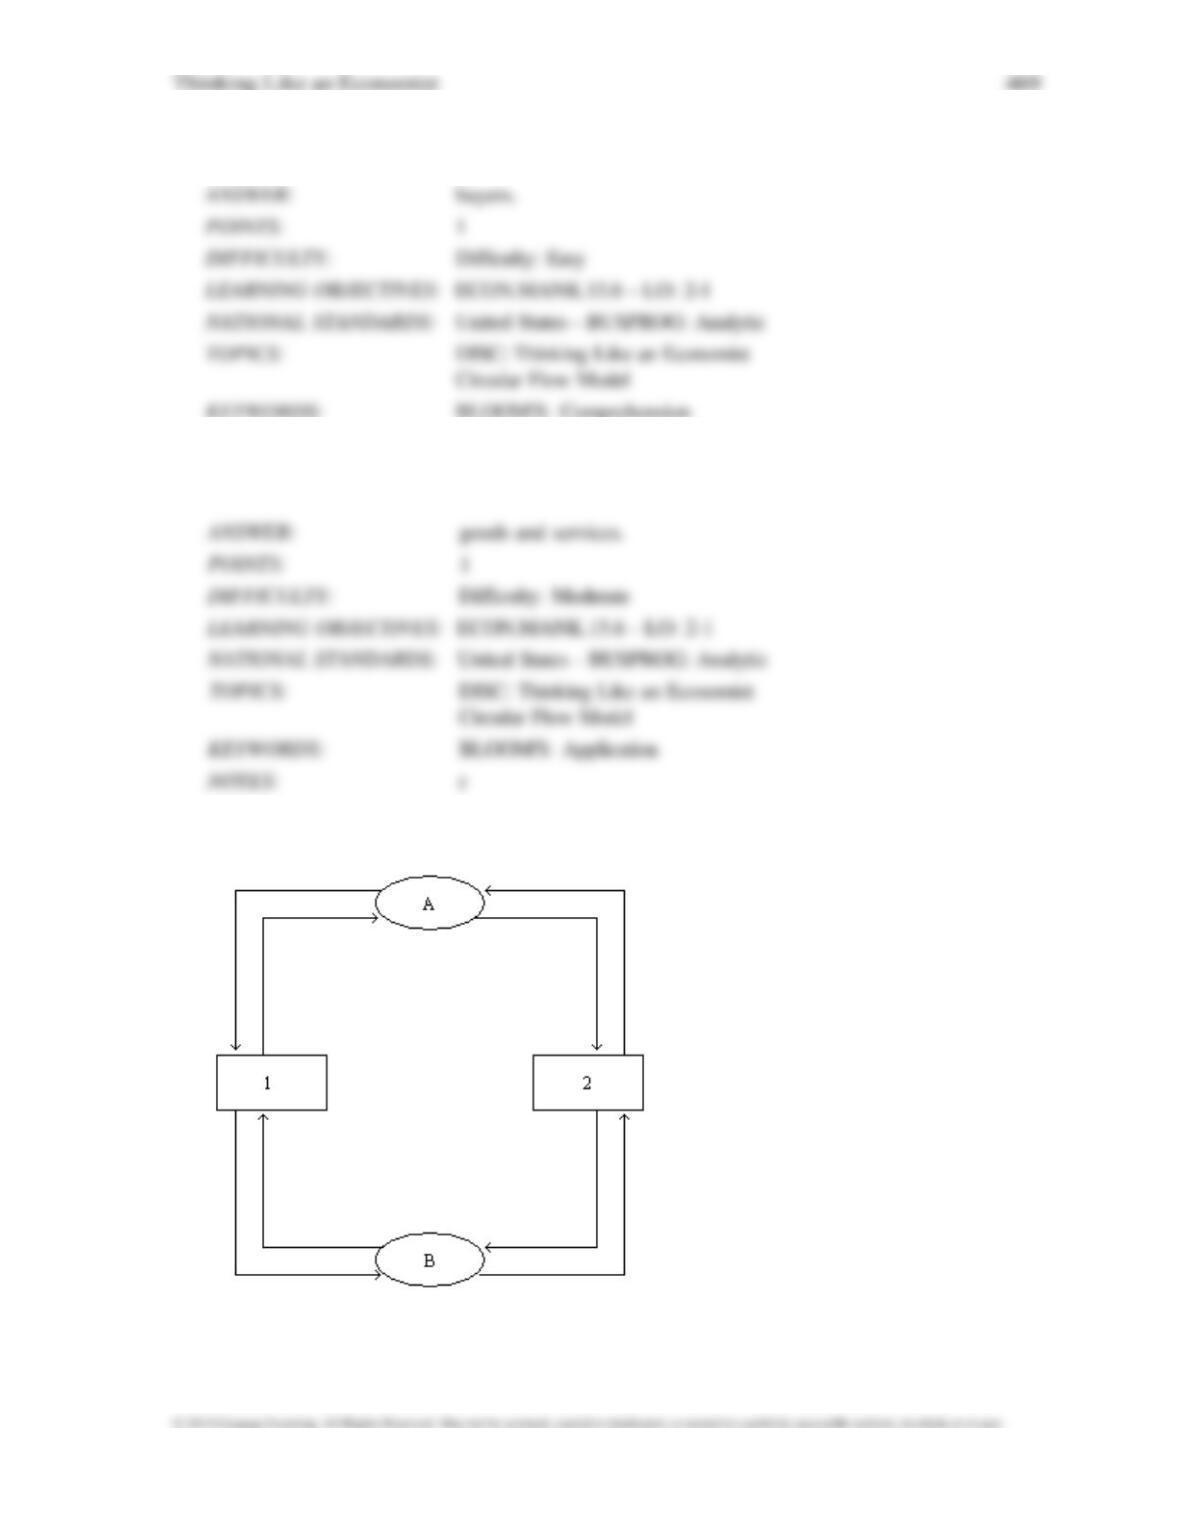
Figure 2-3
10.
Refer to Figure 2-3. What is the name of the model depicted in the figure?
11.
Refer to Figure 2-3. What do the ovals represent in the figure?
12.
Refer to Figure 2-3. What do the rectangles represent in the figure?
13.
Refer to Figure 2-3. What do the outer arrows represent in the figure?
14.
Refer to Figure 2-3. What do the inner arrows represent in the figure?
15.
Refer to Figure 2-3. What does the arrow going from oval A to rectangle 2 represent in the
figure?
16.
Refer to Figure 2-3. What does the arrow going from oval B to rectangle 2 represent in the
figure?
17.
Refer to Figure 2-3. What are two elements not included in this figure that could be included in
a more complex
model?
18.
What you must give up to get something else is called the
Thinking Like an Economist 473
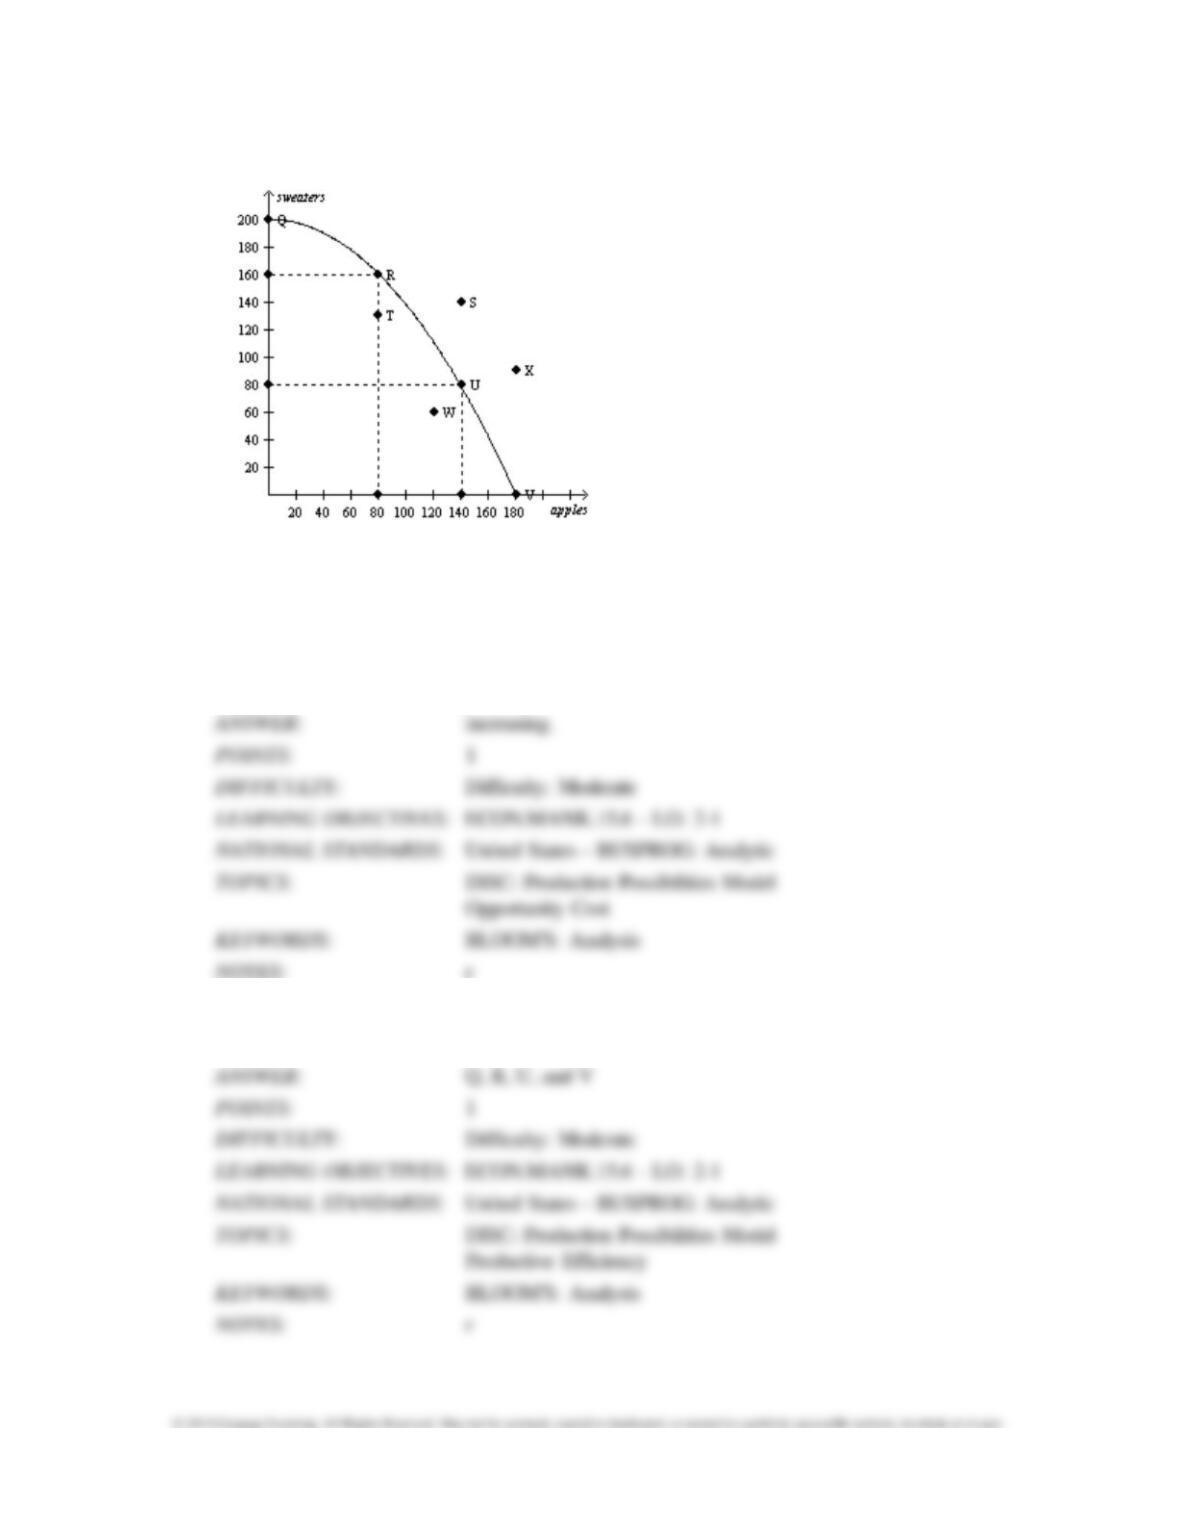
Figure 2–14
Consider the production possibilities curve for a country that can produce sweaters, apples (in
bushels), or a
combination of the two.
19.
Refer to Figure 2–14. The bowed outward shape of the production possibilities curve indicates
that opportunity
cost of apples in terms of sweaters is
20.
Refer to Figure 2–14. Which point(s) on the graph is(are) efficient production possibilities?
21.
Refer to Figure 2-14. Which point(s) on the graph show unemployment of resources?
22.
Refer to Figure 2-14. Which point(s) on the graph is(are) unattainable given current resources
and technology?
23.
Refer to Figure 2-14. What is the opportunity cost of moving from point T to point R?