Exam
Name___________________________________
MULTIPLE CHOICE. Choose the one alternative that best completes the statement or answers the question.
Given the following “data scenario,” decide which type of grouping (single–value, limit, or cutpoint) is probably the best.
1)
Exam Scores: The exam scores, rounded to the nearest whole number, of all students in a given
math course.
1)
A)
None of these
B)
Limit grouping
C)
Cutpoint grouping
D)
Single–value grouping
2)
Number of Pets: The number of pets per family.
2)
A)
Cutpoint grouping
B)
Limit grouping
C)
None of these
D)
Single–value grouping
3)
Wingspan of Cardinal: The wingspan lengths, to the nearest hundredth of a millimeter, of a sample
of 35 cardinals.
3)
A)
Cutpoint grouping
B)
None of these
C)
Single–value grouping
D)
Limit grouping
SHORT ANSWER. Write the word or phrase that best completes each statement or answers the question.
Provide an appropriate response.
4)
Suppose that you wish to construct a stem–and–leaf diagram for the data set below. What
would the stems be?
98 103 146 118 92 128 135 141 136
143 126 111 109 97 124 147 114 119
140 122 92 130 101 148 138 90 123
4)
5)
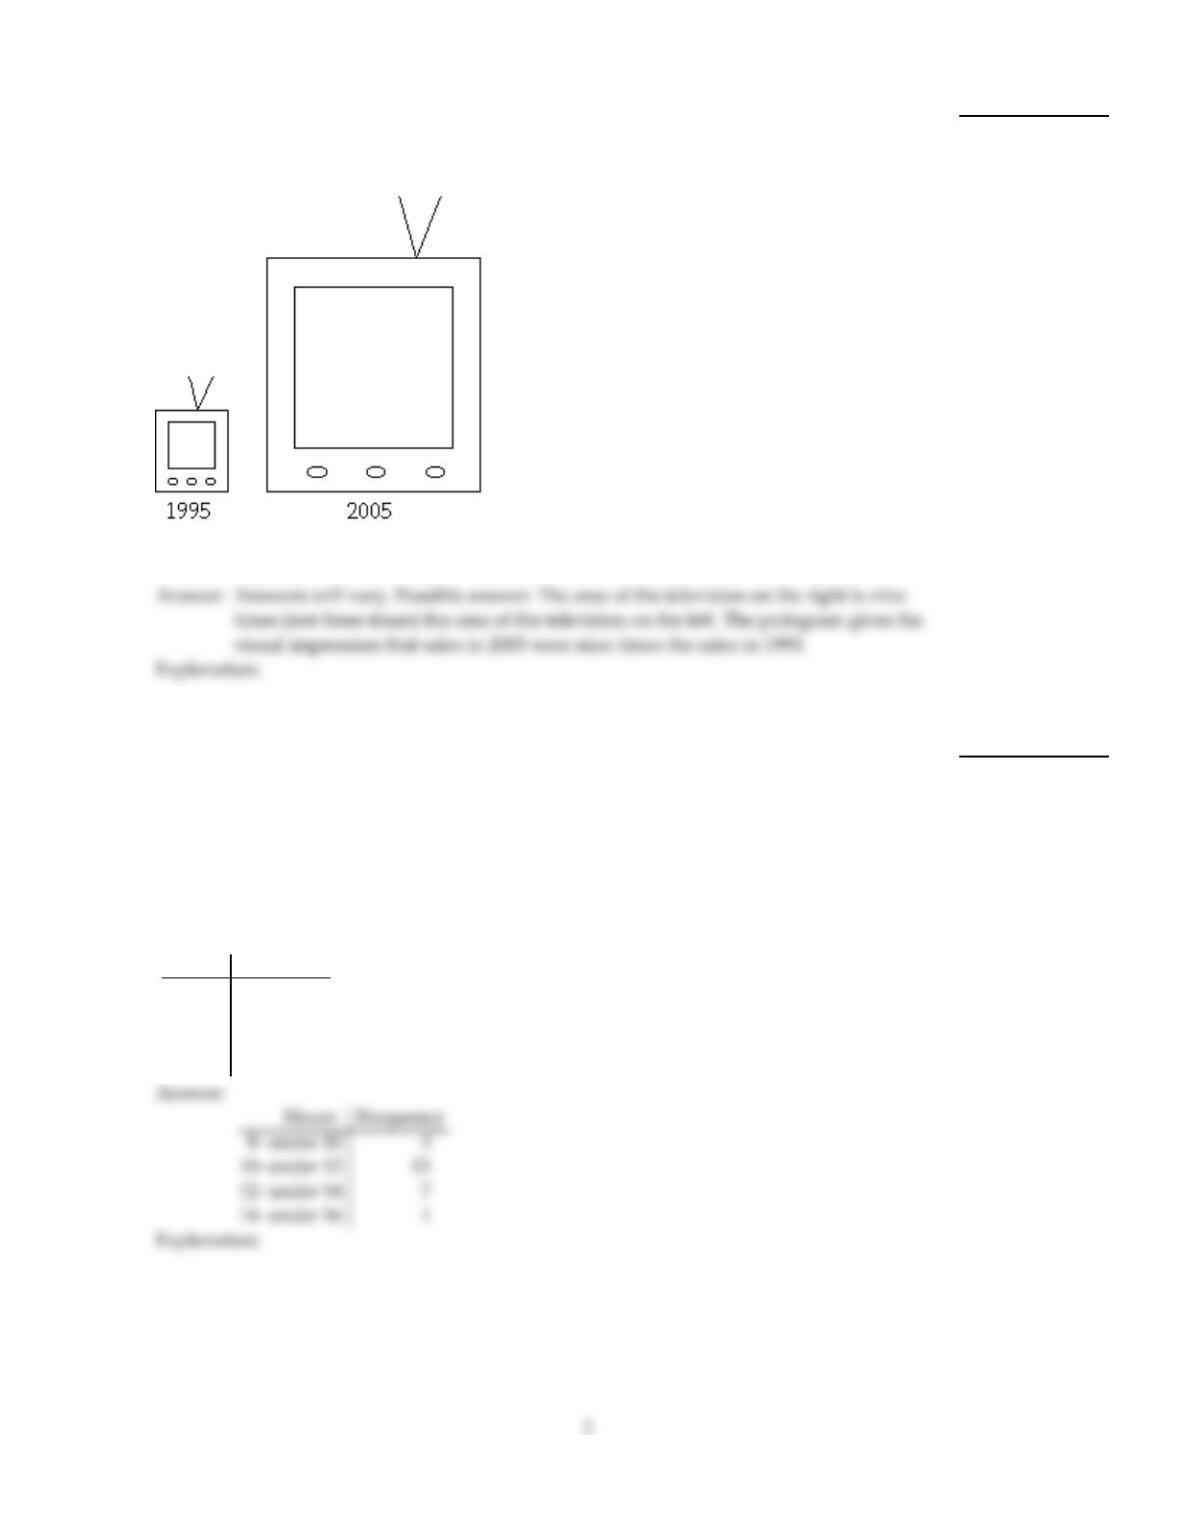
A television manufacturer sold three times as many televisions in 2005 as it did in 1995. To
illustrate this fact, the manufacturer draws a pictogram as shown below. The television on
the right is three times as tall and three times as wide as the television on the left.
Why is this pictogram misleading? What visual impression is portrayed by the pictogram?
5)
Use cutpoint grouping to organize these data into a frequency distribution.
6)
Lori asked 24 students how many hours they had spent doing homework during the
previous week. The results are shown below.
11 10 11 811 11 15 12 11 812 10
10 12 11 10 12 11 10 12 10 12 12 8
Construct a frequency distribution. Use 4 classes, a class width of 2 hours, and a lower limit
of 8 for the first class.
Hours Frequency
6)
Provide an appropriate response.
7)
Scott Tarnowski owns a pet grooming shop. His prices for grooming dogs are based on the
size of the dog. His records from last year are summarized below. Construct a relative
frequency distribution.
Class Frequency
Large 345
Medium 830
Small 645
7)
Use limit grouping to organize these data into a frequency distribution.
8)
Lori asked 24 students how many hours they had spent doing homework during the
previous week. The results are shown below.
10 10 10 810 10 15 13 10 912 10
10 12 10 10 12 10 10 13 10 12 13 8
Construct a frequency distribution. Use 4 classes, a class width of 2 hours, and a lower limit
of 8 for the first class.
Hours Frequency
8)
Provide an appropriate response.
9)
Suppose that a data set has a minimum value of 28 and a maximum value of 73 and that
you want 5 classes. Explain how to find the class width for this frequency distribution.
What happens if you mistakenly use a class width of 9 instead of 10?
9)
3
Use cutpoint grouping to organize these data into a frequency distribution.
10)
On a math test, the scores of 24 students were
92 73 77 61 77 77 92 86 77 63 87 73
73 87 77 73 87 77 73 86 73 87 86 61
Construct a frequency distribution. Use 4 classes beginning with a lower class limit of 60.
Score Frequency
10)
Provide an appropriate response.
11)
A random sample of federal income tax returns is selected from the 2006 returns and a
frequency histogram is constructed for the amount of federal income tax paid in 2006. The
classes used to construct the histogram are 0 3000, 3000 6000, 6000 9000, and so on.
What do you think the shape of the histogram will be? Explain your thinking.
11)
12)
Suppose that you want to construct a pie chart to represent the following data.
Blood Type Frequency
O90
A84
B18
AB 8
Explain how you would calculate the angle for the pie–shaped piece corresponding to the
blood type O.
12)
13)
A population has a J–shaped distribution. Two different samples of size 12 are picked from
the population. Two different samples of size 1000 are then picked from the population.
Do you think that the distribution of the two samples of size 12 will have roughly the same
shape? Do you think that the distribution of the two samples of size 1000 will have roughly
the same shape? Explain your thinking.
13)
Use cutpoint grouping to organize these data into a frequency distribution.
14)
Kevin asked some of his friends how many hours they had worked during the previous
week at their after–school jobs. The results are shown below.
5 6 5 3 5 5 9 7 5 4 7 6
6 7 5 6 7 5 6 7 6 7 7 3
Construct a frequency distribution. Use 4 classes, a class width of 2 hours, and a lower limit
of 3 for the first class.
Hours Frequency
14)
Provide an appropriate response.
15)
Explain in your own words the difference between a bar graph and a histogram. Give an
example of data for which you might use a histogram and an example of data for which
you might use a bar graph.
15)
Use limit grouping to organize these data into a frequency distribution.
16)
A medical research team studied the ages of patients who had strokes caused by stress. The
ages of 34 patients who suffered stress strokes were as follows.
29 30 36 41 45 50 57 61 28 50 36 58
60 38 36 47 40 32 58 46 61 40 55 32
61 56 45 46 62 36 38 40 50 27
Construct a frequency distribution for these ages. Use 8 classes beginning with a lower class
limit of 25 and class width of 5.
Age Frequency
16)
Construct the requested histogram.
17)
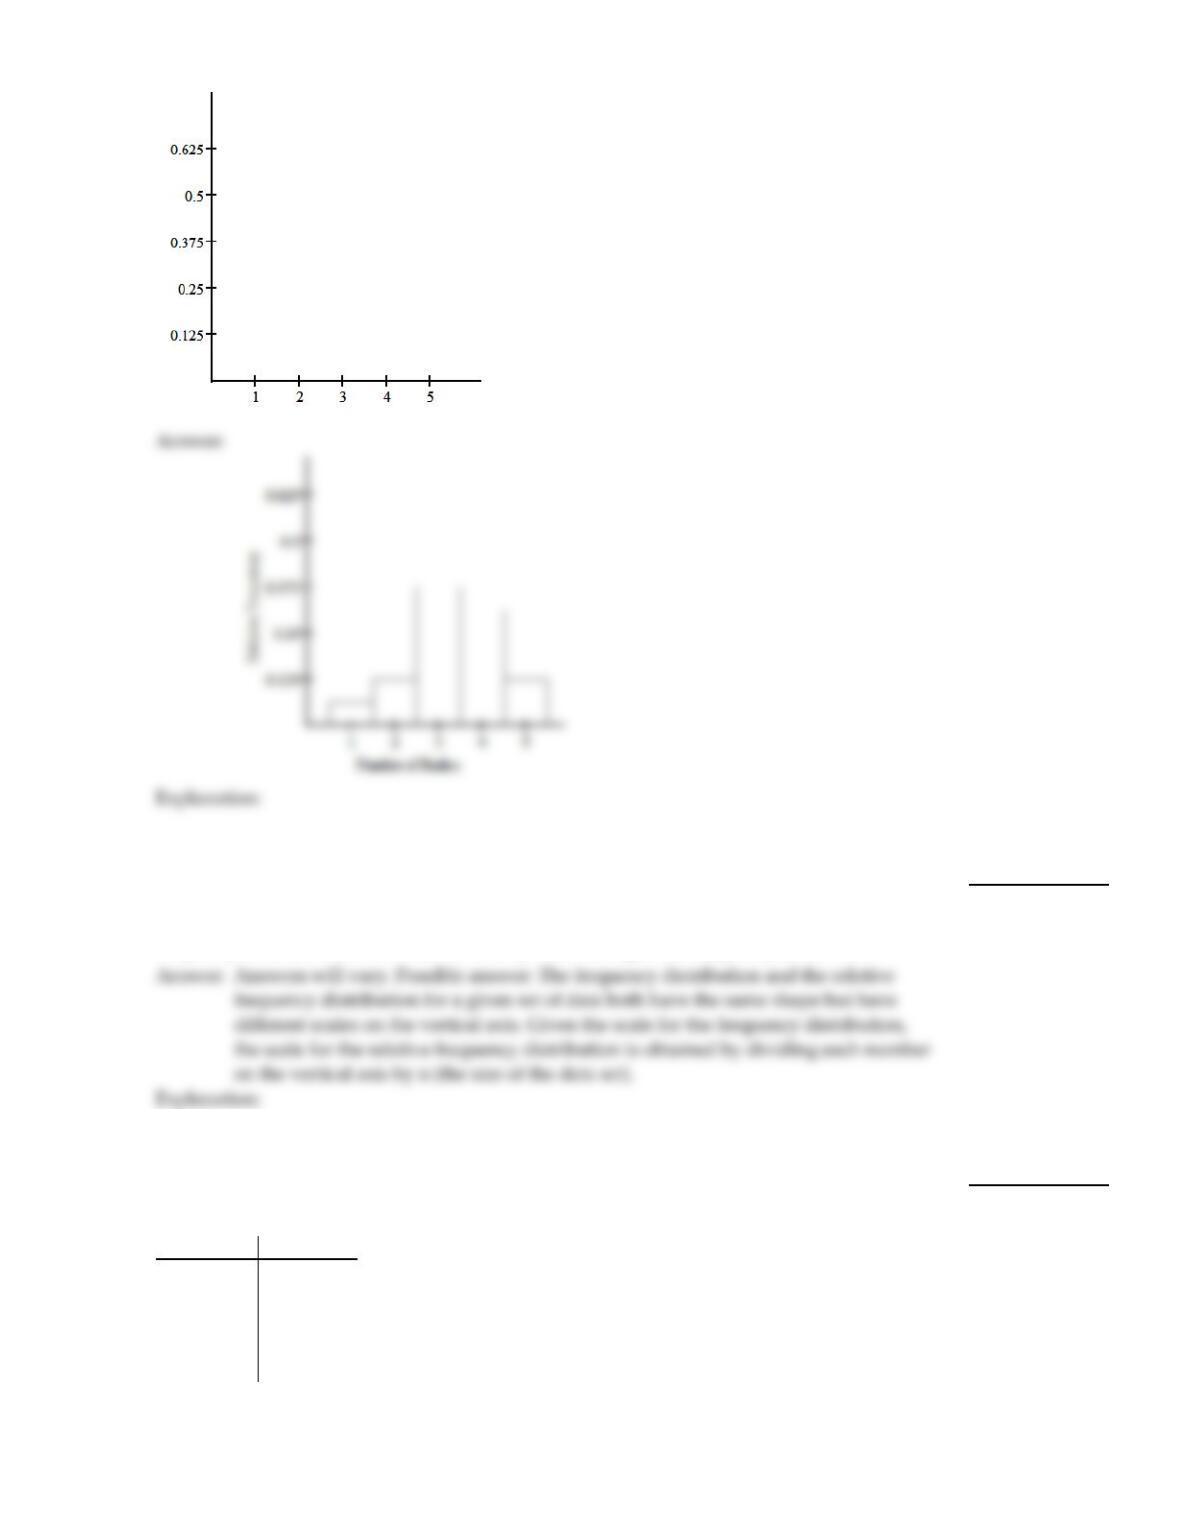
The table gives the frequency distribution for the data involving the number of radios per
household for a sample of 80 U.S. households.
# of Radios Frequency
1 5
2 10
3 30
4 25
5 10
Construct a relative frequency histogram.
17)
6
Provide an appropriate response.
18)
Explain the difference between a frequency distribution and a relative frequency
distribution. Comment on the differences on the vertical axis scale. Given the same data set
and the same classes, will the shapes of the frequency distribution and the relative
frequency distribution be the same? You may draw a diagram to support your answer.
18)
Construct the requested histogram.
19)
The table gives the frequency distribution for the data involving the number of radios per
household for a sample of 80 U.S. households.
# of Radios Frequency
1 5
2 10
3 30
4 25
5 10
19)
7
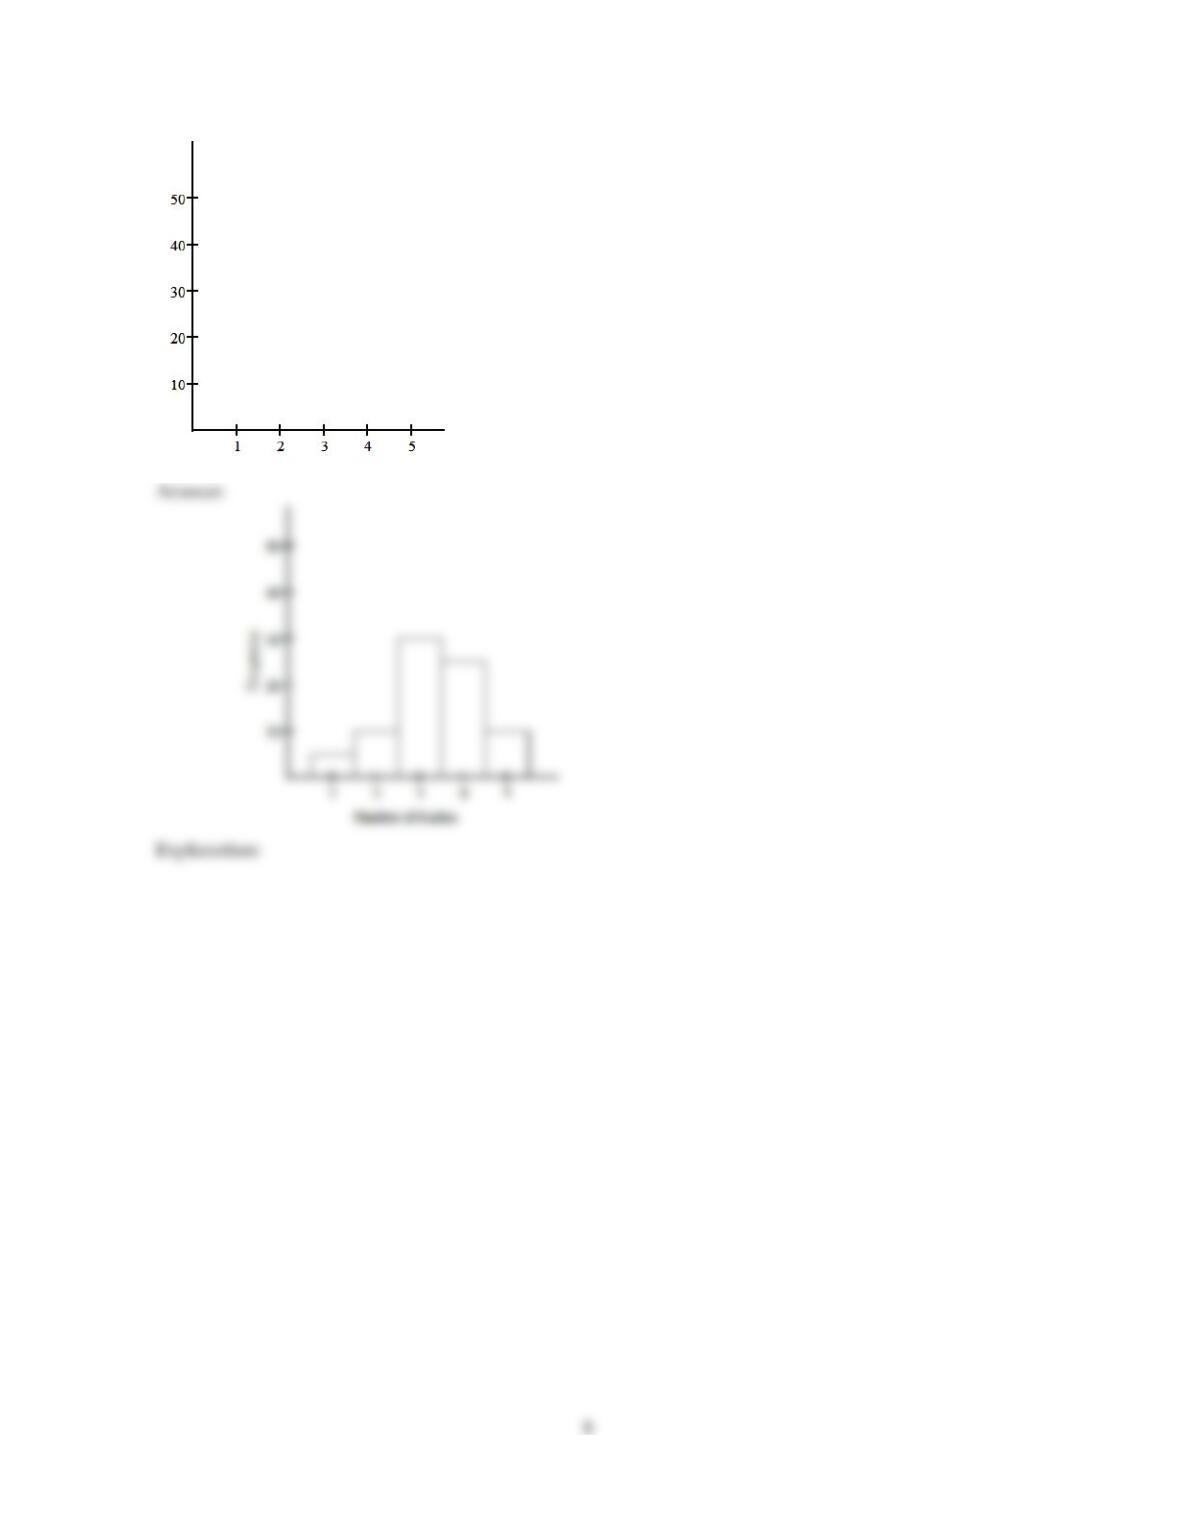
Construct a frequency histogram.
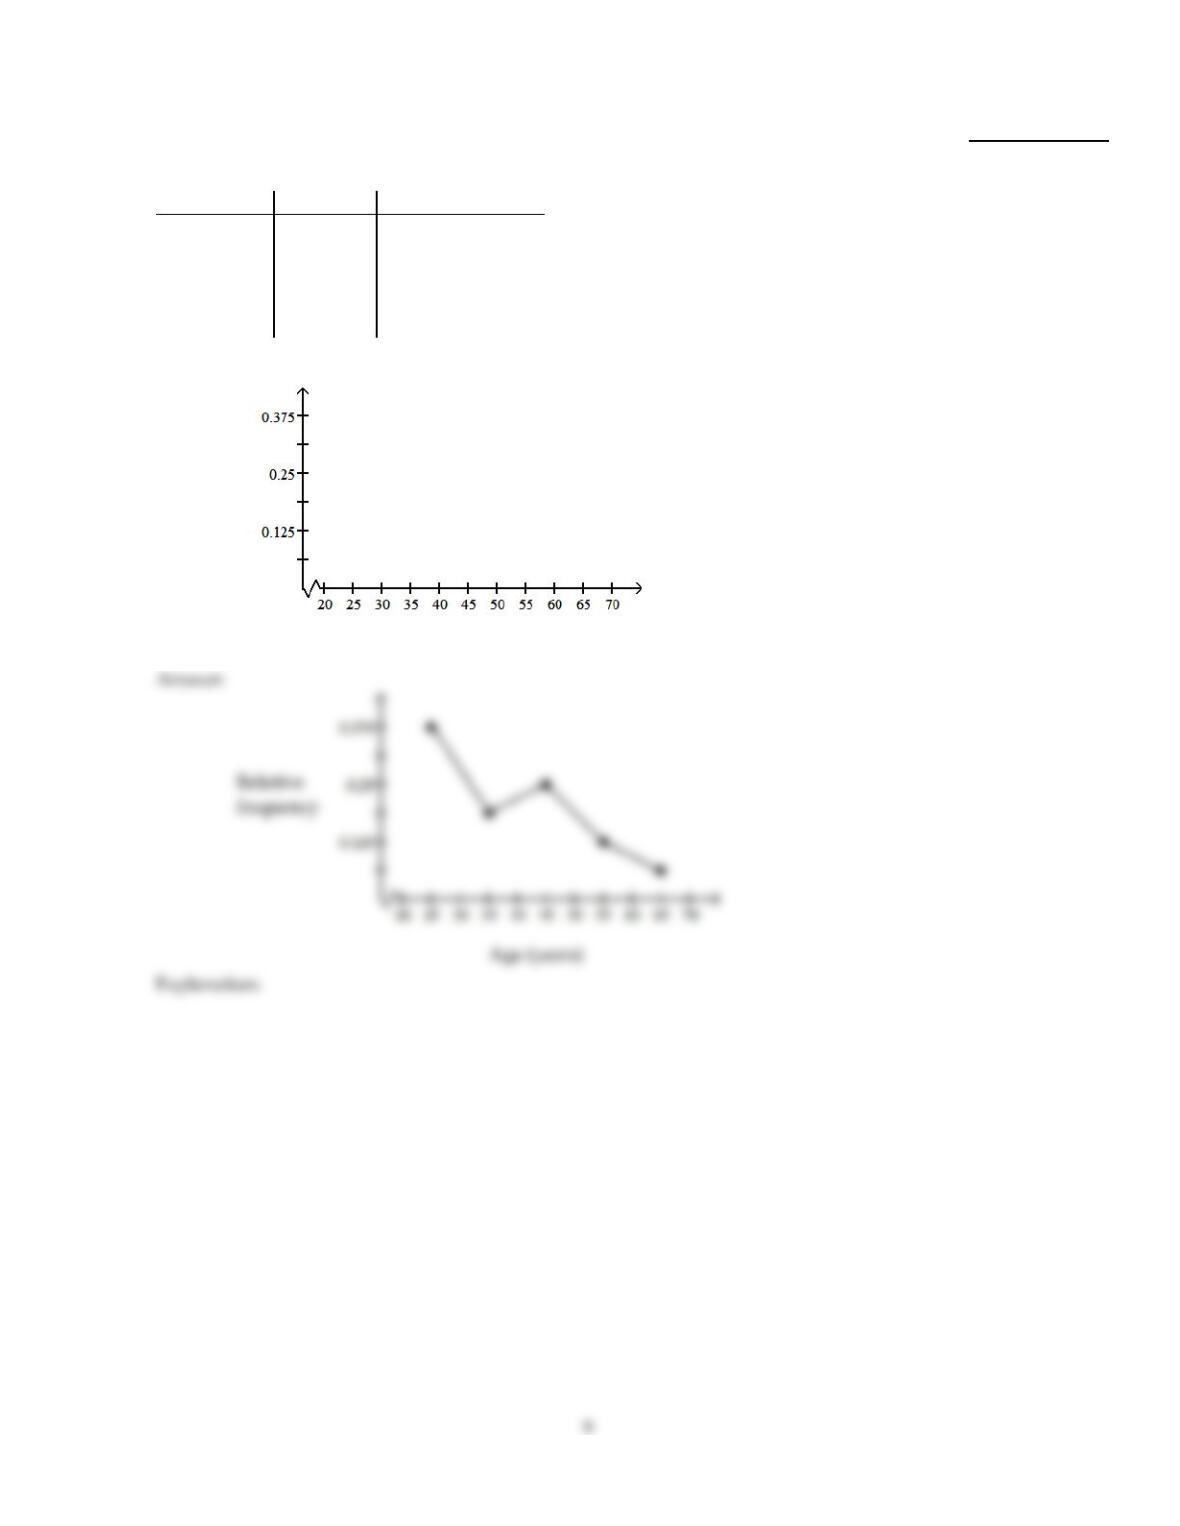
Construct a relative–frequency polygon for the given data.
20)
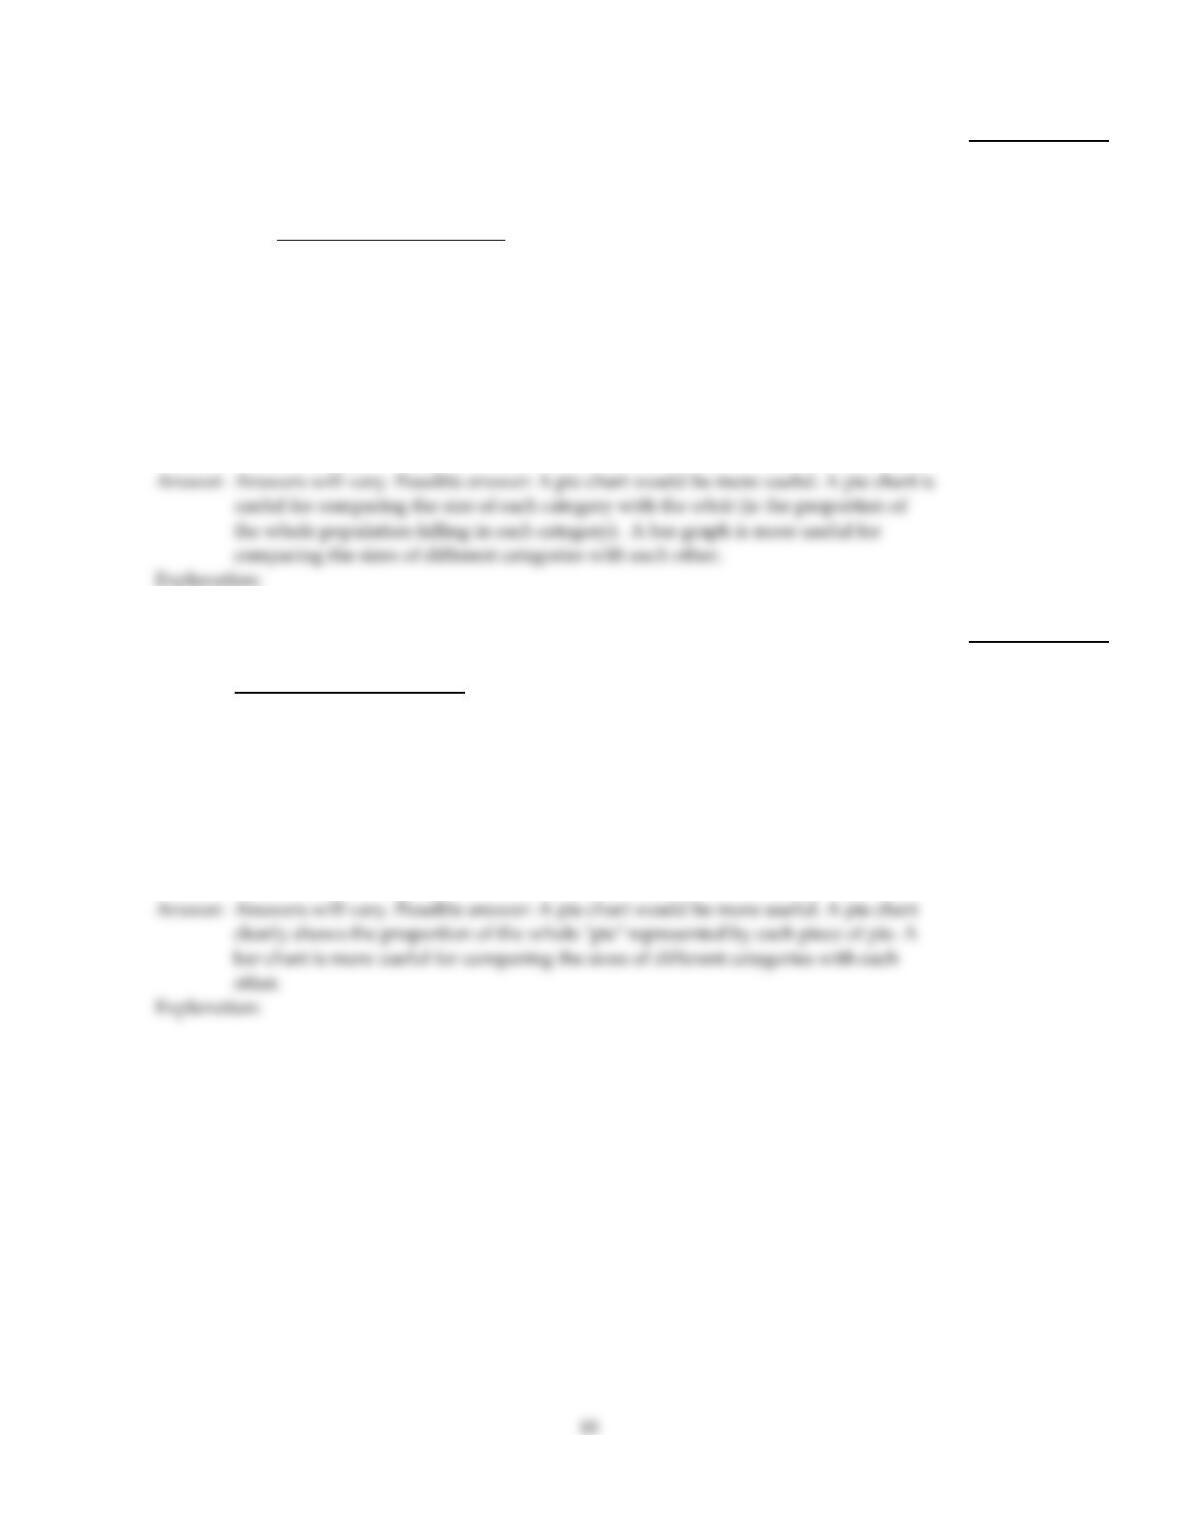
The table contains the frequency and relative–frequency distributions for the ages of the
employees in a particular company department.
Age (years) Frequency Relative frequency
20–under 30 60.375
30–under 40 30.1875
40–under 50 40.25
50–under 60 20.125
60–under 70 10.0625
Relative
frequency
Age (years)
20)
Provide an appropriate response.
21)
Shortly before an election, a market research firm took a poll to find out whether people
were planning to vote for or against a particular ballot measure. The results are shown
below.
Position Frequency
Against 3087
In favor 3691
Undecided 910
The ballot measure will pass if a simple majority (more than 50%) vote in favor of the
measure. You wish to construct a graph to represent the data. It should be easy to see from
your graph whether more than 50% of the people are planning to vote in favor of the
measure. Which graph would be more useful, a bar graph or a pie chart? Explain your
thinking.
21)
22)
Suppose that you want to construct a graph to represent the following data.
Blood Type Frequency
O90
A84
B18
AB 8
If you are mostly interested in the number of people in each category as a percentage of the
total number of people, would a bar chart or a pie chart be more useful? Explain your
thinking.
22)
Use limit grouping to organize these data into a frequency distribution.
23)
Kevin asked some of his friends how many hours they had worked during the previous
week at their after–school jobs. The results are shown below.
6 6 6 4 6 6 9 7 6 3 7 6
6 7 6 6 7 6 6 7 6 7 7 4
Construct a frequency distribution. Use 4 classes, a class width of 2 hours, and a lower limit
of 3 for the first class.
Hours Frequency
23)
Provide an appropriate response.
24)
Suppose you wanted to construct a stem–and–leaf diagram for the data set below. What
leaf unit would you use? What numbers would the stems represent and how many stems
would there be?
3.13 3.24 3.37 3.28 3.16 3.42 3.44 3.39
3.24 3.14 3.35 3.21 3.45 3.37 3.10 3.40
24)
25)
Raul set up a frequency distribution with the following classes:
Weight (lb) Frequency
20–under 25
25–under 30
30–under 35
Give an alternate way of depicting these classes if the original data are given:
a. To the nearest whole number
b. To one decimal place
c. To two decimal places
25)
26)
Which type of graph, a stem–and–leaf diagram or a frequency histogram, would be more
useful for the data set below? Explain your thinking.
2.3 3.2 5.1 6.3 7.3 7.7 8.1 8.9 9.3
9.5 10.2 11.1 12.7 14.7 15.6 16.4 18.6 19.1
26)
Construct the requested histogram.
27)
The table gives the frequency distribution for the data involving the number of television
sets per household for a sample of 100 U.S. households.
# of TVs Frequency
1 25
2 45
3 15
4 10
5 5
Construct a frequency histogram.
27)
12
28)
The table below shows the number of days off in a given year for 30 police detectives.
Days off Frequency
0–under 2 10
2–under 4 1
4–under 6 7
6–under 8 7
8–under 10 1
10–under 12 4
Construct a frequency histogram.
28)
13
Use cutpoint grouping to organize these data into a frequency distribution.
29)
The following figures represent Jennifer’s monthly charges for long distance telephone
calls for the past twelve months.
8.98 11.90 13.82 16.77
10.66 16.60 9.64 13.00
15.11 13.55 13.84 10.88
Construct a frequency distribution with 4 classes.
Charges Frequency
29)
Provide an appropriate response.
30)
The heights of adult women have a bell–shaped distribution. Give an example of a data set
whose distribution is likely to be right skewed. Explain why you think the distribution will
be skewed to the right.
30)
31)
The mayor of one city has been conducting an anti–smoking campaign in high schools.
Each year local government researchers estimate the number of teenagers in the city who
smoke. The number of smokers has declined steadily in each of the past five years. The
mayor’s office constructs a bar graph showing the number of teenage smokers in each of
the past five years. If the mayor wished to exaggerate the success of his anti–smoking
campaign, would it be to his advantage to truncate the bar graph? Explain your thinking.
31)
32)
The results of a survey about a recent judicial appointment are given in the table below.
Construct a relative frequency distribution.
Response Frequency
Strongly Favor 17
Favor 38
Neutral 33
Oppose 8
Strongly Oppose 104
32)
33)
The heights of adult women have a bell–shaped distribution. Give examples of three other
data sets whose distributions are likely to be bell–shaped.
33)
34)
When organizing data into tables, what is the disadvantage of having too many classes?
What is the disadvantage of having too few classes?
34)
35)
A high school teacher keeps a record of the number of days that each student attended
school last year and then she constructs a relative frequency histogram. What do you think
the shape of the distribution will be? Why?
35)
36)
Construct a stem–and–leaf diagram for the data set below. Round each number to the
nearest whole number before constructing the diagram. Why is it necessary to first round
the numbers?
192.3 213.2 235.1 216.7 187.9 231.7 238.1 188.9 209.3
219.4 190.2 191.1 212.7 224.7 195.6 187.0 220.6 207.1
36)
Construct the requested histogram.
37)
The table below shows the number of days off in a given year for 30 police detectives.
Days off Frequency Relative frequency
0–under 2 10 0.333
2–under 4 10.033
4–under 6 10.233
6–under 8 70.233
8–under 10 10.033
10–under 12 40.133
Construct a relative–frequency histogram.
37)
17
Provide an appropriate response.
38)
Maria constructed the frequency distribution shown below. The data represent the heights
of 60 randomly selected women.
Height Frequency
54–under 60 7
60–under 61 1
61–under 62 3
62–under 63 5
63–under 64 7
64–under 65 7
65–under 66 6
66–under 72 24
She concluded from her frequency distribution that the heights 66, 67, 68, 69, 70,
and 71 inches are the most common for women. What is wrong with her conclusion? How
is her frequency distribution misleading and how could the table be improved?
38)
39)
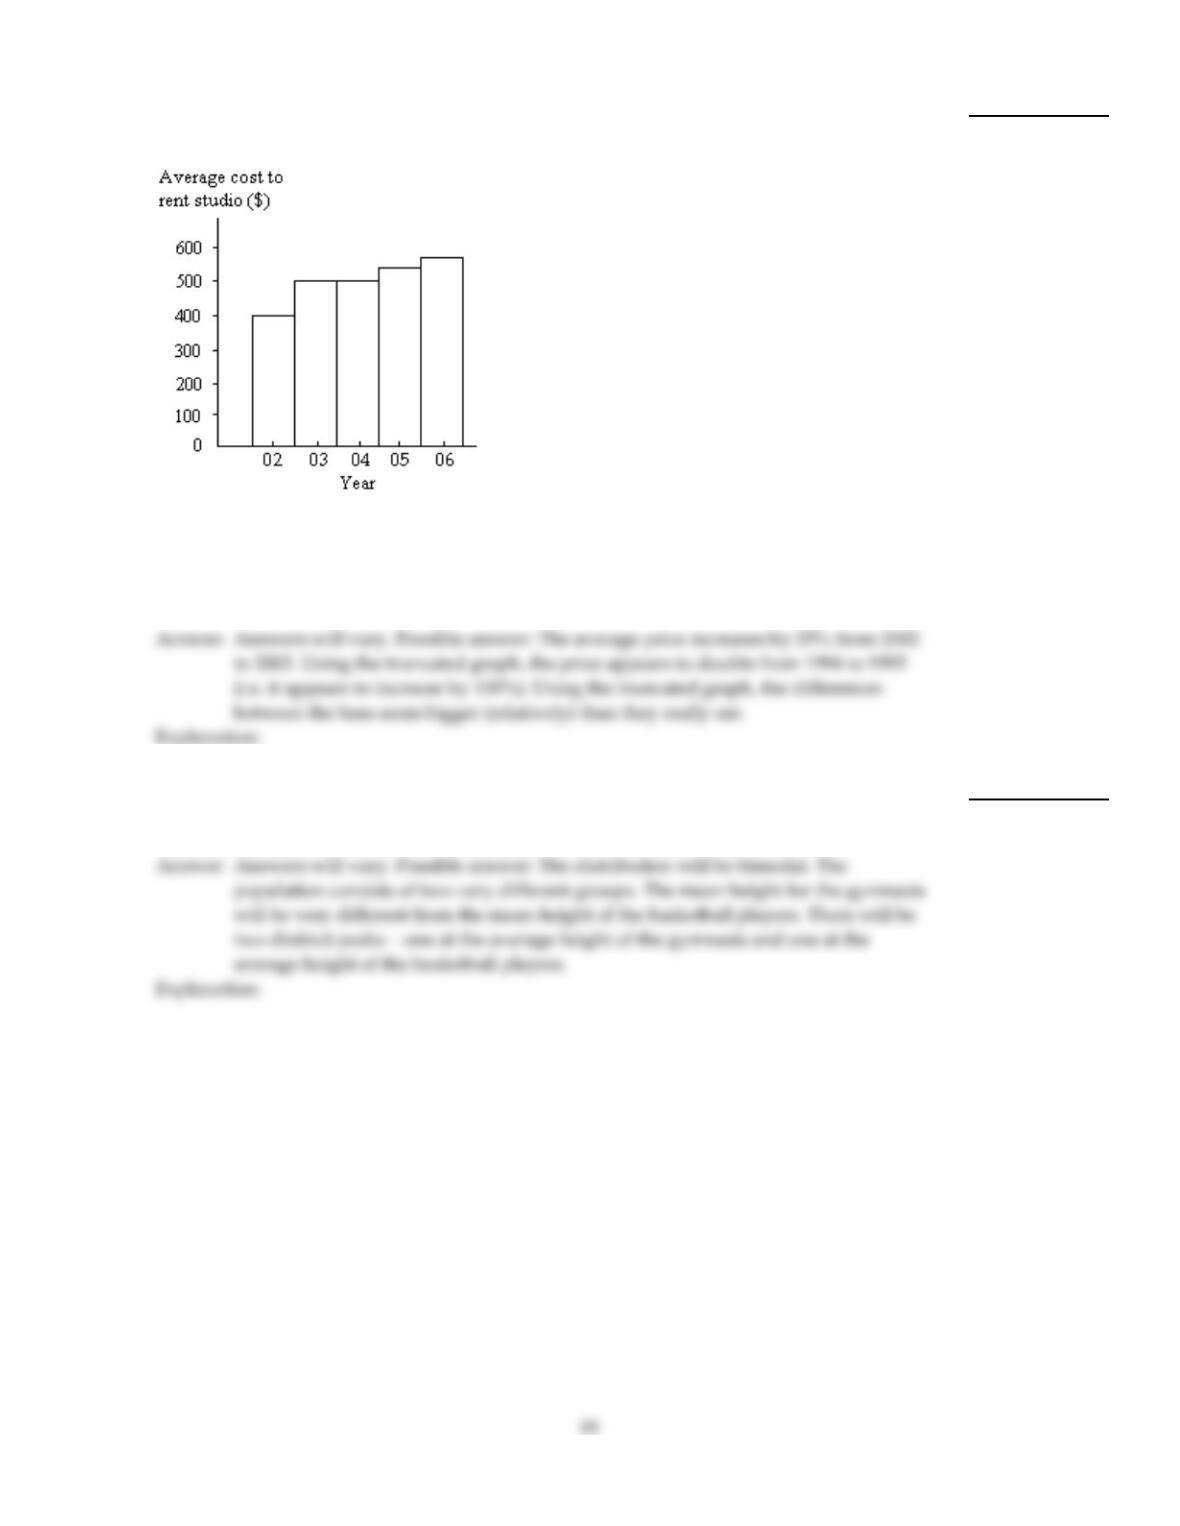
The bar graph below shows the average cost of renting a studio in one city in each of the
years 2002 through 2006.
By what percentage does the average price increase from 2002 to 2003? Obtain a truncated
version of the graph by sliding a piece of paper over the bottom of the graph so that the
bars start at 300. In the truncated graph, by what percentage does the price appear to
increase from 2002 to 2003? Why is the truncated graph misleading?
39)
40)
Suppose that a group of professional athletes consists of 100 gymnasts and 100 basketball
players. What kind of distribution do you think the heights of the athletes would have?
Explain your thinking.
40)
Use cutpoint grouping to organize these data into a frequency distribution.
41)
A government researcher was interested in the starting salaries of humanities graduates. A
random sample of 30 humanities graduates yielded the following annual salaries. Data are
in thousands of dollars, rounded to the nearest hundred dollars.
23.1 24.0 33.7 28.4 36.0 41.0 22.2 21.8 30.5 49.2
30.1 25.2 38.3 46.1 40.0 27.5 24.9 28.0 31.8 29.9
25.7 32.5 48.6 27.4 41.4 35.9 31.9 42.4 26.3 33.0
Construct a frequency distribution for these annual starting salaries. Use 20 as the first
cutpoint and classes of equal width 4.
Salary Frequency
41)
Provide an appropriate response.
42)
Shortly before a mayoral election, a market research firm took a poll to find out which
candidate people were planning to vote for. The results are shown below.
Candidate Frequency
Li Fong 2120
Bob Green 2329
Sue Moore 1042
Jose Alvarez 399
You wish to construct a graph to represent the data. It should be easy to see from your
graph which candidate is in the lead. Which graph would be more useful, a bar graph or a
pie chart? Explain your thinking.
42)
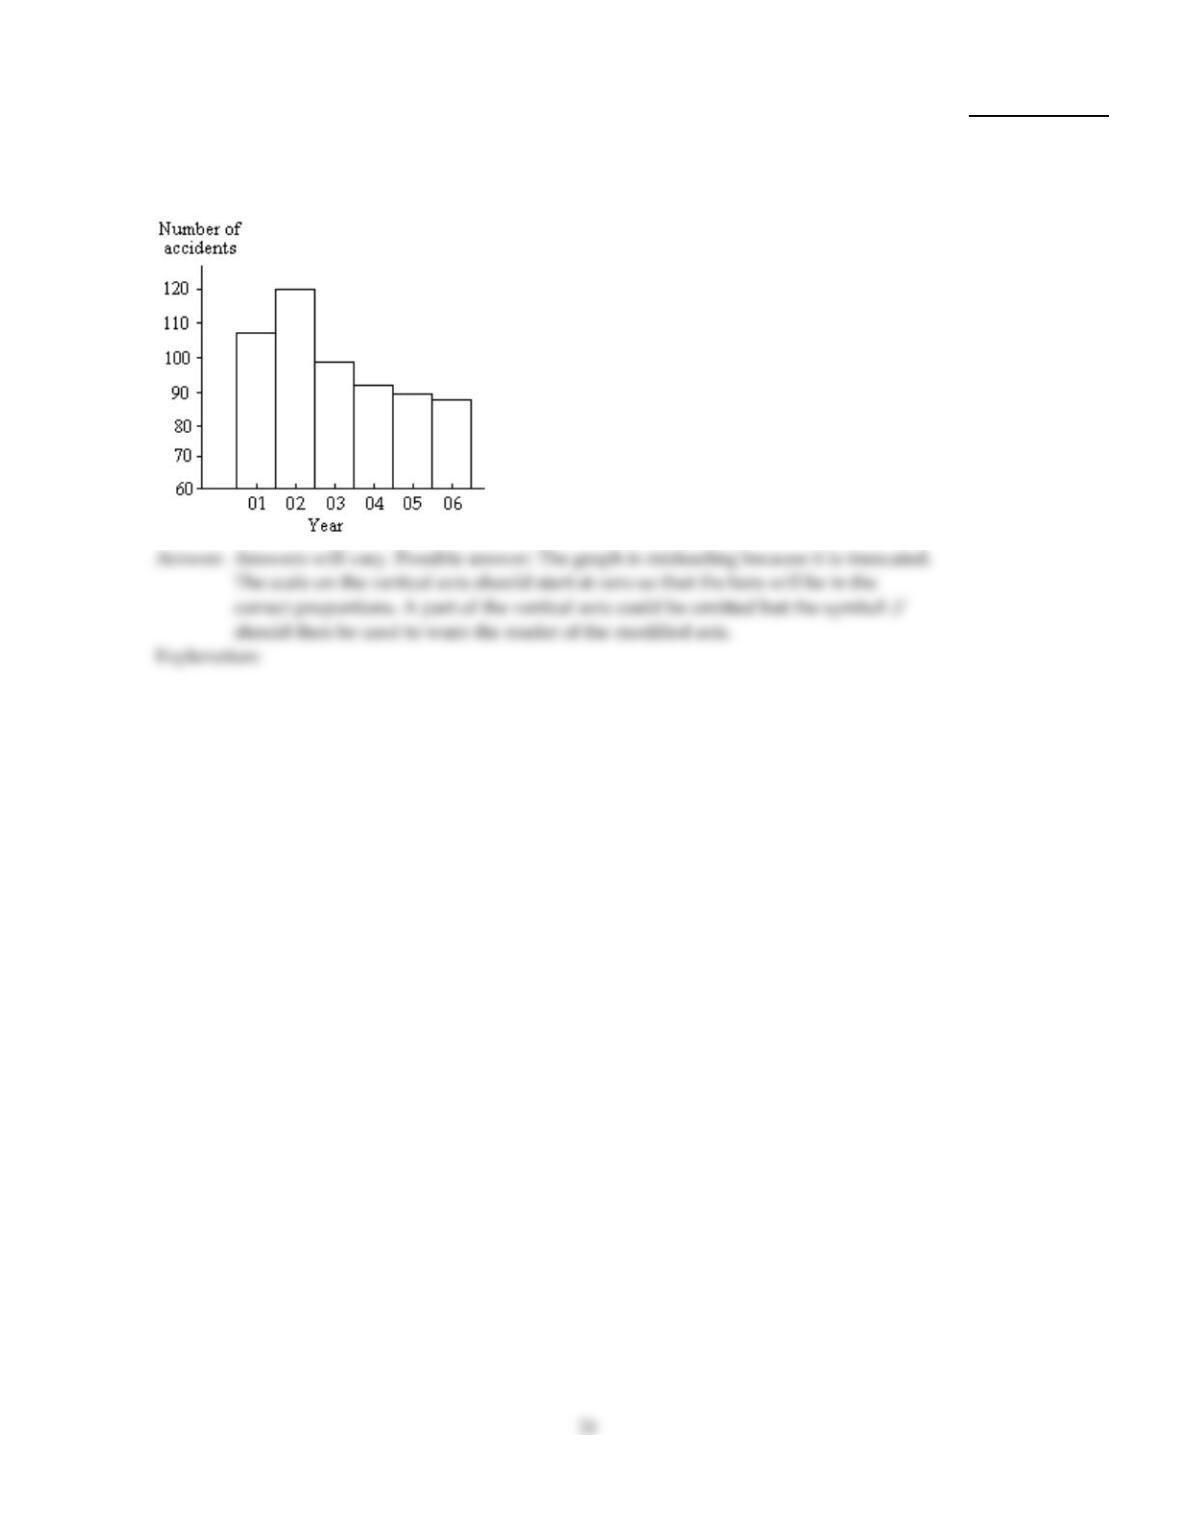
43)
The bar graph below shows the number of car accidents occurring in one city in each of the
years 2001 through 2006. The number of accidents dropped in 2003 after a new speed limit
was imposed. Why is the graph misleading? How would you redesign the graph to be less
misleading?
43)
Construct the requested histogram.
44)
During the quality control process at a manufacturing plant, 142 finished items are
randomly selected and weighed. The results are summarized in the table below. Construct
a relative–frequency histogram corresponding to data below.
Weight (g) Frequency Relative frequency
0.35–under 0.45 32 0.225
0.45–under 0.55 82 0.577
0.55–under 0.65 17 0.120
0.65–under 0.75 11 0.077
44)
Provide an appropriate response.
45)
Anna set up a frequency distribution with the following classes:
Number of sick days taken Frequency
0–3
3–6
6–9
9–12
What is wrong with these classes? Describe two ways the classes could have been correctly
depicted.
45)
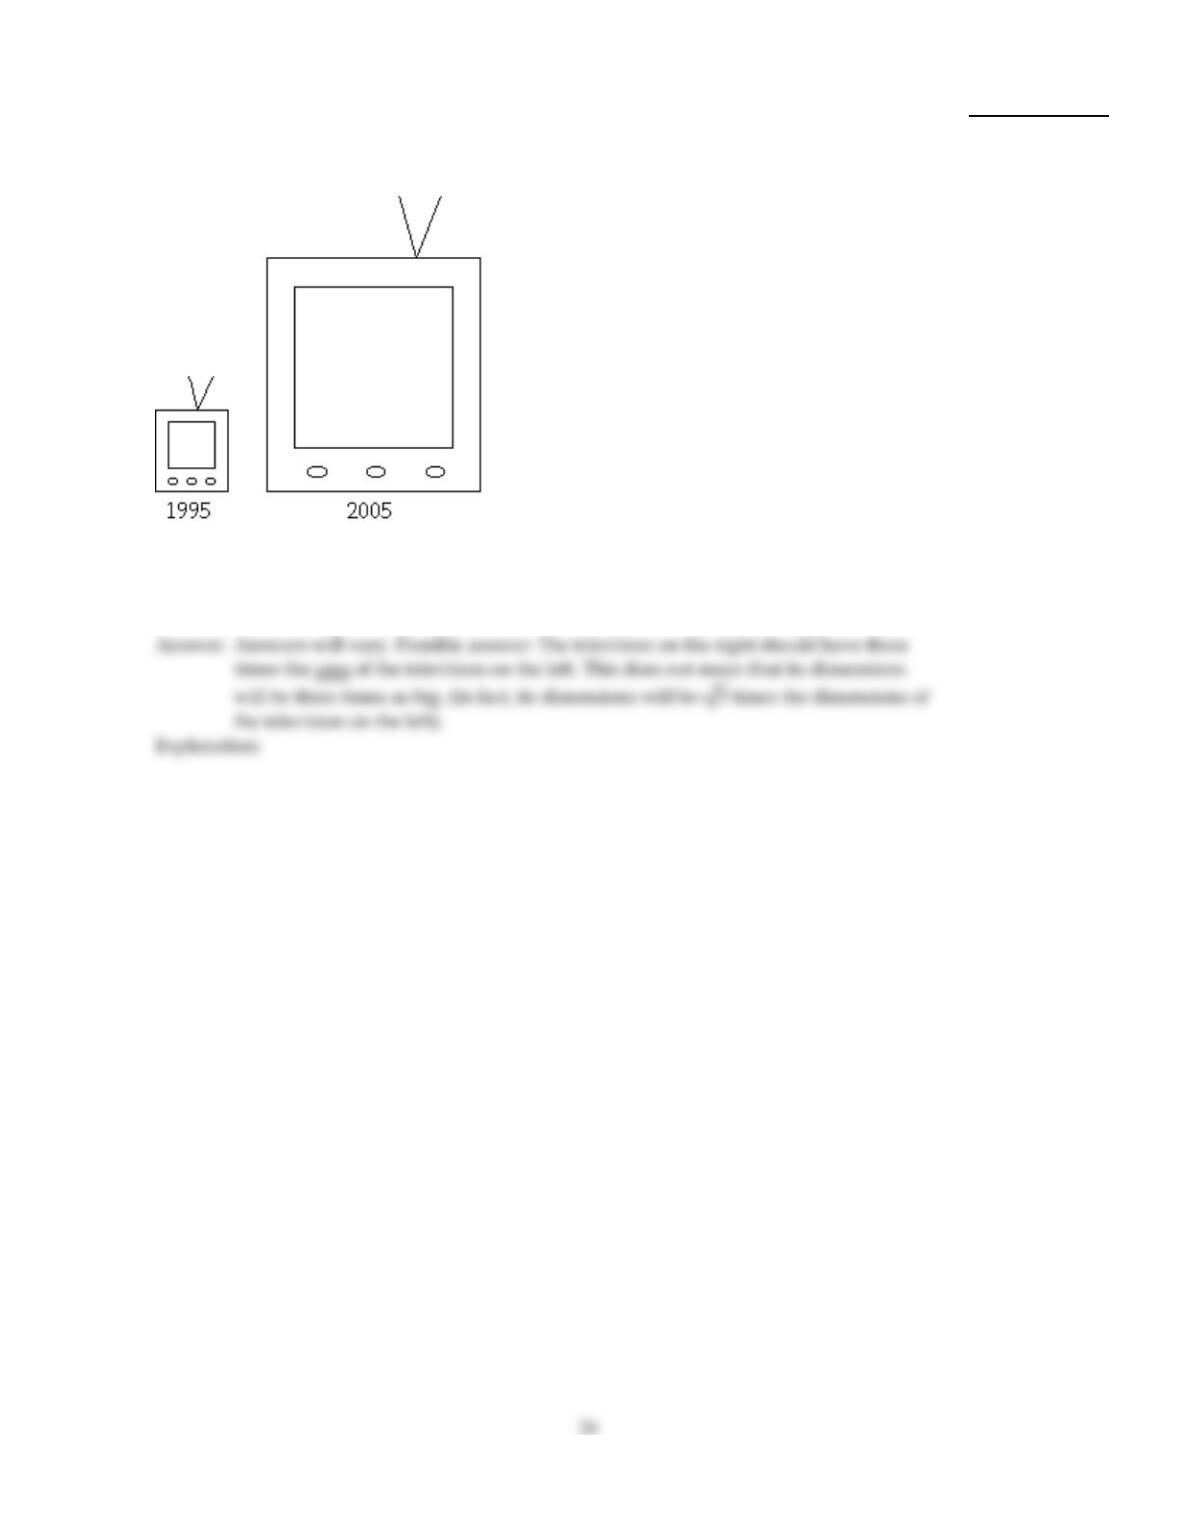
46)
A television manufacturer sold three times as many televisions in 1995 as it did in 1985. To
illustrate this fact, the manufacturer draws a pictogram as shown below. The television on
the right is three times as tall and three times as wide as the television on the left.
This pictogram is misleading because it actually gives the visual impression that nine
times as many televisions were sold in 2005 as in 1995. How can the manufacturer
correctly illustrate the fact that sales in 2005 were three times sales in 1995?
46)
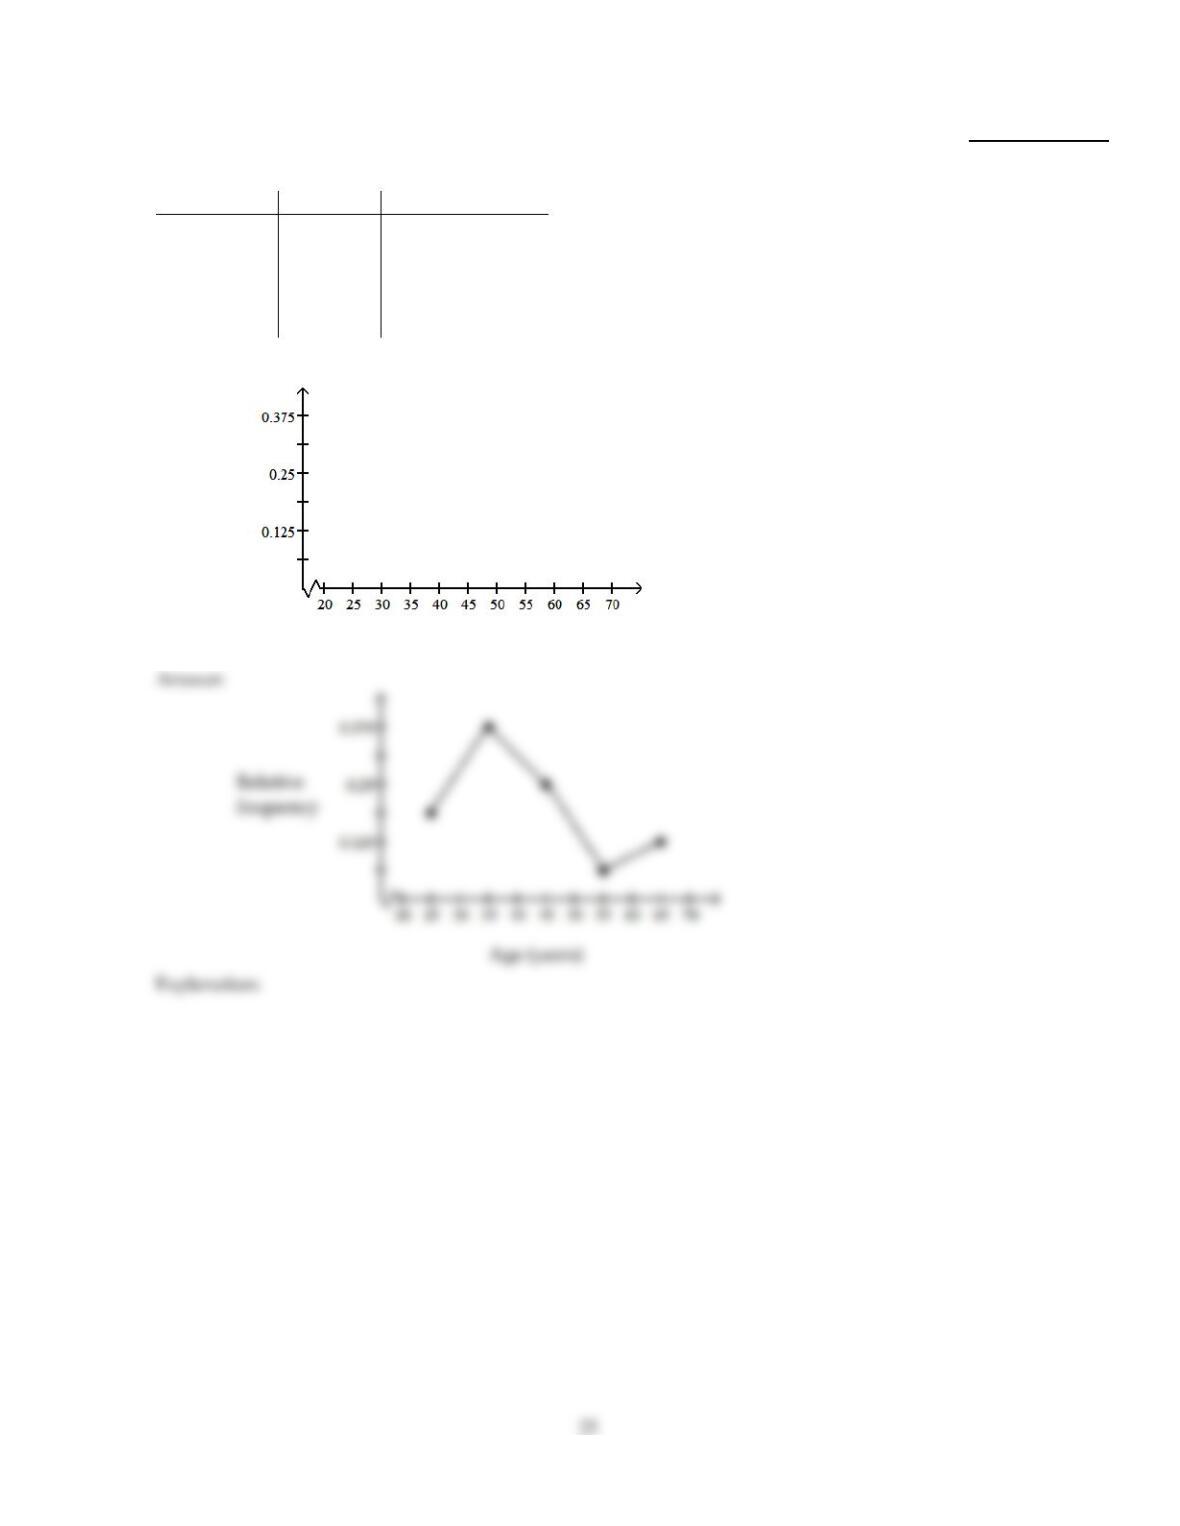
Construct a relative–frequency polygon for the given data.
47)
The table contains the frequency and relative–frequency distributions for the ages of the
employees in a particular company department.
Age (years) Frequency Relative frequency
20–under 30 3 0.1875
30–under 40 6 0.375
40–under 50 4 0.25
50–under 60 1 0.0625
60–under 70 2 0.125
Relative
frequency
Age (years)
47)
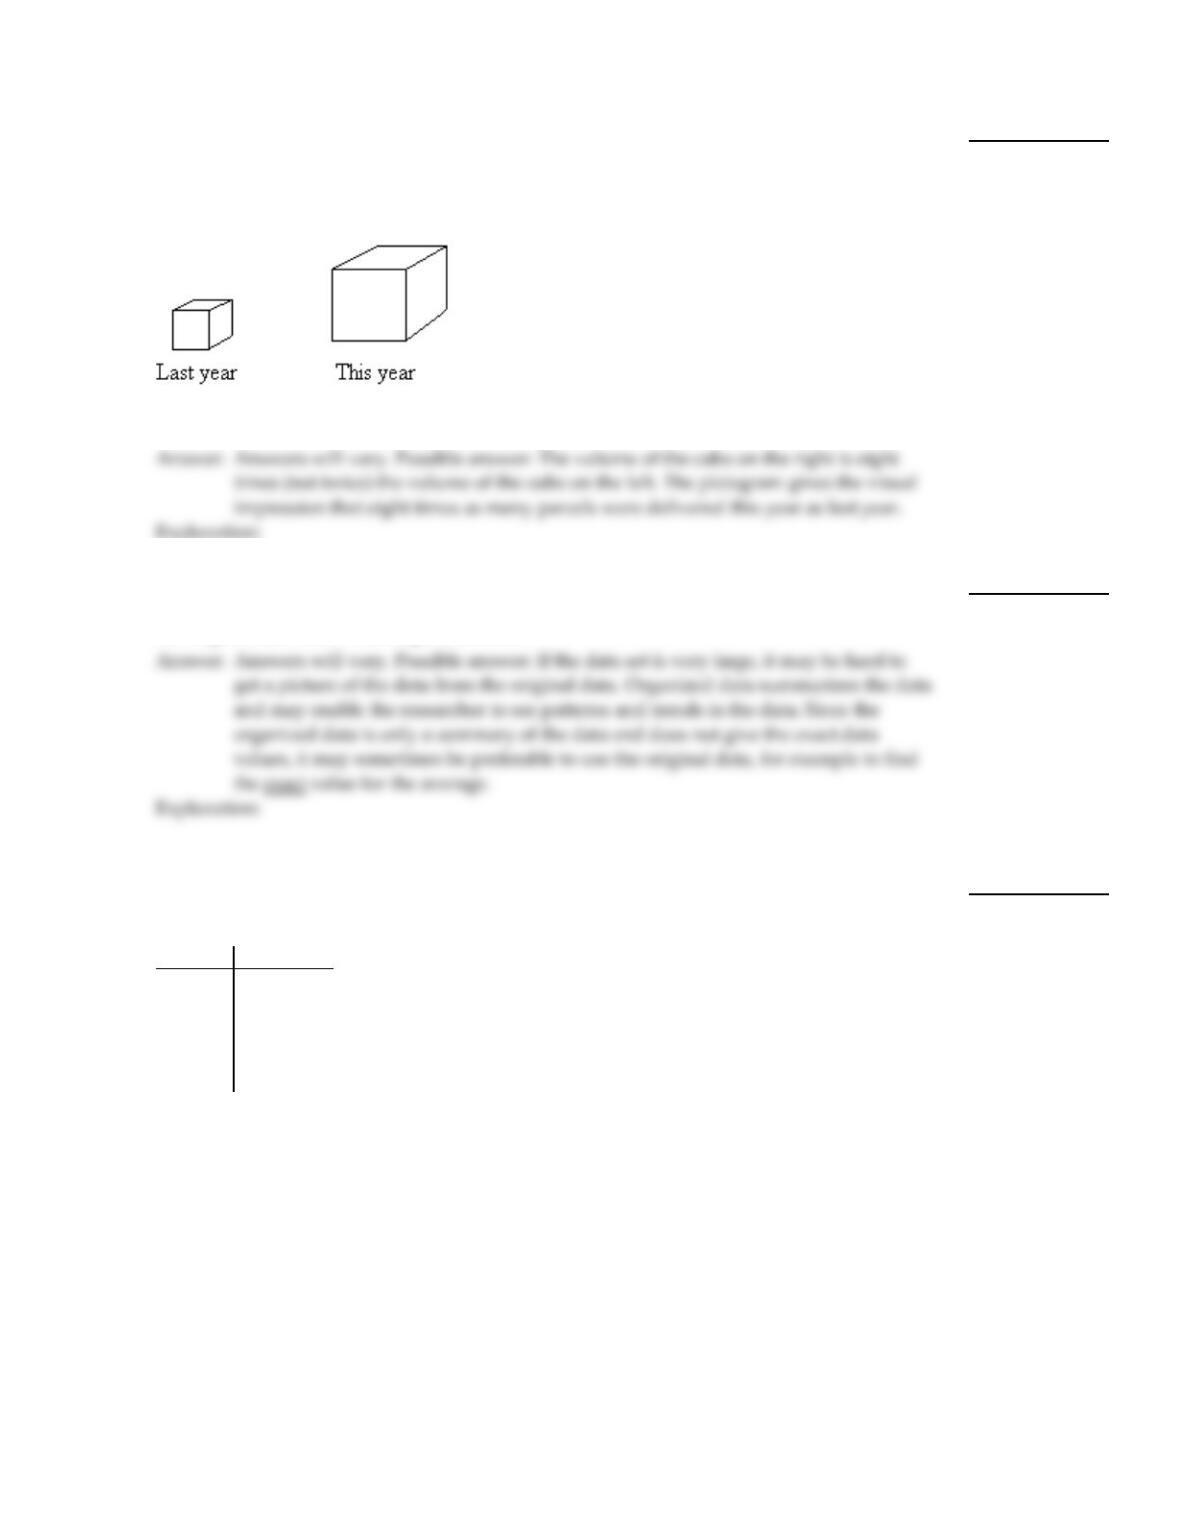
Provide an appropriate response.
48)
A parcel delivery service lowered its prices and finds that it has delivered twice as many
parcels this year as it did last year. To illustrate this fact, the manager draws a pictogram
as shown below. Each cube depicts a parcel. The side length of the “parcel” on the right is
twice the side length of the “parcel” on the left.
Why is this pictogram misleading? What visual impression is portrayed by the pictogram?
48)
49)
For a given data set, why might a researcher prefer to study organized data rather than the
original data? Can you think of any circumstances in which a researcher may prefer to use
the original data rather than organized data?
49)
Construct the requested histogram.
50)
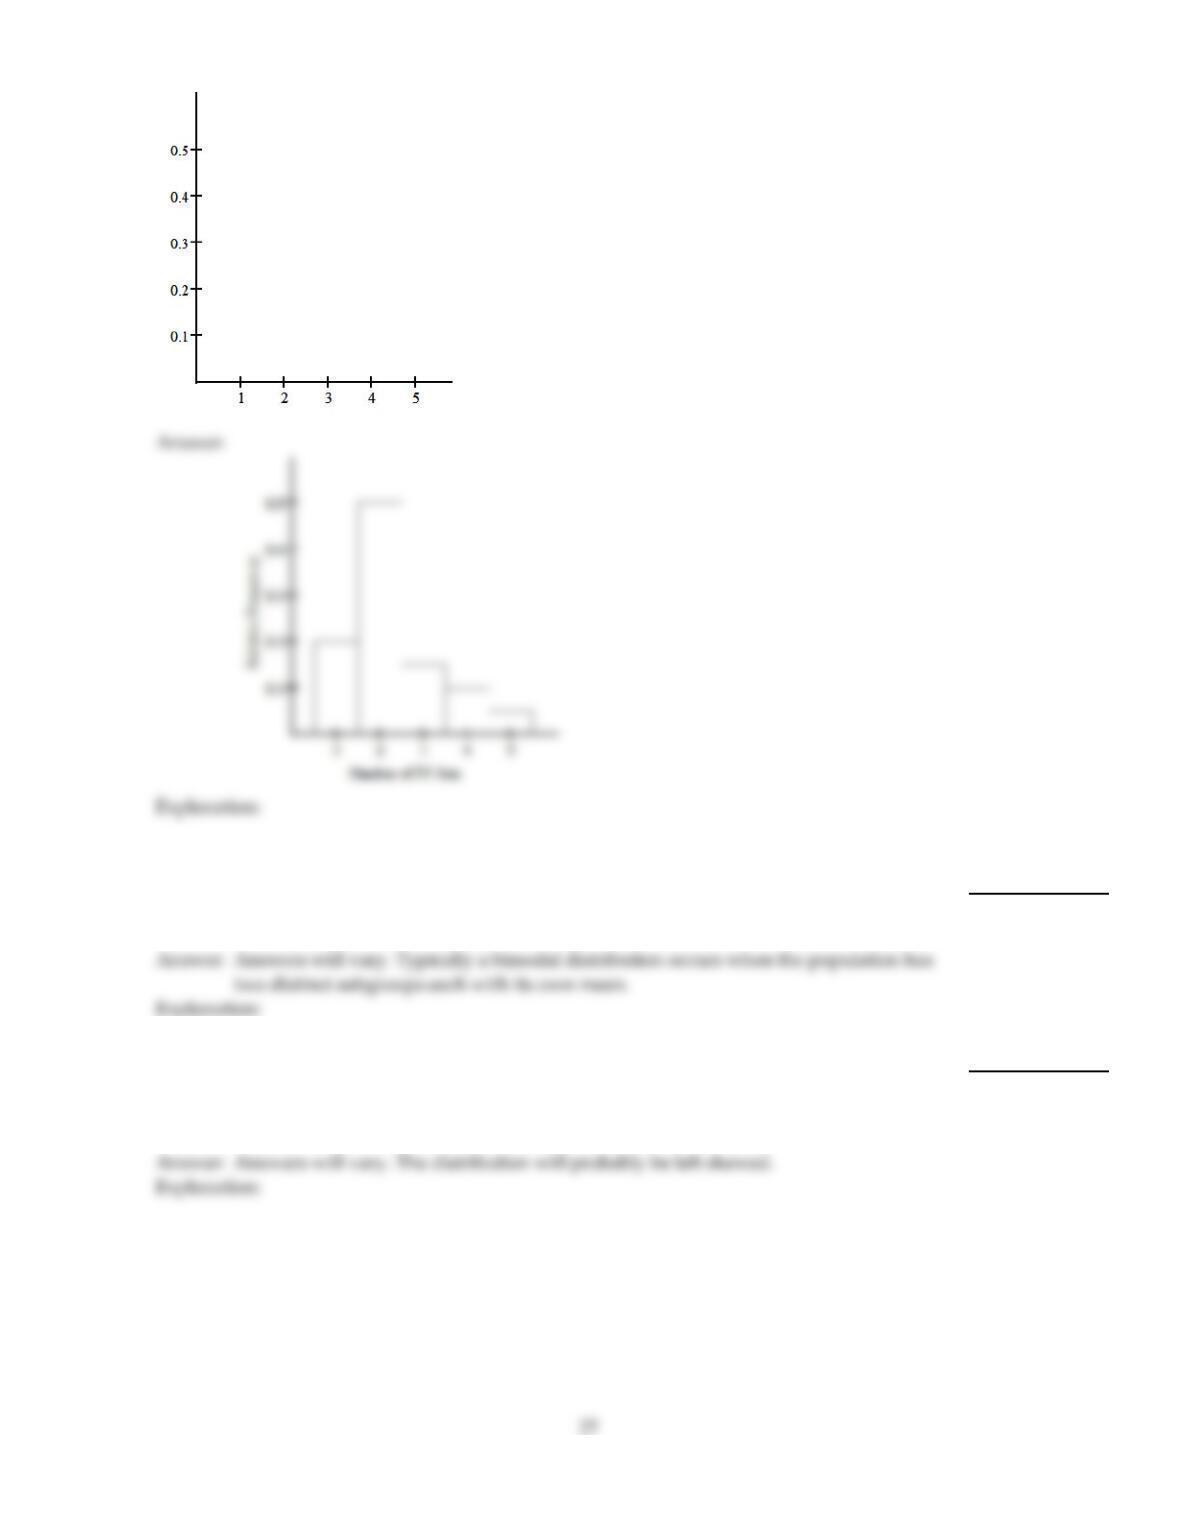
The table gives the frequency distribution for the data involving the number of television
sets per household for a sample of 100 U.S. households.
# of TVs Frequency
1 20
2 50
3 15
4 10
5 5
Construct a relative frequency histogram.
50)
26
Provide an appropriate response.
51)
Give an example of a data set whose distribution is likely to be bimodal. Describe the
population from which the sample is selected and the variable that is measured for each
person. Explain why you think the distribution will be bimodal.
51)
52)
Hospital records show the age at death of patients who die while in the hospital. A
frequency histogram is constructed for the age at death of the people who have died at the
hospital in the past five years. Roughly what shape would you expect for the distribution?
Why?
52)
53)
The preschool children at Elmwood Elementary School were asked to name their favorite
color. The results are listed below. Construct a frequency distribution and a relative
frequency distribution.
red red purple blue green
green green red green purple
green purple blue blue blue
purple green blue green yellow
53)
Construct the requested histogram.
54)
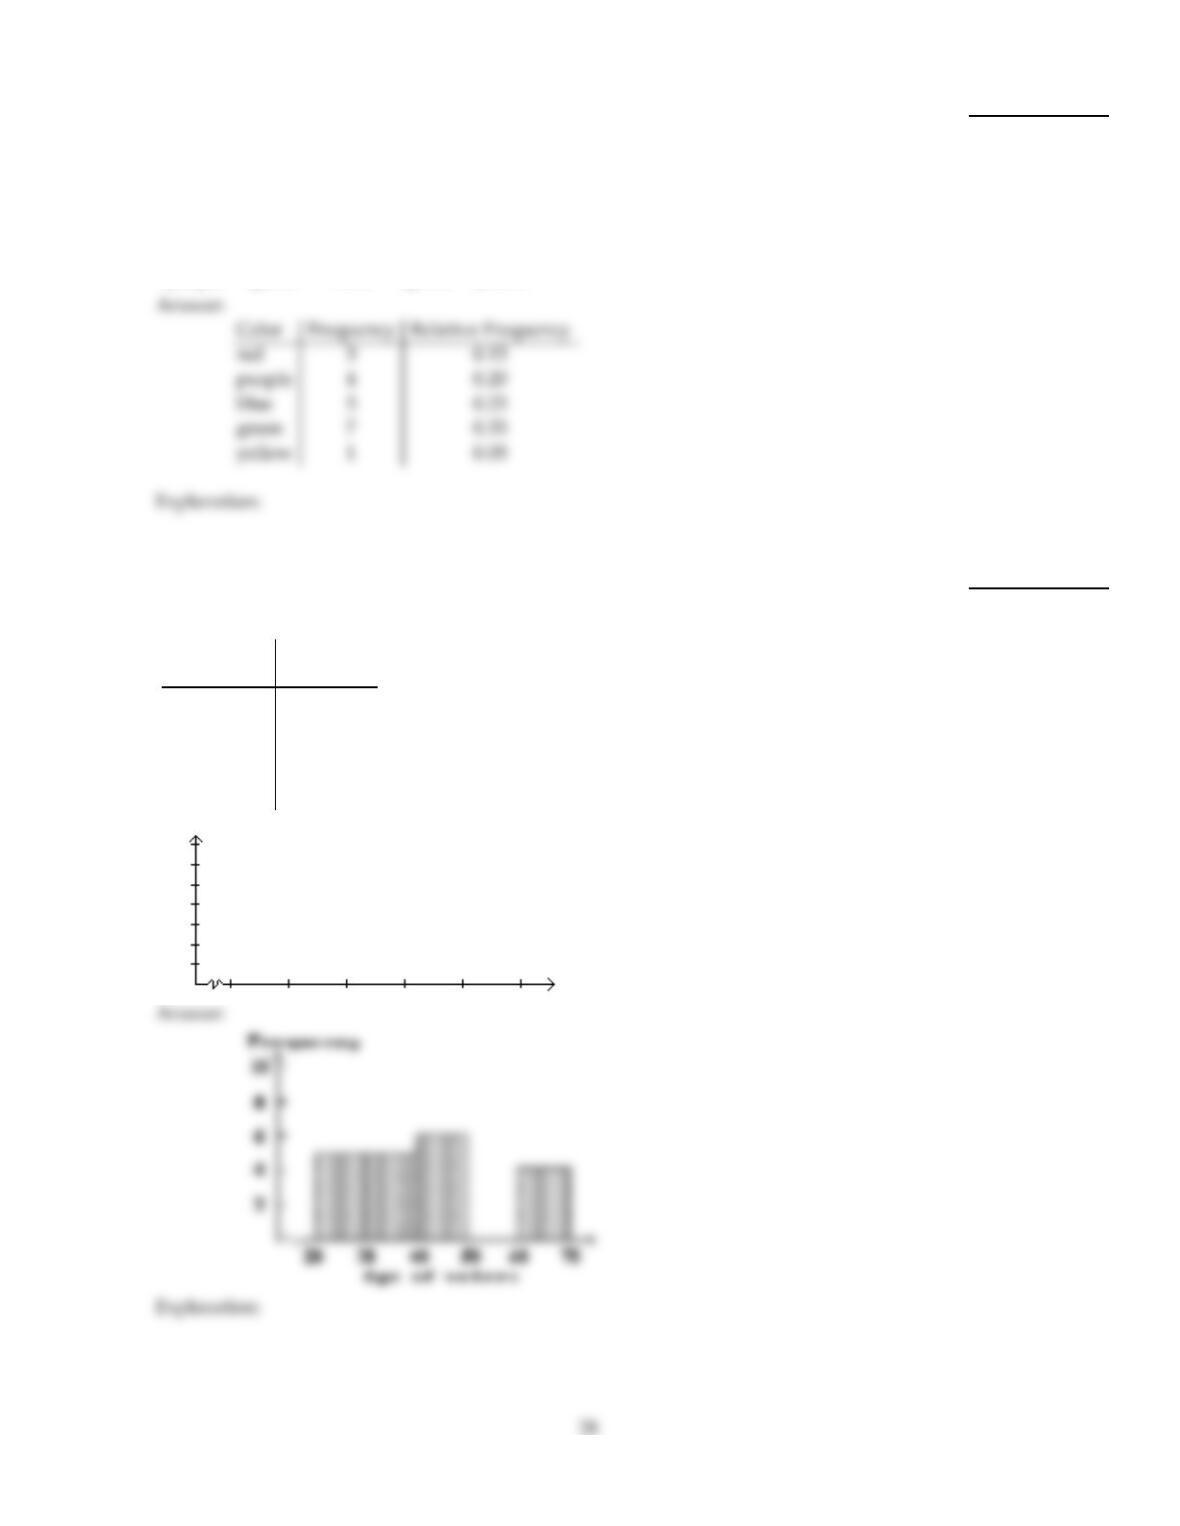
In a survey, 20 voters were asked their age. The results are summarized in the table below.
Construct a frequency histogram corresponding to data below.
Age of
voters Number of
voters
20–under 30 5
30–under 40 5
40–under 50 6
50–under 60 0
60–under 70 4
54)
Use cutpoint grouping to organize these data into a frequency distribution.
55)
A medical research team studied the ages of patients who had strokes caused by stress. The
ages of 34 patients who suffered stress strokes were as follows.
29 30 36 41 45 50 57 61 28 50 36 58
60 38 36 47 40 32 58 46 61 40 55 32
61 56 45 46 62 36 38 40 50 27
Construct a frequency distribution for these ages. Use 8 classes beginning with a lower class
limit of 25.
Age Frequency
55)
Provide an appropriate response.
56)
A table of random numbers is used to generate 100 random integers between 0 and 9. Do
you think that the distribution of the numbers will be roughly uniform? Why or why not?
In a second experiment, a table of random numbers is used to generate two random
integers between 0 and 9 and the sum of the two numbers is recorded. This procedure is
repeated 100 times. Do you think that the distribution of the sums will be roughly
uniform? Why or why not?
56)
57)
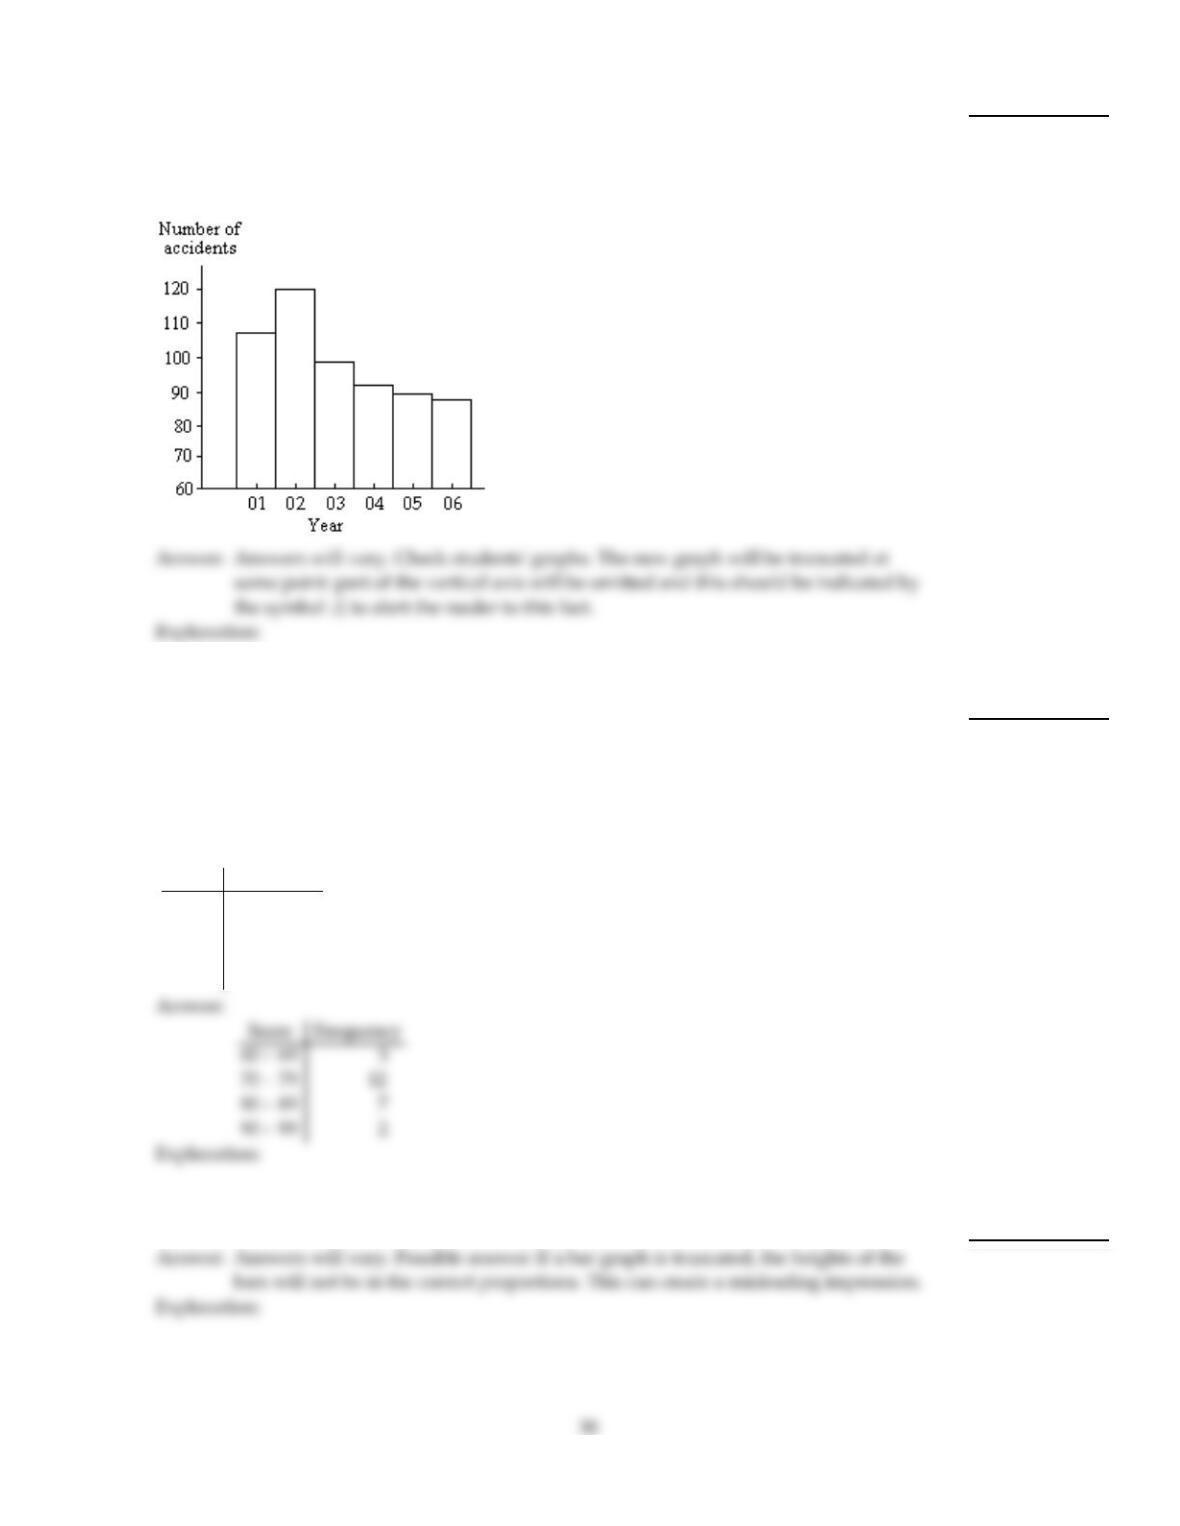
The bar graph below shows the number of car accidents occurring in one city in each of the
years 2001 through 2006. The vertical axis is truncated and as a result the graph is
misleading. Construct an improved version of the graph which is less misleading. Use the
symbol // in your graph. Explain what the symbol // means.
57)
Use limit grouping to organize these data into a frequency distribution.
58)
On a math test, the scores of 24 students were
97 72 78 66 78 78 97 88 78 66 89 72
72 89 78 72 89 78 72 88 72 89 88 66
Construct a frequency distribution. Use 4 classes beginning with a lower class limit of 60.
Score Frequency
58)
Provide an appropriate response.
59)
Explain in your own words why a truncated bar graph can be misleading.
59)
60)
Suppose you are comparing frequency data for two different groups, 25 managers and 150
blue collar workers. Why would a relative frequency distribution be better than a
frequency distribution?
60)
Use cutpoint grouping to organize these data into a frequency distribution.
61)
The table shows the closing share price, in dollars, for each of the 32 stock holdings of a
mutual fund.
18 1
16 245
8563
448 14 9
16 533
8 251
4201
4
20 2711
16 67 3
16 301
2 181
8 62 31 9
16 473
8
5215
16 295
826 1315
16 1111
16 247
8 493
470
45 1
16 541
256 3
16 60 5815
16 375
8 593
451
Construct a frequency distribution for these share prices. Use 10 as the first cutpoint and
classes of equal width 10.
Share price
61)
MULTIPLE CHOICE. Choose the one alternative that best completes the statement or answers the question.
Classify the data as either discrete or continuous.
62)
The following table shows the heights of the five tallest mountains in North America.
Mountain Height (ft) Rank
McKinley 20,320 1
Logan 19,850 2
Citlaltepec 18,700 3
St. Elias 18,008 4
Popocatepetl 17,930 5
What kind of data is given in the second column of the table?
62)
A)
Discrete
B)
Continuous
Identify the variable.
63)
The following table gives the top five movies at the box office this week.
Rank Last week Movie title Studio Box office sales ($ millions)
1N/A Pirate Adventure Movie Giant 35.2
2 2 Secret Agent Files G.M.G. 19.5
3 1 Epic Super Hero Team 22nd Century 14.3
4 5 Reptile Ride Movie Giant 10.1
5 4 Must Love Cats Dreamboat 9.9
Identify the variable under consideration in the fifth column?
63)
A)
studio
B)
rank
C)
box office sales
D)
movie title
Construct a stem–and–leaf diagram for the given data.
64)
The normal monthly precipitation (in inches) for August is listed for 39 different U.S. cities.
Construct an ordered stem–and–leaf diagram using two lines per stem.
3.5 1.6 2.4 3.7 4.1 3.9 1.0 3.6 1.7 0.4 3.2 4.2 4.1
4.2 3.4 3.7 2.2 1.5 4.2 3.4 2.7 4.0 2.0 0.8 3.6 3.7
0.4 3.7 2.0 3.6 3.8 1.2 4.0 3.1 0.5 3.9 0.1 3.5 3.4
64)
A)
0.
0.
1.
1.
2.
2.
3.
3.
4.
0 1 4 4
5 8
0 2
5 6 7
0 0 2 4
7 7 7
1 2 4 4 4
5 5 6 6 6 7 7 8 9
0 0 1 1 2 2 2
B)
0.
0.
1.
1.
2.
2.
3.
3.
4.
1 4 4
5 8
0 2
5 6 7
0 0 2 4
7
1 2 4 4 4
5 5 6 6 6 7 7 7 7 8 9 9
0 0 1 1 2 2 2
65)
The average weekly temperatures (in degrees Fahrenheit) in Orlando, Florida over a 6–month span
are given below. Round each observation to the nearest degree and then construct a stem–and–leaf
diagram of the rounded data using two lines per stem.
73.2 81.3 75.5 90.7 94.7 88.3
71.8 84.8 84.7 76.5 93.4 79.0
84.3 83.0 88.9 84.4 74.6 86.6
89.3 77.2 78.9 87.3 83.1 70.4
65)
A)
7
7
8
8
9
9
0 1 3 4
5 6 7 8 9
1 3 3 4 4 4 4
6 7 8 8 9
0 3 4
B)
7
7
8
8
9
9
0 2 3
5 6 7 7 9 9
1 3 3 4 4
5 5 7 7 8 9 9
1 3
5
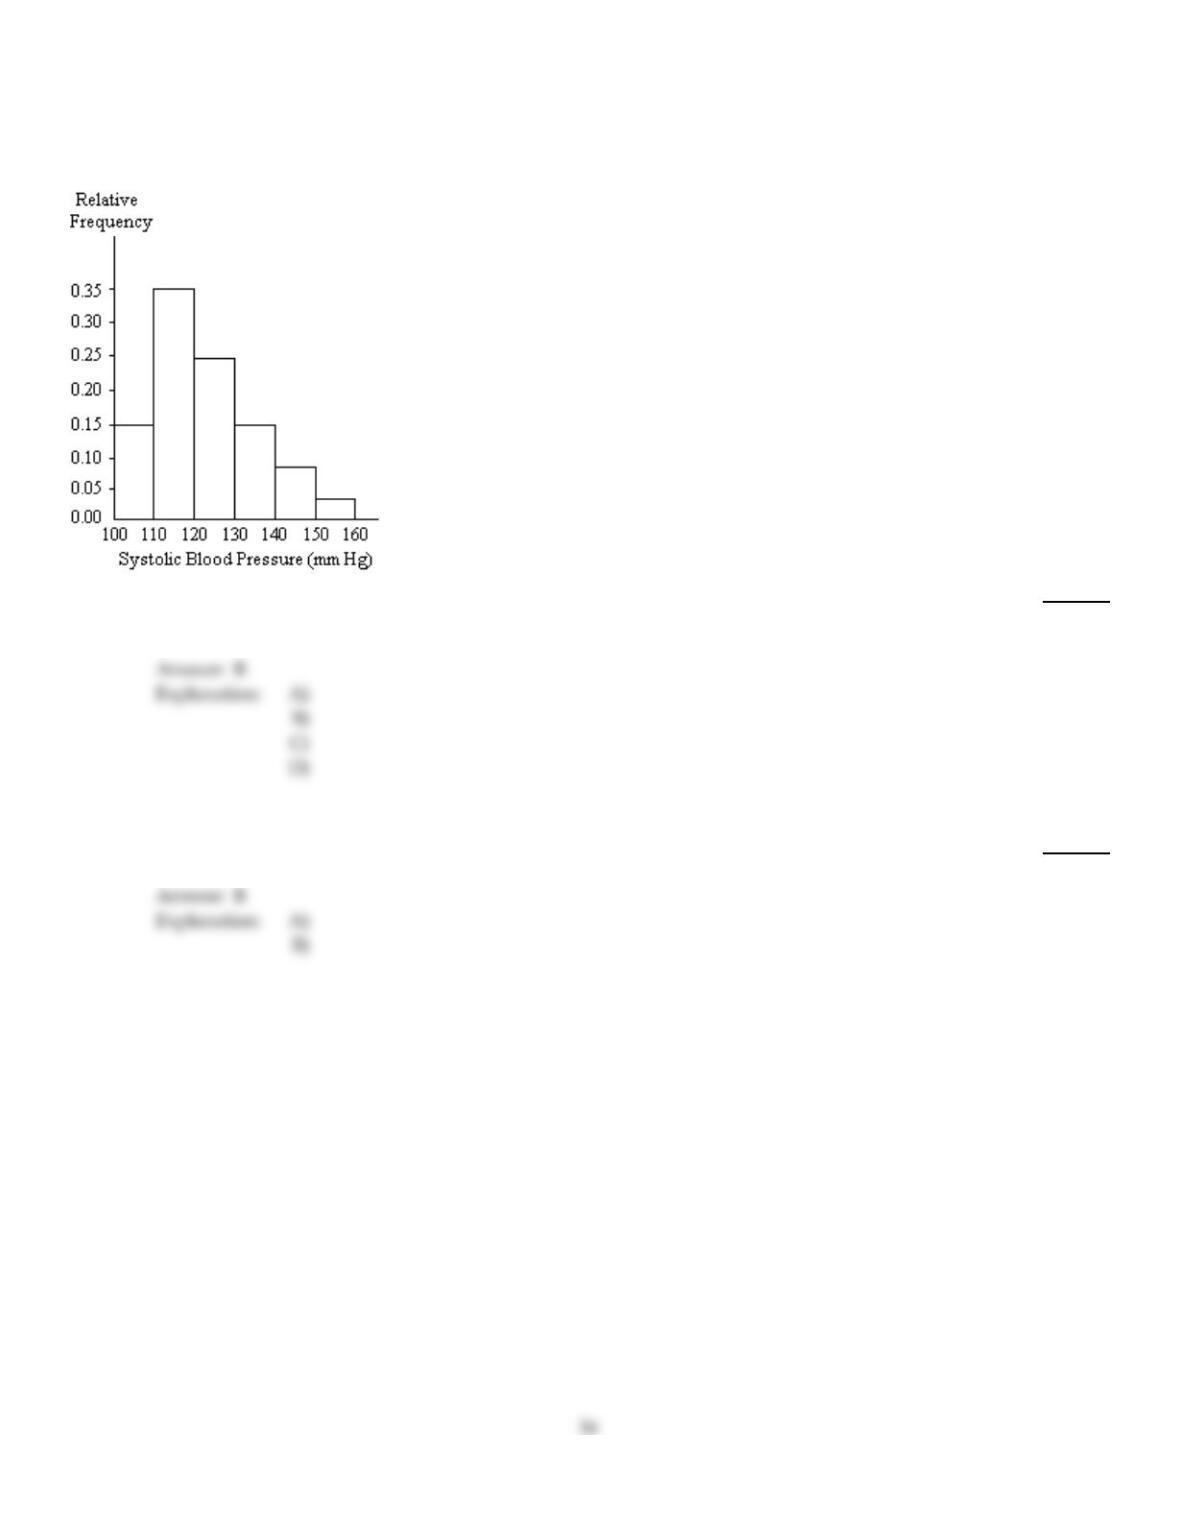
A nurse measured the blood pressure of each person who visited her clinic. Following is a relative–frequency histogram
for the systolic blood pressure readings for those people aged between 25 and 40. Use the histogram to answer the
question. The blood pressure readings were given to the nearest whole number.
66)
Approximately what percentage of the people aged 25–40 had a systolic blood pressure reading
greater than or equal to 130?
66)
A)
23%
B)
26%
C)
74%
D)
15%
Classify the data as either discrete or continuous.
67)
The temperature in Manhattan at 1 p.m. on New Year‘s Day was 34.1°F.
67)
A)
Discrete
B)
Continuous
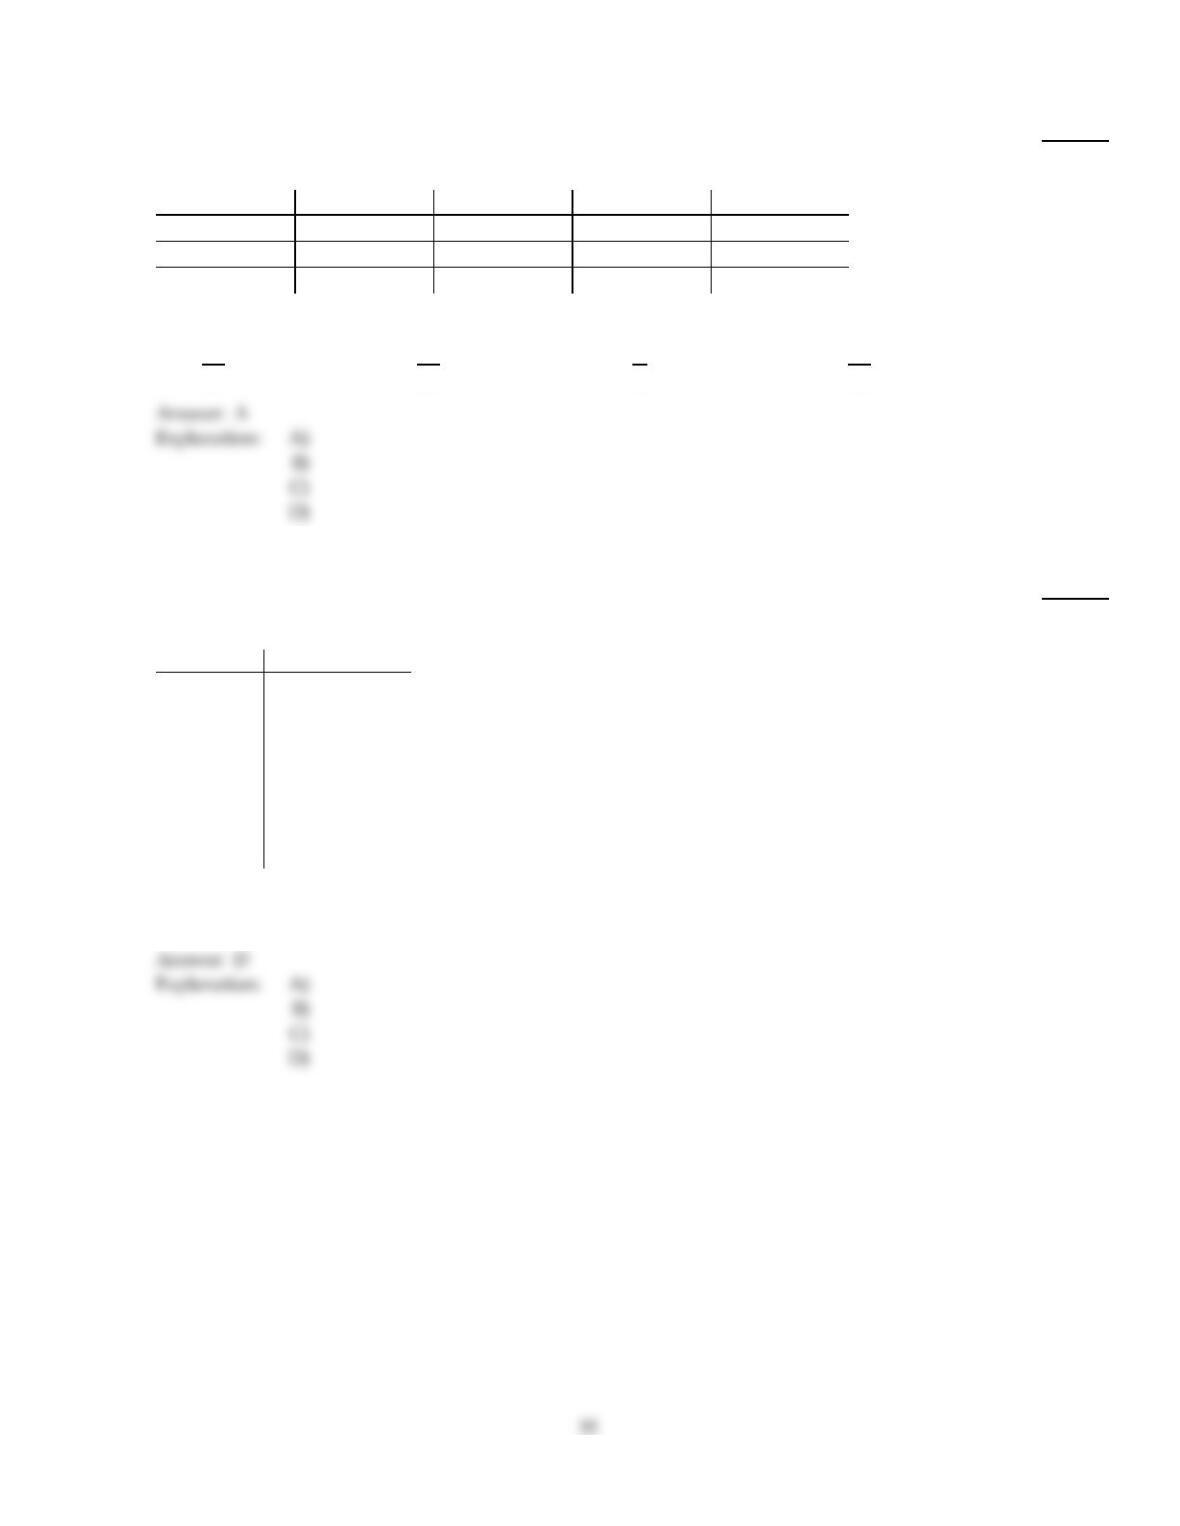
Complete the contingency table and use it to solve the problem.
68)
The partially filled contingency table gives the frequencies of the data on age (in years) and sex
from the residents of a retirement home.
Age (yrs)
60–69 70–79 Over 79 Total
Male 1 1 5
Female 19 10 4
Total
What is the relative frequency for females in the age group 60–69?
68)
A)
19
40
B)
19
20
C)
1
2
D)
17
40
Identify the variable.
69)
For the year 2006 , a large record company reported the following sales figures for various music
media.
Media Sales ($ millions)
CD 1477.3
CD single 1.8
MP3 65.9
Vinyl 2.6
Music video 531.4
Mini Disc 0.3
DVD 108.2
Cassette 3.4
Identify the variable under consideration in the first column?
69)
A)
1477.3
B)
sales
C)
CD
D)
media type
Classify the data as either qualitative or quantitative.
70)
The following table gives the top five movies at the box office this week.
Rank Last week Movie title Studio Box office sales ($ millions)
1N/A Pirate Adventure Movie Giant 35.2
2 2 Secret Agent Files G.M.G. 19.5
3 1 Epic Super Hero Team 21st Century 14.3
4 5 Reptile Ride Movie Giant 10.1
5 4 Must Love Cats Dreamboat 9.9
What kind of data is provided by the information in the first column?
70)
A)
Qualitative
B)
Quantitative
A graphical display of a data set is given. State whether the distribution is (roughly) symmetric, right skewed, or left
skewed.
71)
A die was rolled 200 times and a record was kept of the numbers obtained. The results are shown
in the relative frequency histogram below.
71)
A)
Right skewed
B)
Left skewed
C)
Symmetric
Complete the contingency table and use it to solve the problem.
72)
The partially filled contingency table gives the relative frequencies of the data on age (in years) and
sex from the residents of a retirement home.
Age (yrs)
60–69 70–79 Over 79 Total
Male 0.18 0.1 0.12
Female 0.2 0.1 0.3
Total 1
What percentage of residents are males over 79?
72)
A)
11.5%
B)
14%
C)
6.6%
D)
12%
Construct a stem–and–leaf diagram for the given data.
73)
The weights of 22 members of the varsity football team are listed below.
144 152 142 151 160 152 131 164 141 153 140
144 175 156 147 133 172 159 135 159 148 171
73)
A)
13
14
15
16
17
1 3 5
1 2 2 3 6 9 9
0 1 2 4 4 7 8
0 4
1 2 5
B)
13
14
15
16
17
1 3 5
4 2 1 4 7 8 0
2 1 2 3 6 9 9
0 4
5 2 1
Complete the contingency table and use it to solve the problem.
74)
The partially filled contingency table gives the relative frequencies of the data on age (in years) and
sex from the residents of a retirement home.
Age (yrs)
60–69 70–79 Over 79 Total
Male 0.17 0.1 0.13
Female 0.2 0.2 0.2
Total 1
What percentage of residents are in the age group 60–69?
74)
A)
35%
B)
38.5%
C)
37%
D)
40%
Provide an appropriate response.
75)
The data in the following table show the results of a survey of college students asking which
vacation destination they would choose given the eight choices shown. Determine the value that
should be entered in the relative frequency column for Florida.
Destination Frequency Relative frequency
Florida 23
Mexico 76
Belize 18
Puerto Rico 22
Alaska 6
California 23
Colorado 15
Arizona 17
75)
A)
0.23
B)
0.0115
C)
0.115
D)
23
Classify the data as either discrete or continuous.
76)
An athlete runs 100 meters in 10.7 seconds.
76)
A)
Discrete
B)
Continuous
Construct the requested graph.
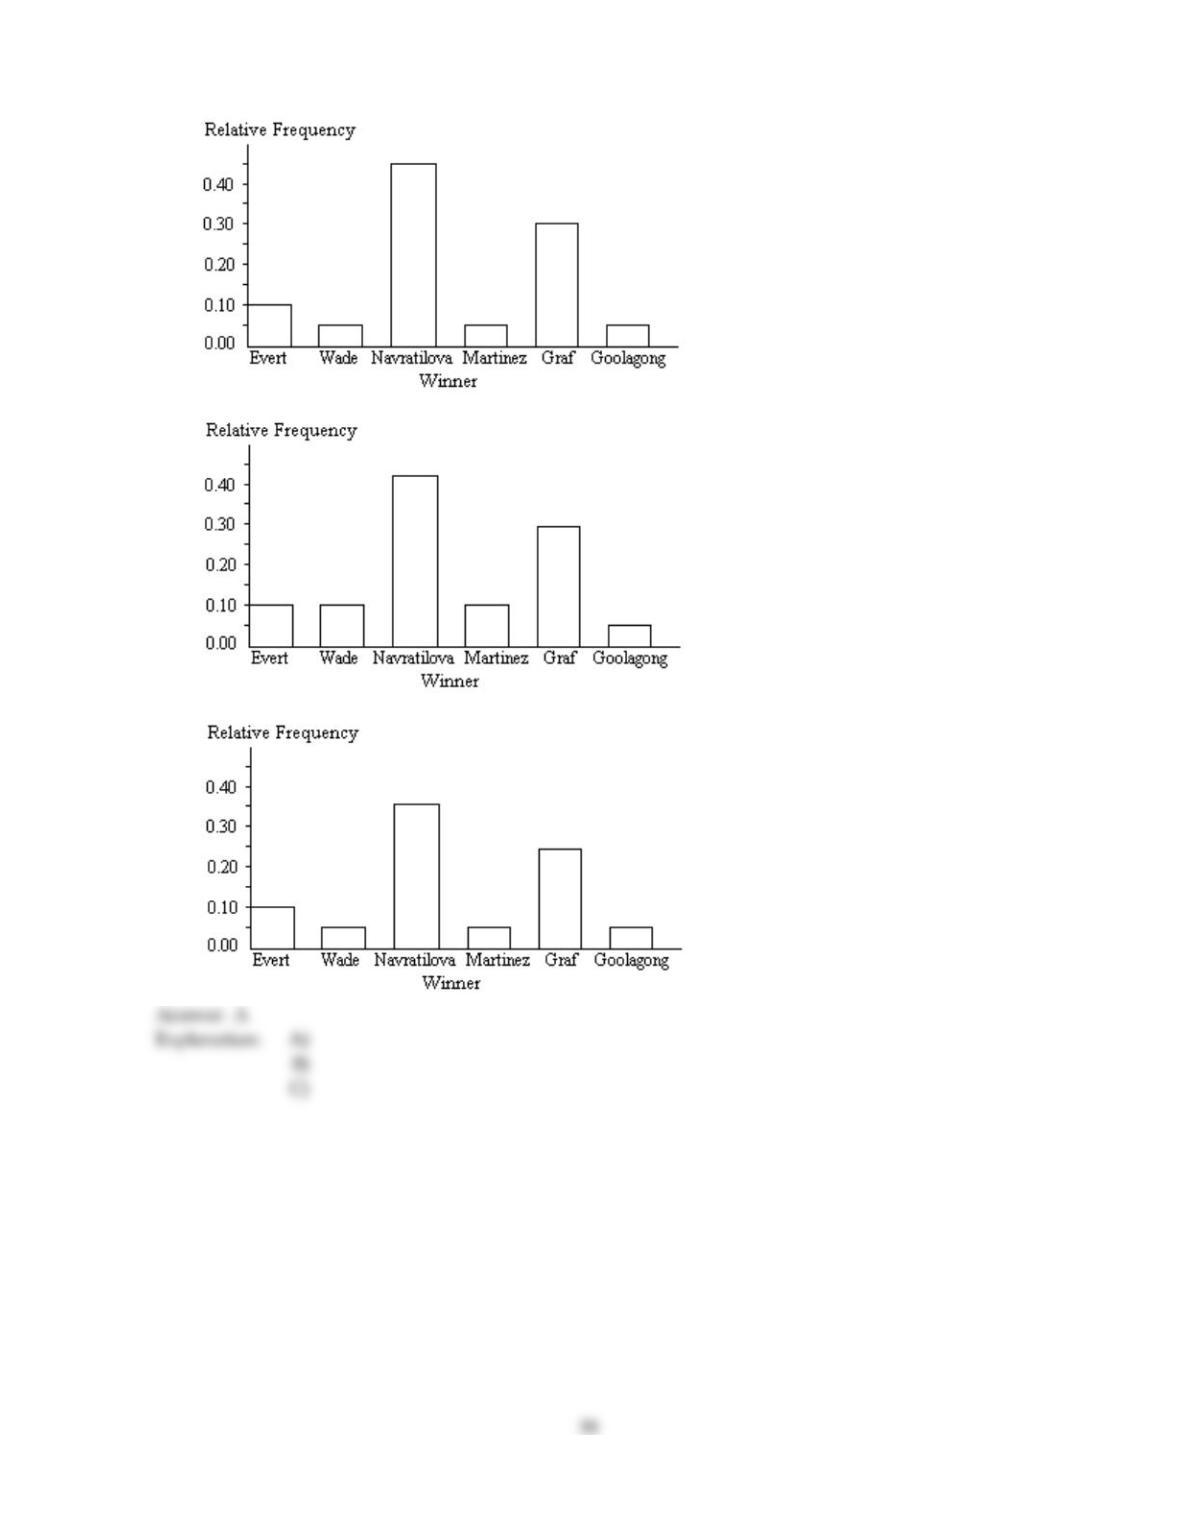
77)
The table lists the winners of the State Tennis Tournament women’s singles title for the years
1986–2005. Construct a bar graph for the given relative frequencies.
Winner Frequency Relative
frequency
C. Evert 20.10
V. Wade 10.05
M. Navratilova 90.45
C. Martinez 10.05
S. Graf 60.30
E. Goolagong 10.05
77)
38
A)
B)
C)
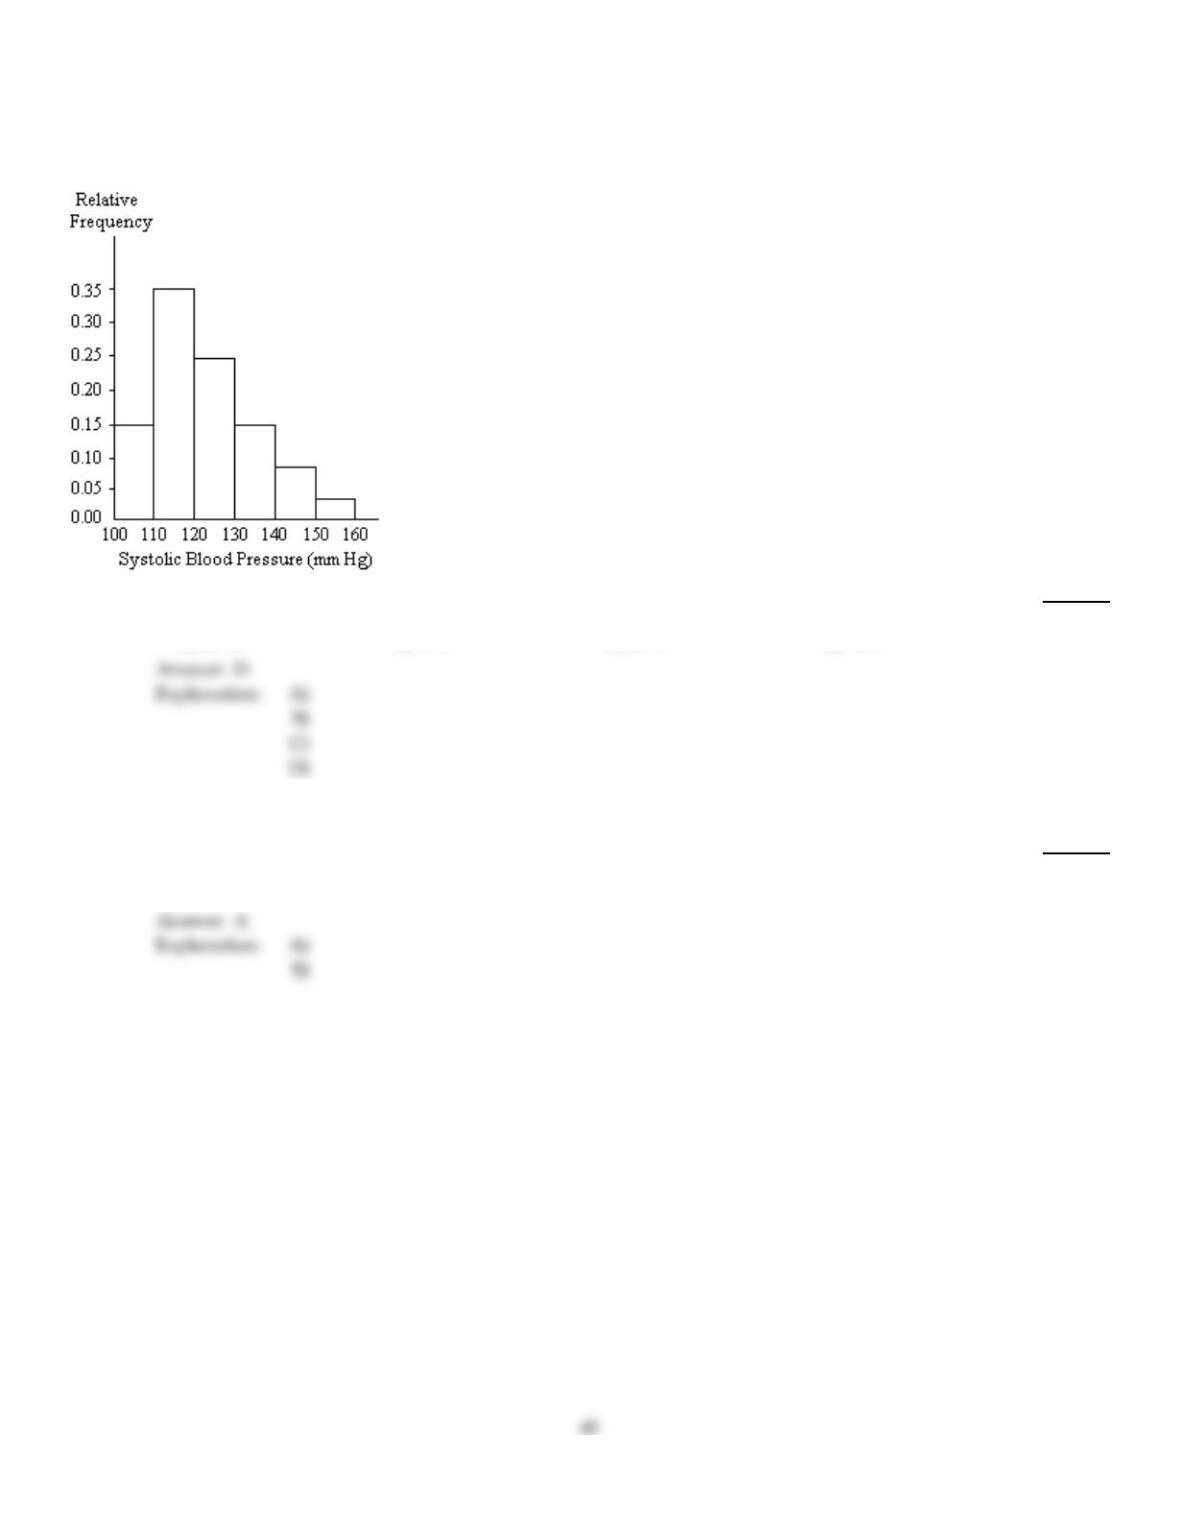
A nurse measured the blood pressure of each person who visited her clinic. Following is a relative–frequency histogram
for the systolic blood pressure readings for those people aged between 25 and 40. Use the histogram to answer the
question. The blood pressure readings were given to the nearest whole number.
78)
Approximately what percentage of the people aged 25–40 had a systolic blood pressure reading
between 110 and 139 inclusive?
78)
A)
59%
B)
89%
C)
39%
D)
74%
Classify the data as either discrete or continuous.
79)
What type of data is provided by the statement “Helen finished in 7th place in the ice dancing
competition”?
79)
A)
Discrete
B)
Continuous
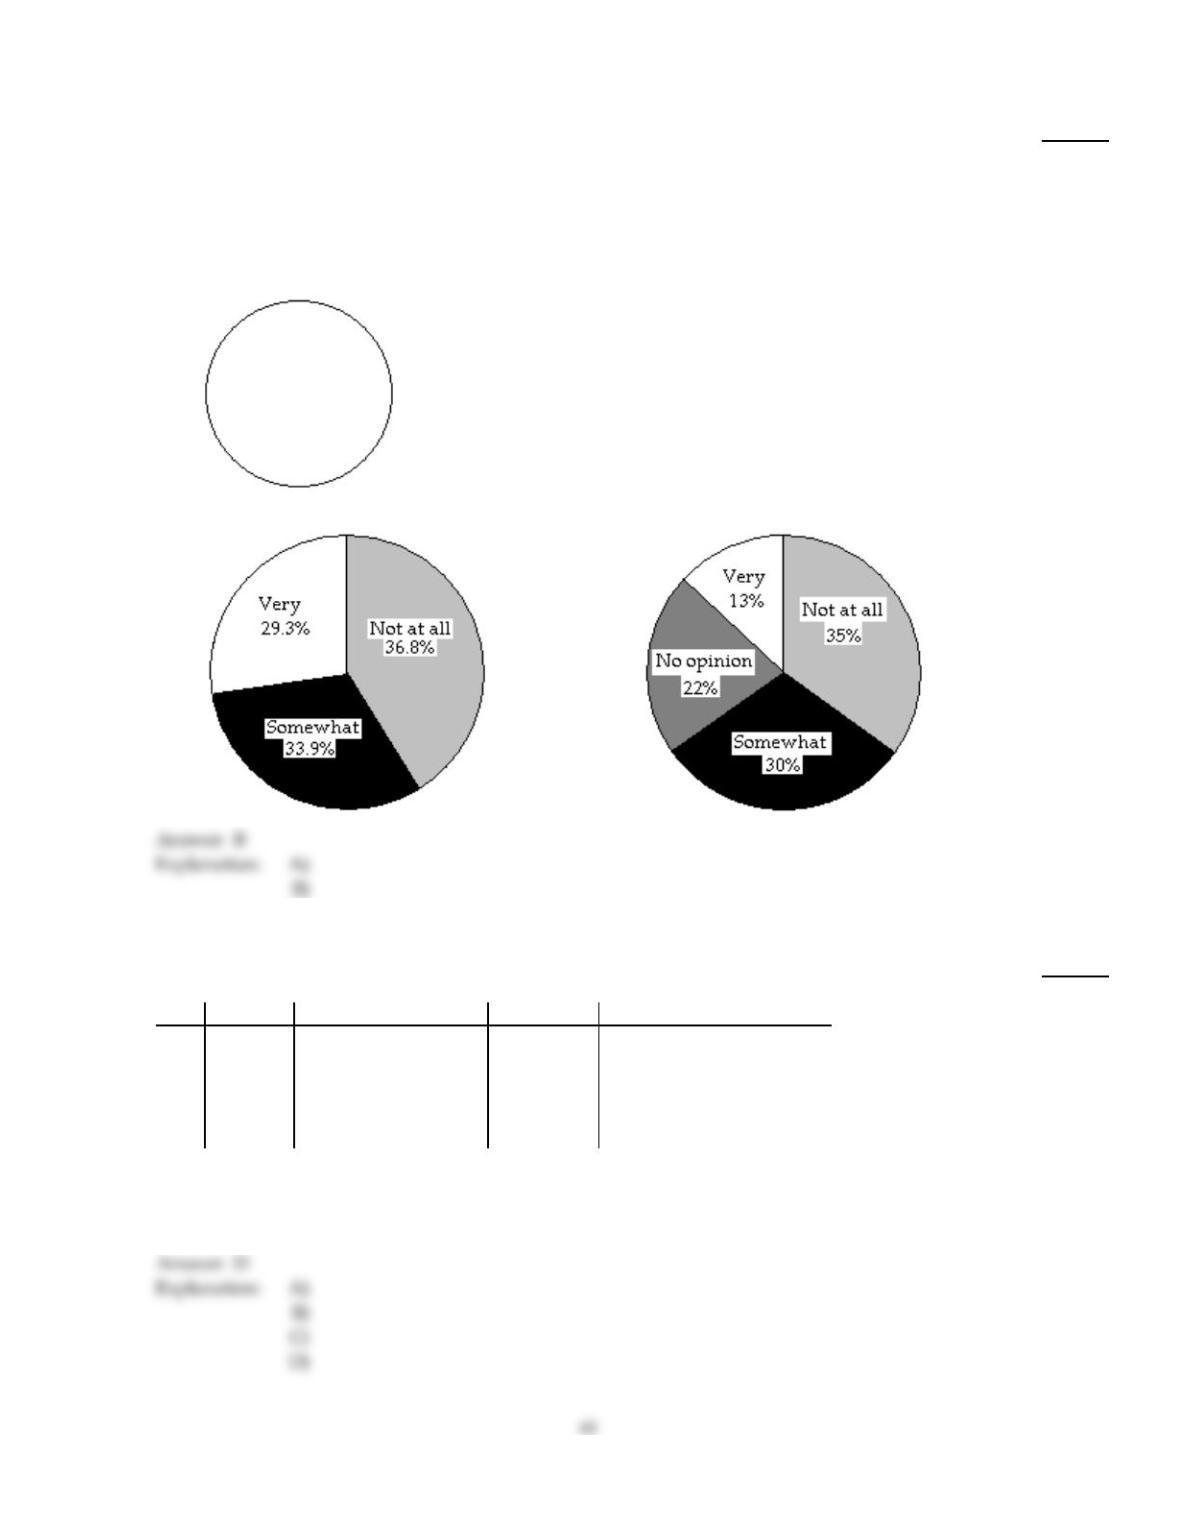
Construct a pie chart representing the given data set.
80)
The data below represent the results of a poll in which the following question was asked: “To what
degree are you satisfied with your current health insurance?”
Very 13%
Somewhat 30%
Not at All 35%
No opinion 22%
80)
A)
B)
Identify the variable.
81)
The following table gives the top five movies at the box office this week.
Rank Last week Movie title Studio Box office sales ($ millions)
1N/A Pirate Adventure Movie Giant 35.2
2 2 Secret Agent Files G.M.G. 19.5
3 1 Epic Super Hero Team 21st Century 14.3
4 5 Reptile Ride Movie Giant 10.1
5 4 Must Love Cats Dreamboat 9.9
Identify the variable under consideration in the first column?
81)
A)
last week’s rank
B)
movie title
C)
Pirate Adventure
D)
rank this week
82)
A large record company reported the following sales figures for various music media last year.
Media Sales ($ millions)
CD 1477.3
CD single 1.8
MP3 65.9
Vinyl 2.6
Music video 531.4
Mini Disc 0.3
DVD 108.2
Cassette 3.4
Identify the variable under consideration in the second column?
82)
A)
sales
B)
$ millions
C)
CD single
D)
media
Classify the data as either discrete or continuous.
83)
The number of freshmen entering college in a certain year is 621.
83)
A)
Discrete
B)
Continuous
84)
The following table shows the heights of the five tallest mountains in North America.
Mountain Height (ft) Rank
McKinley 20,320 1
Logan 19,850 2
Citlaltepec 18,700 3
St. Elias 18,008 4
Popocatepetl 17,930 5
What kind of data is given in the third column of the table?
84)
A)
Discrete
B)
Continuous
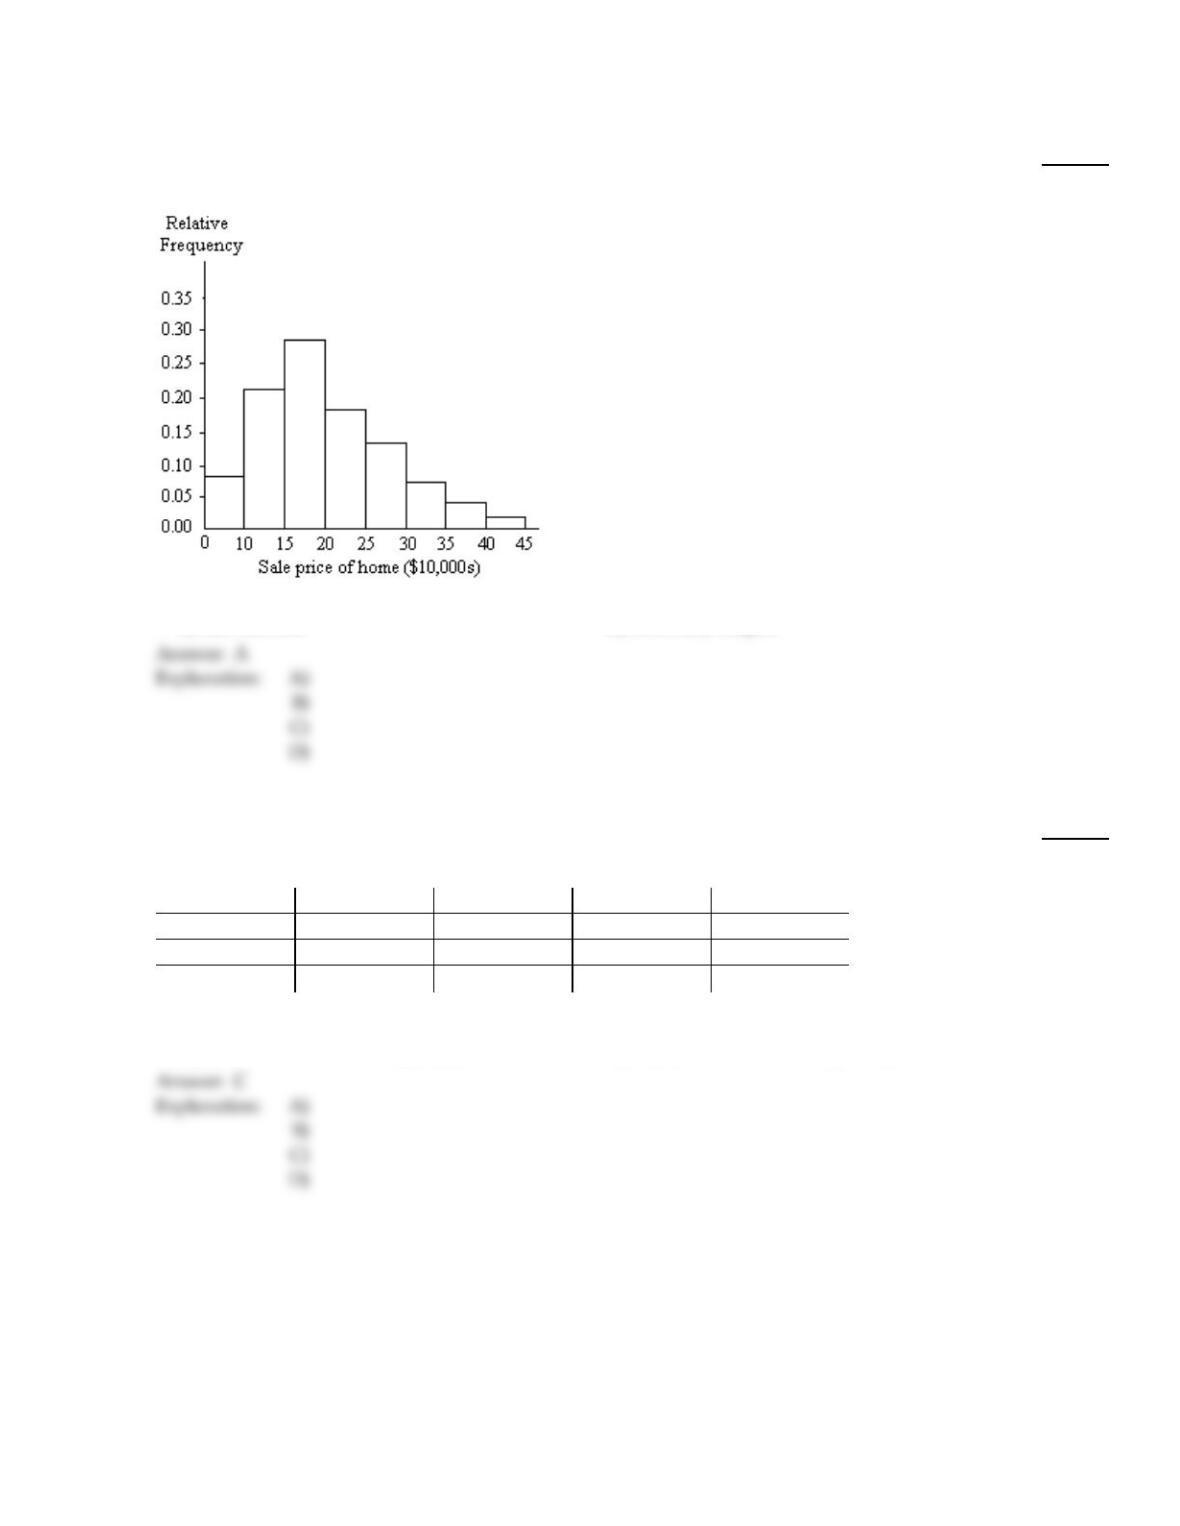
A graphical display of a data set is given. Identify the overall shape of the distribution as (roughly) bell–shaped,
triangular, uniform, reverse J–shaped, J–shaped, right skewed, left skewed, bimodal, or multimodal.
85)
A relative frequency histogram for the sale prices of homes sold in one city during 2006 is shown
below.
85)
A)
Right skewed
B)
J–shaped
C)
Left skewed
D)
Reverse J–shaped
Complete the contingency table and use it to solve the problem.
86)
The partially filled contingency table gives the frequencies of the data on age (in years) and sex
from the residents of a retirement home.
Age (yrs)
60–69 70–79 Over 79 Total
Male 19 5 5
Female 1 6 4
Total
What percentage of residents are males in the age group 60–69 ?
86)
A)
48%
B)
47.3%
C)
47.5%
D)
47.6%
C
Provide the requested response.
43
A
87)
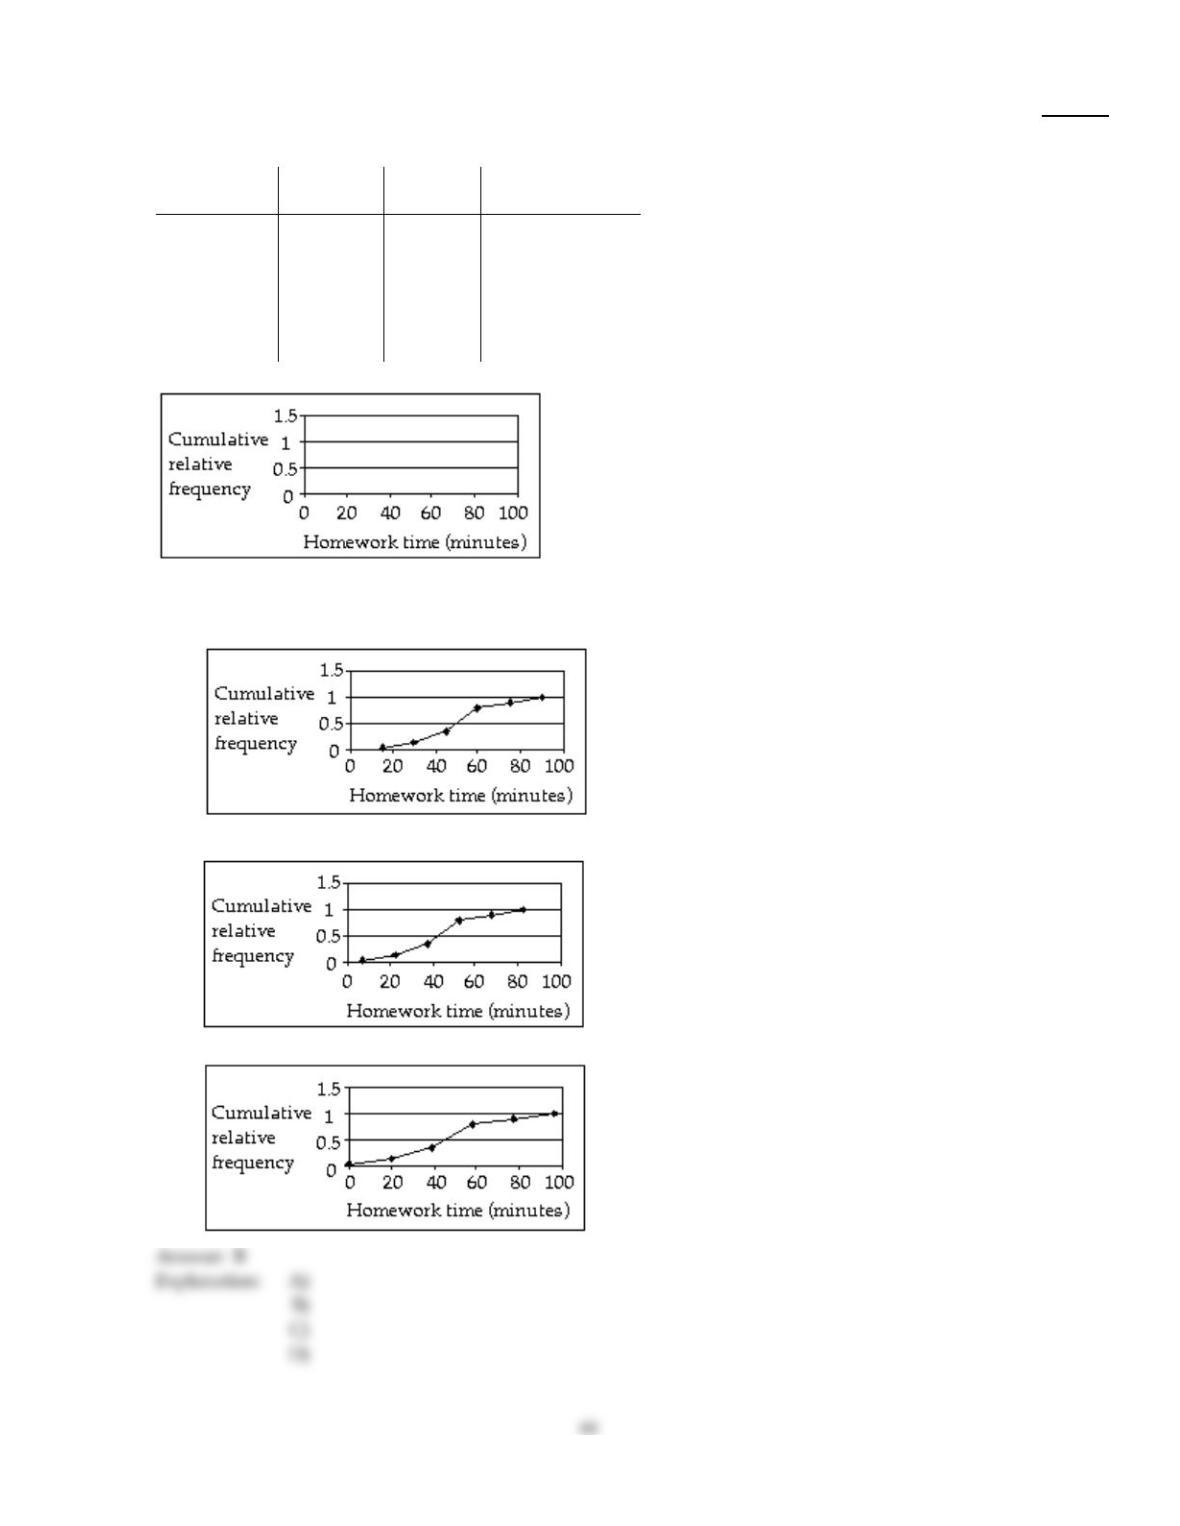
The table contains data from a study of daily study time for 40 students from Statistics 101.
Construct an ogive from the data.
Minutes on
homework Number of
students Relative
frequency Cumulative
relative frequency
0–under 15 20.05 0.05
15–under 30 40.10 0.15
30–under 45 80.20 0.35
45–under 60 18 0.45 0.80
60–under 75 40.10 0.90
75–under 90 40.10 1.00
87)
A)
The table does not contain enough information to construct an ogive.
B)
C)
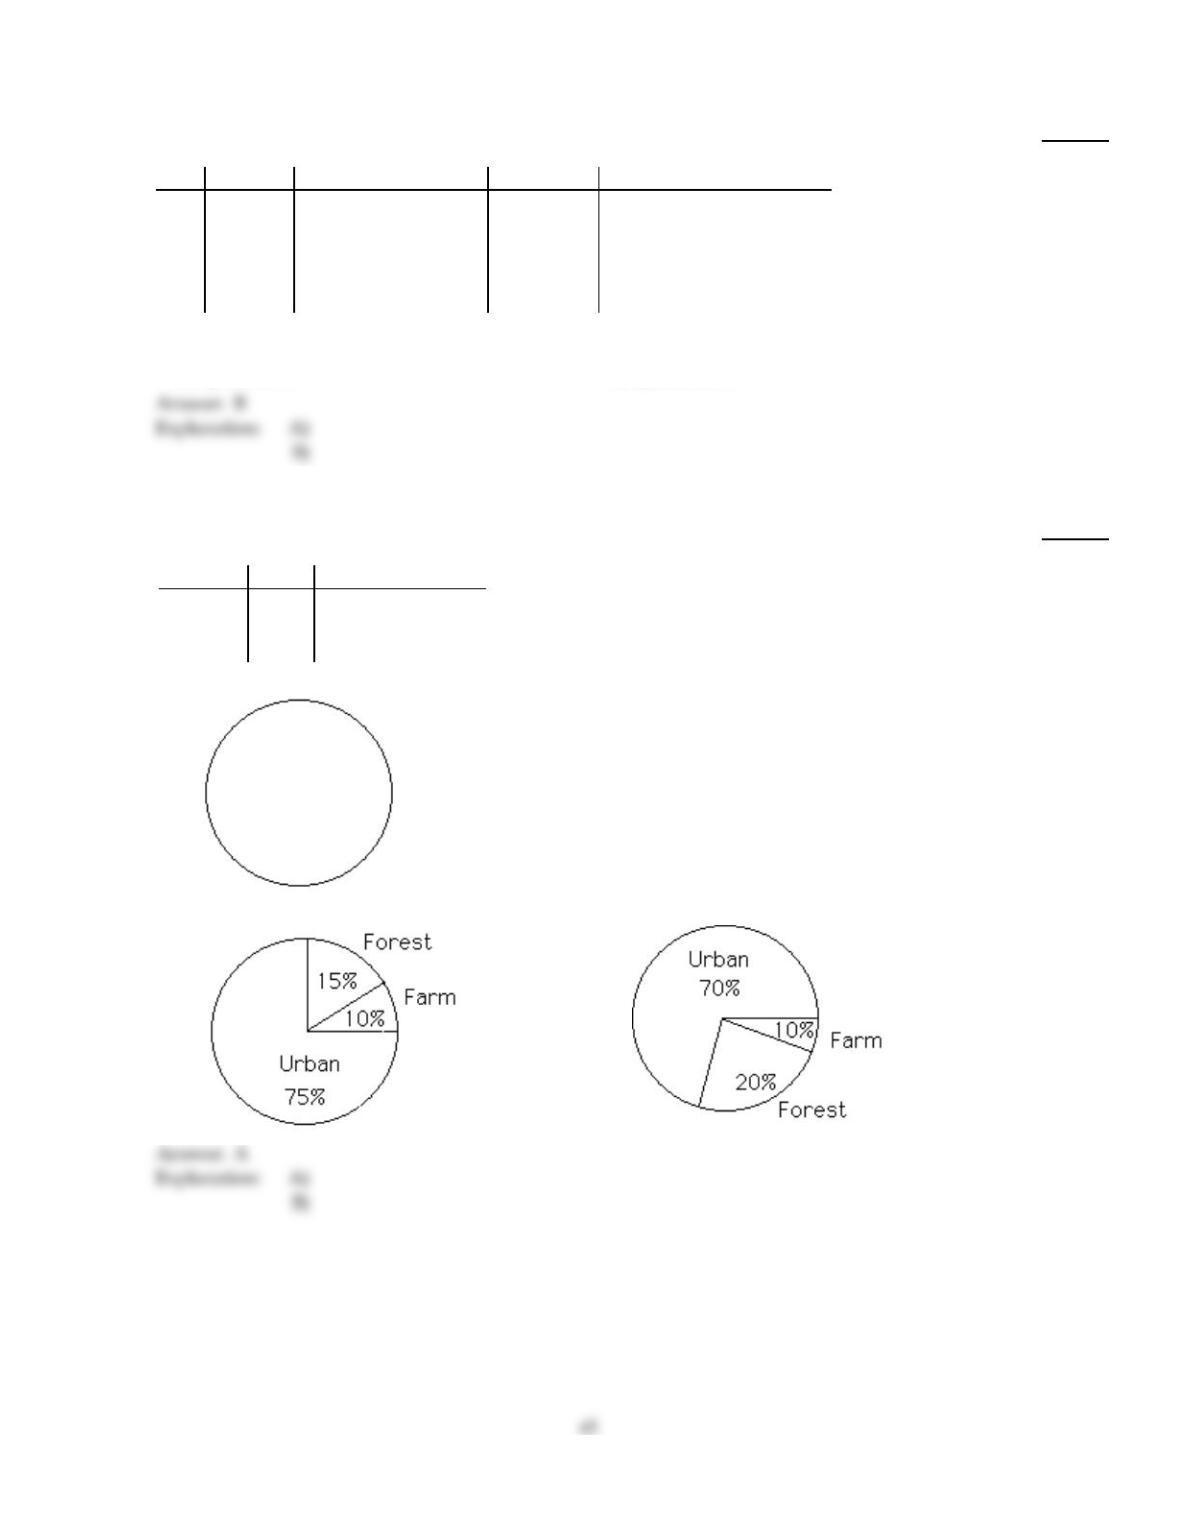
D)
Classify the data as either qualitative or quantitative.
88)
The following table gives the top five movies at the box office this week.
Rank Last week Movie title Studio Box office sales ($ millions)
1N/A Pirate Adventure Movie Giant 35.2
2 2 Secret Agent Files G.M.G. 19.5
3 1 Epic Super Hero Team 21st Century 14.3
4 5 Reptile Ride Movie Giant 10.1
5 4 Must Love Cats Dreamboat 9.9
What kind of data is provided by the information in the second column?
88)
A)
Qualitative
B)
Quantitative
Construct a pie chart representing the given data set.
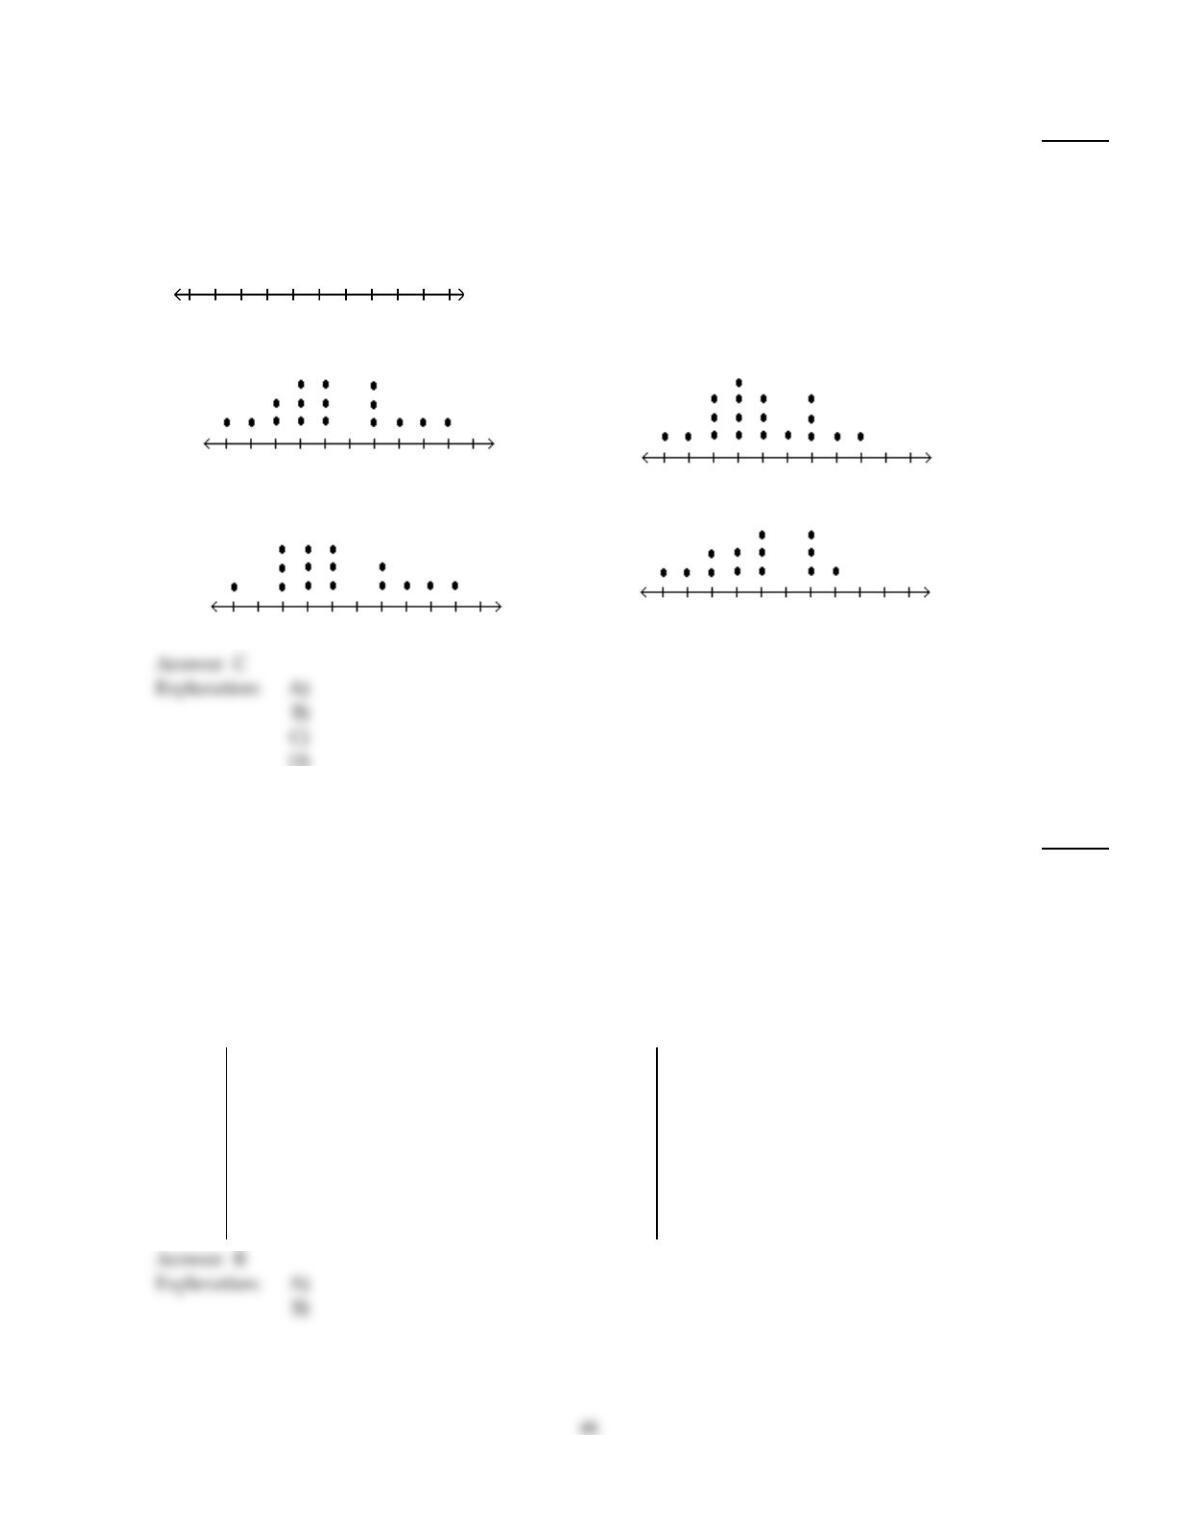
89)
The following figures give the distribution of land (in acres) for a county containing 73,000 acres.
Land Use Acres Relative Frequency
Forest 10,950 0.15
Farm 7300 0.10
Urban 54,750 0.75
89)
A)
B)
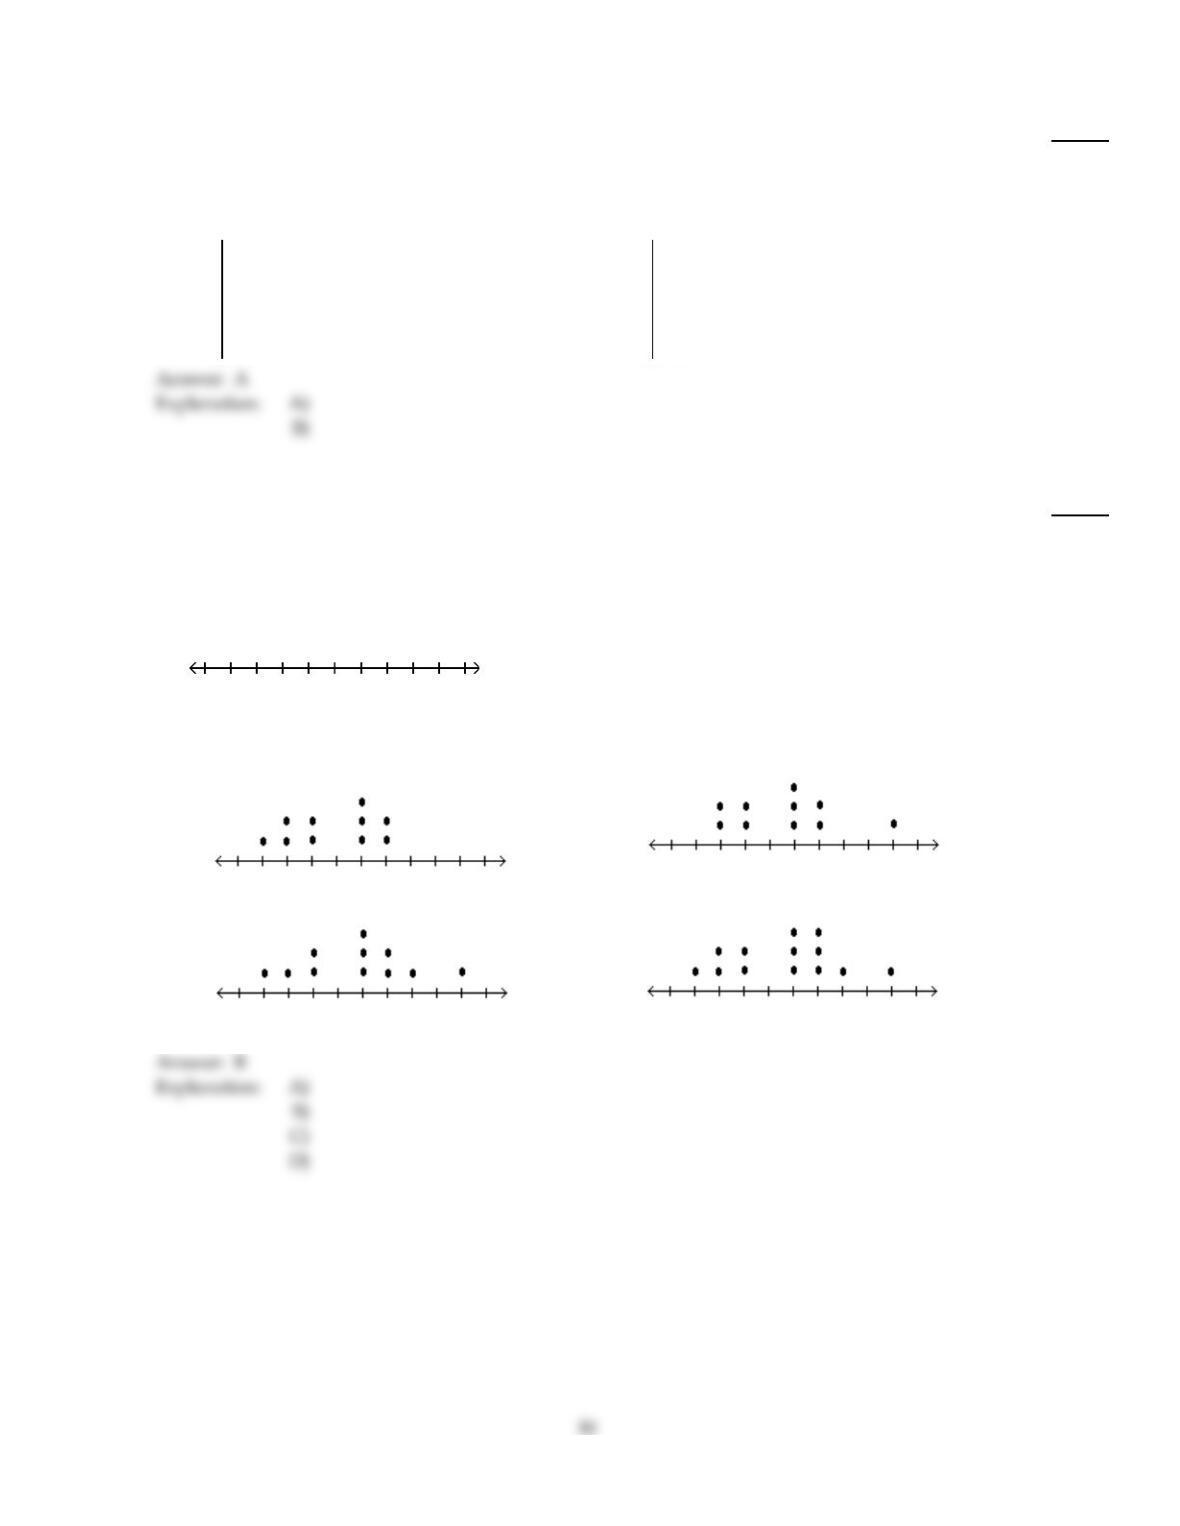
Construct a dotplot for the given data.
90)
The following data represent the number of cars passing through a toll booth during a certain time
period over a number of days.
38 39 37 37 44 38 41 38 39 35 42 39 43 37 41
35 40 45
90)
A)
35 40 45
B)
35 40 45
C)
35 40 45
D)
35 40 45
D)
Construct a stem–and–leaf diagram for the given data.
91)
The ages of the 45 members of a track and field team are listed below. Construct an ordered
stem–and–leaf diagram using two lines per stem.
21 18 42 35 32 21 44 25 38
48 14 19 23 22 28 32 34 27
31 17 16 41 37 22 24 33 32
21 26 30 22 27 32 30 20 18
17 21 15 26 36 31 40 16 25
91)
A)
1
1
2
2
3
3
4
4
4 5
5 6 6 7 7 8 8 9
0 1 1 1 1 2 2 2 3 4 5 5
5 5 6 6 7 7 8
0 0 1 1 2 2 2 2 3 4 5
5 6 7 8
0 1 2 4
8
B)
1
1
2
2
3
3
4
4
4
5 6 6 7 7 8 8 9
0 1 1 1 1 2 2 2 3 4
5 5 6 6 7 7 8
0 0 1 1 2 2 2 2 3 4
5 6 7 8
0 1 2 4
8
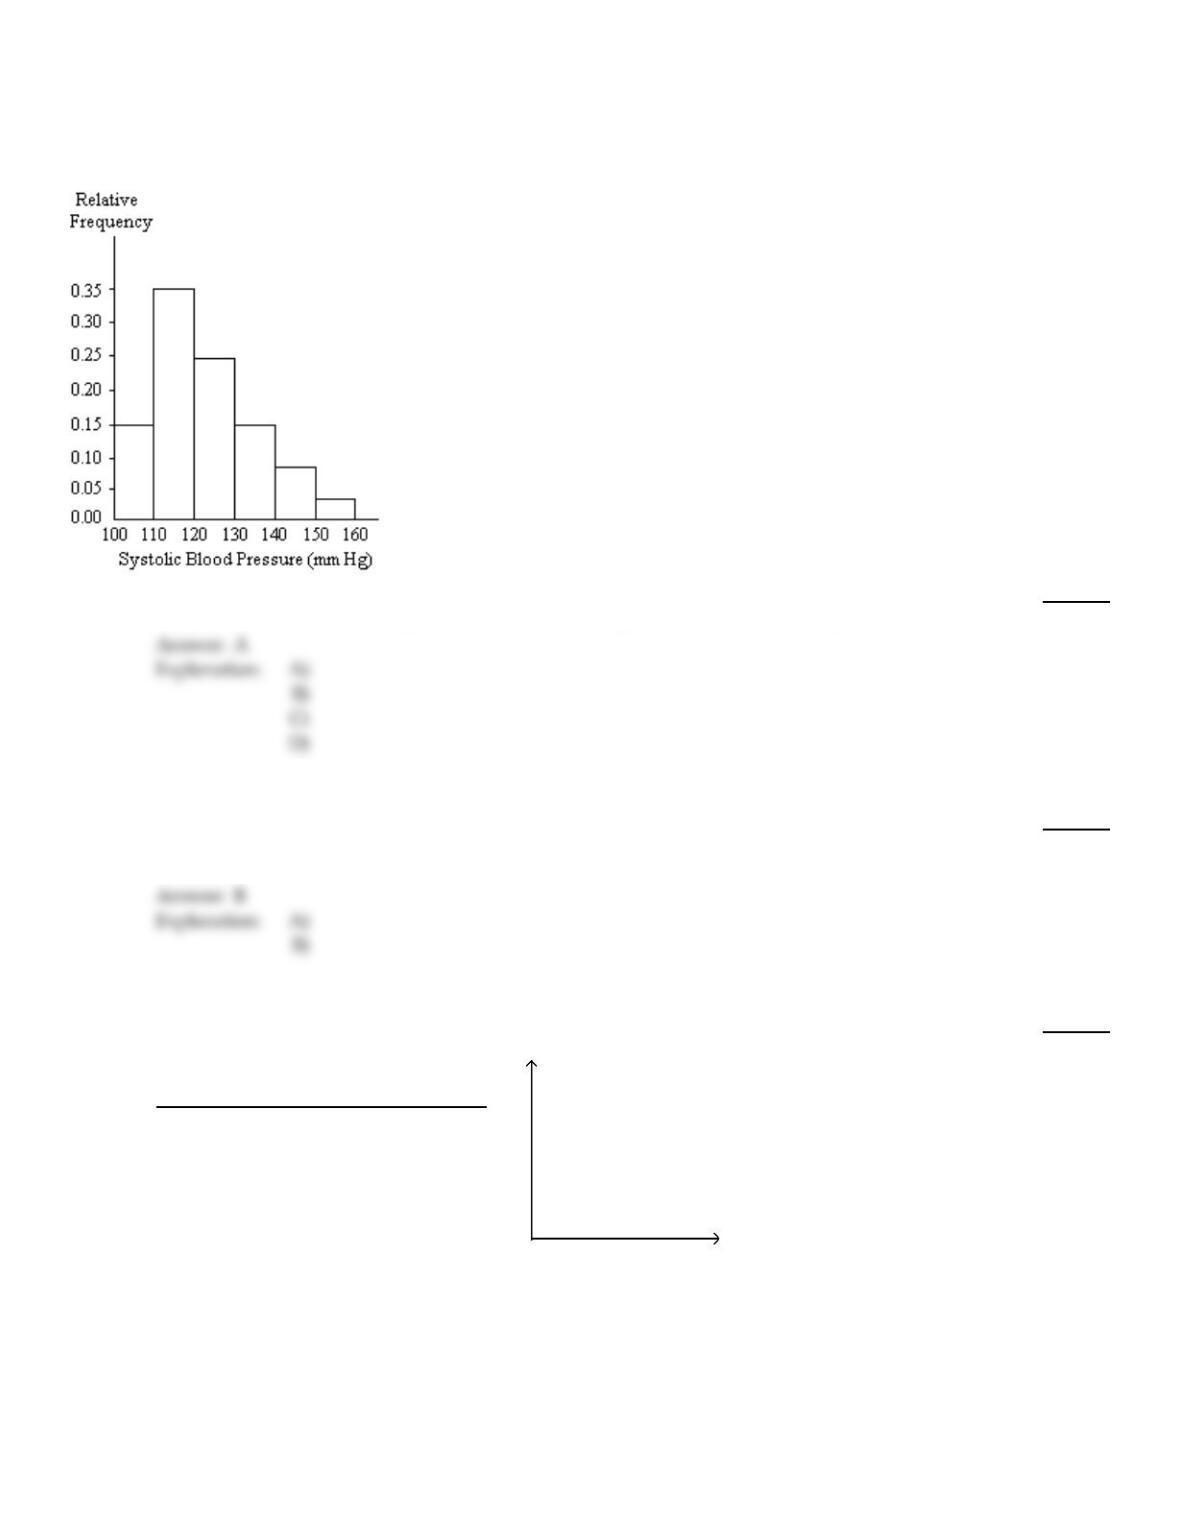
A nurse measured the blood pressure of each person who visited her clinic. Following is a relative–frequency histogram
for the systolic blood pressure readings for those people aged between 25 and 40. Use the histogram to answer the
question. The blood pressure readings were given to the nearest whole number.
92)
What common class width was used to construct the frequency distribution?
92)
A)
10
B)
11
C)
9
D)
100
Classify the data as either discrete or continuous.
93)
The average speed of cars passing a busy intersection between 4:30 P.M. and 6:30 P.M. on a Friday
is 32.3 mi/h.
93)
A)
Discrete
B)
Continuous
Construct the requested graph.
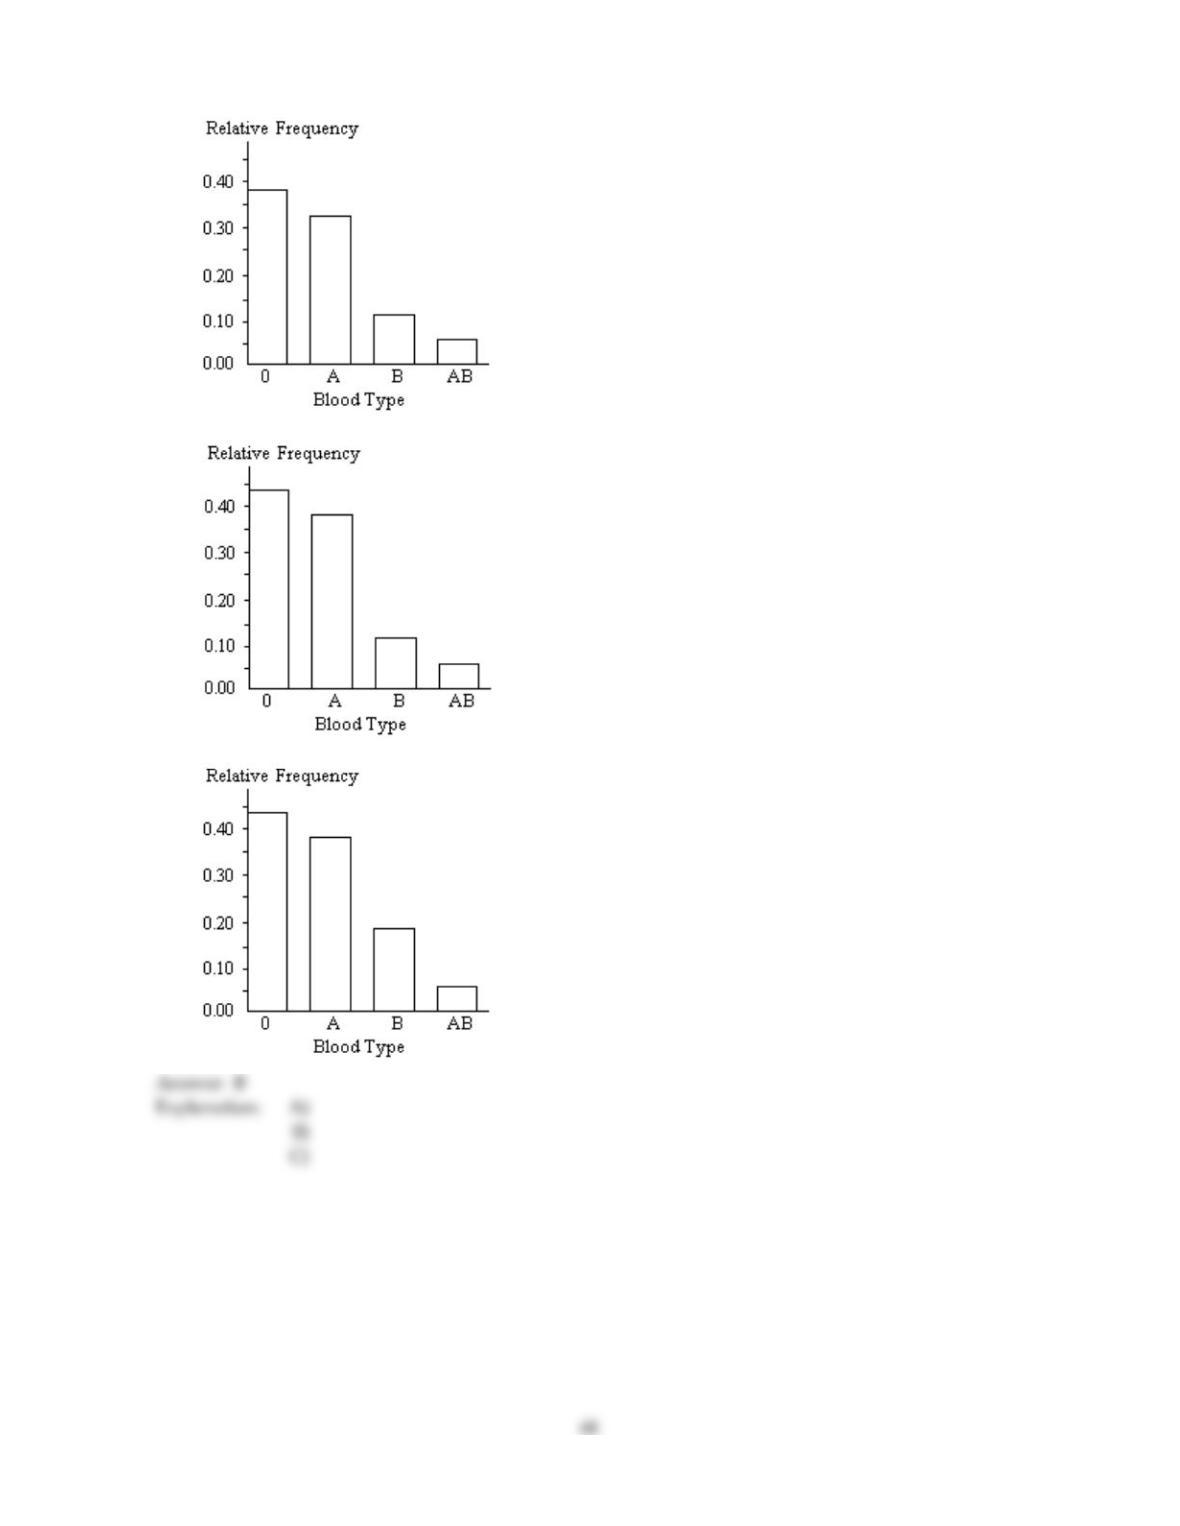
94)
Construct a bar graph for the relative frequencies given.
Blood Frequency Relative
type frequency
O22 0.44
A19 0.38
B 6 0.12
AB 30.06
94)
47
A)
B)
C)
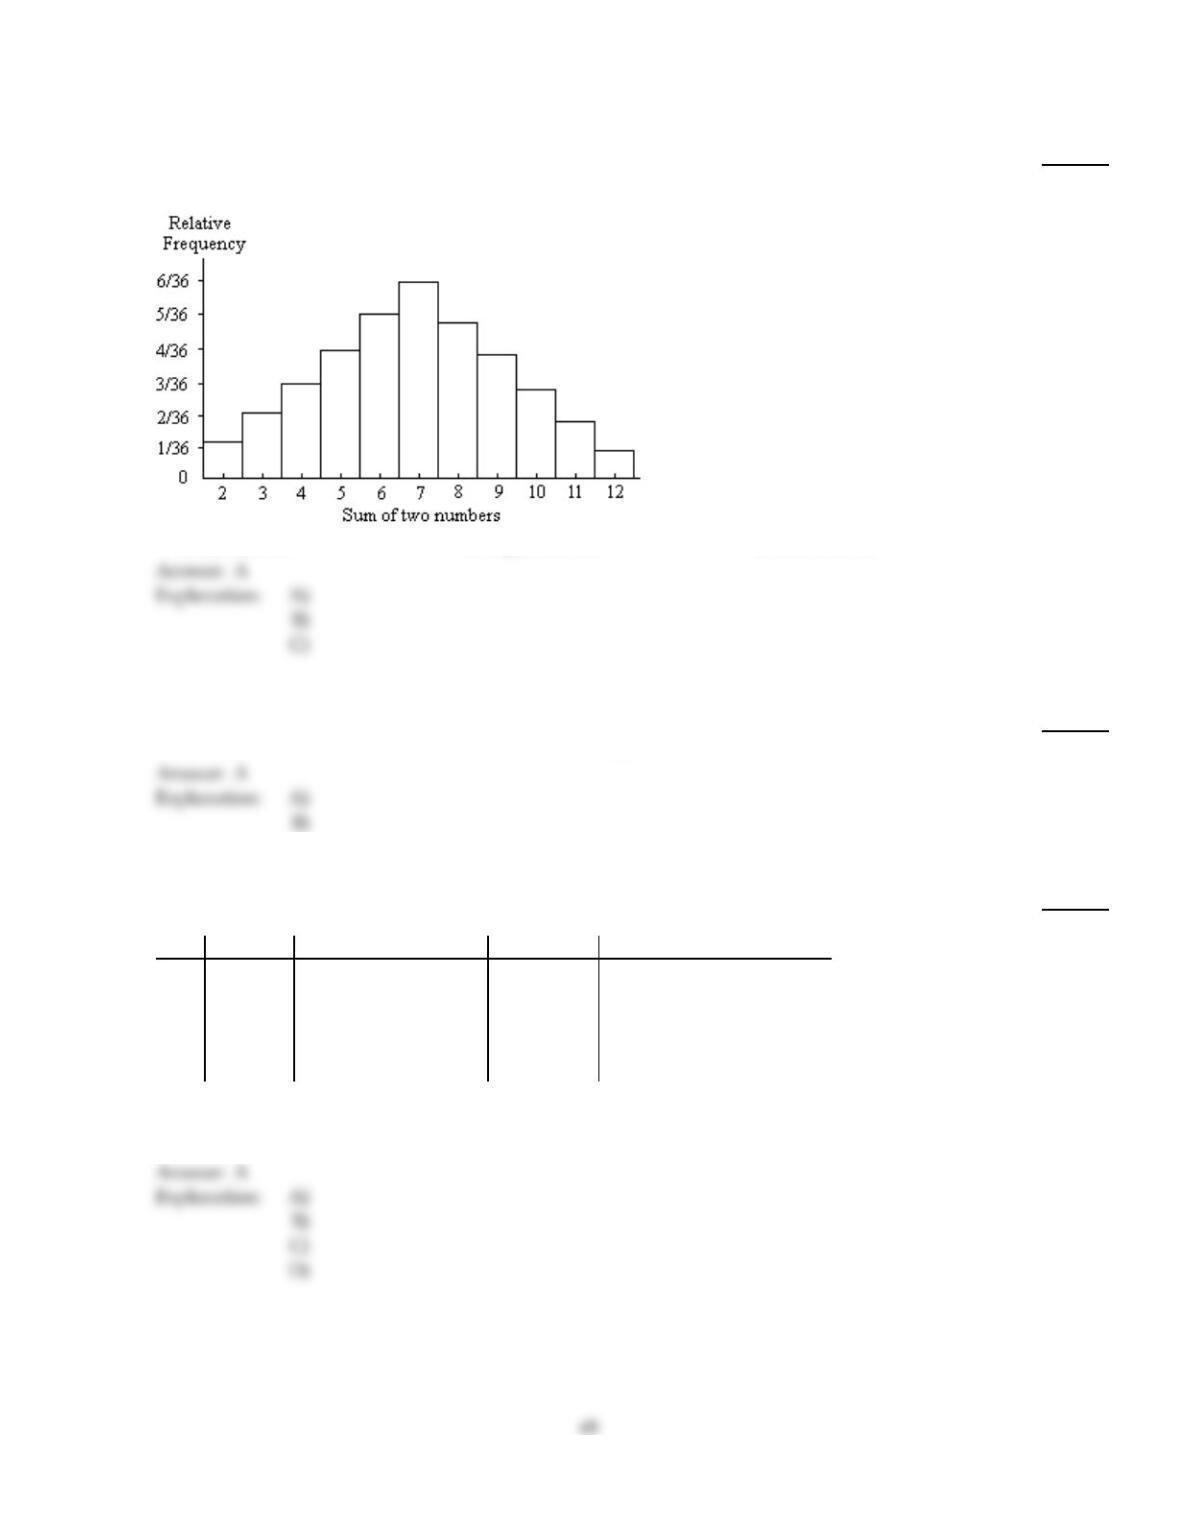
A graphical display of a data set is given. State whether the distribution is (roughly) symmetric, right skewed, or left
skewed.
95)
Two dice were rolled and the sum of the two numbers was recorded. This procedure was repeated
400 times. The results are shown in the relative frequency histogram below.
95)
A)
Symmetric
B)
Right skewed
C)
Left skewed
Tell whether the statement is true or false.
96)
Arranging the age of students in a class in from youngest to oldest yields ordinal data.
96)
A)
True
B)
False
Identify the variable.
97)
The following table gives the top five movies at the box office this week.
Rank Last week Movie title Studio Box office sales ($ millions)
1N/A Pirate Adventure Movie Giant 35.2
2 2 Secret Agent Files G.M.G. 19.5
3 1 Epic Super Hero Team 21st Century 14.3
4 5 Reptile Ride Movie Giant 10.1
5 4 Must Love Cats Dreamboat 9.9
Identify the variable under consideration in the fourth column?
97)
A)
studio name
B)
movie title
C)
rank
D)
box office sales
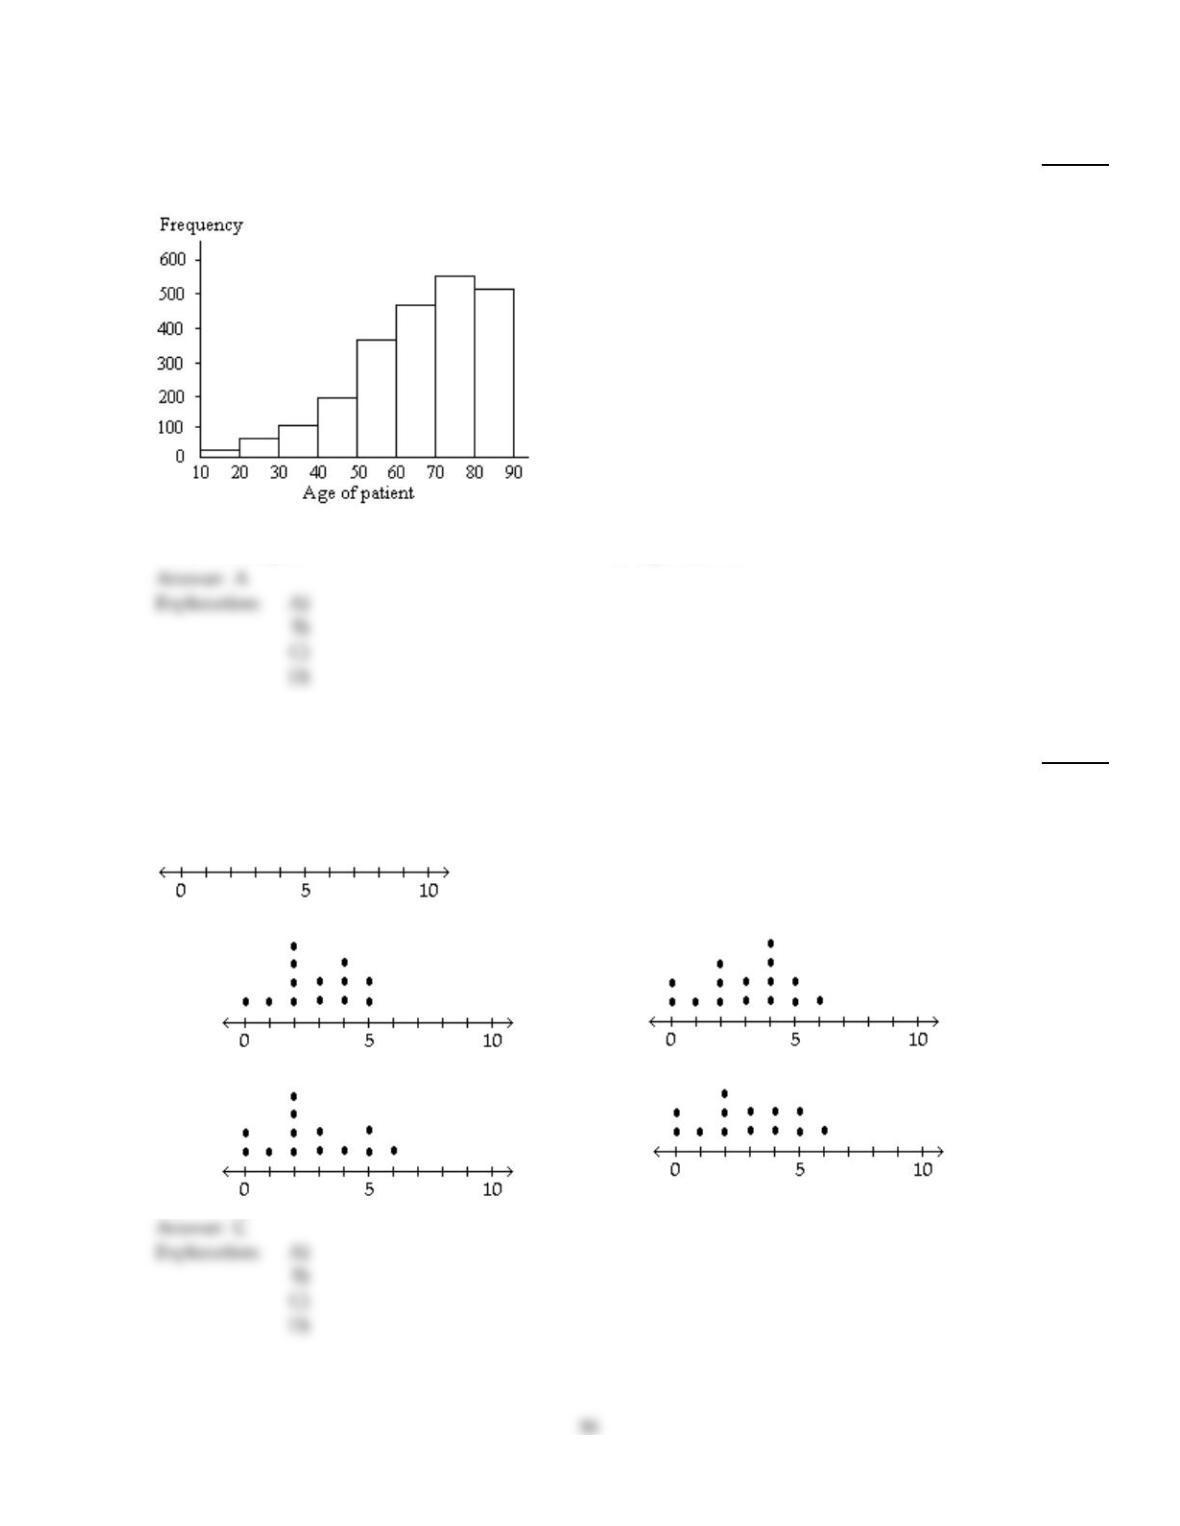
A graphical display of a data set is given. Identify the overall shape of the distribution as (roughly) bell–shaped,
triangular, uniform, reverse J–shaped, J–shaped, right skewed, left skewed, bimodal, or multimodal.
98)
The ages of a group of patients being treated at one hospital for osteoporosis are summarized in the
frequency histogram below.
98)
A)
Left skewed
B)
Reverse J–shaped
C)
Bell–shaped
D)
Right skewed
Construct a dotplot for the given data.
99)
A manufacturer records the number of errors each work station makes during the week. The data
are as follows.
6 3 2 3 5 2 0 2 5 4 2 0 1
99)
A)
B)
C)
D)
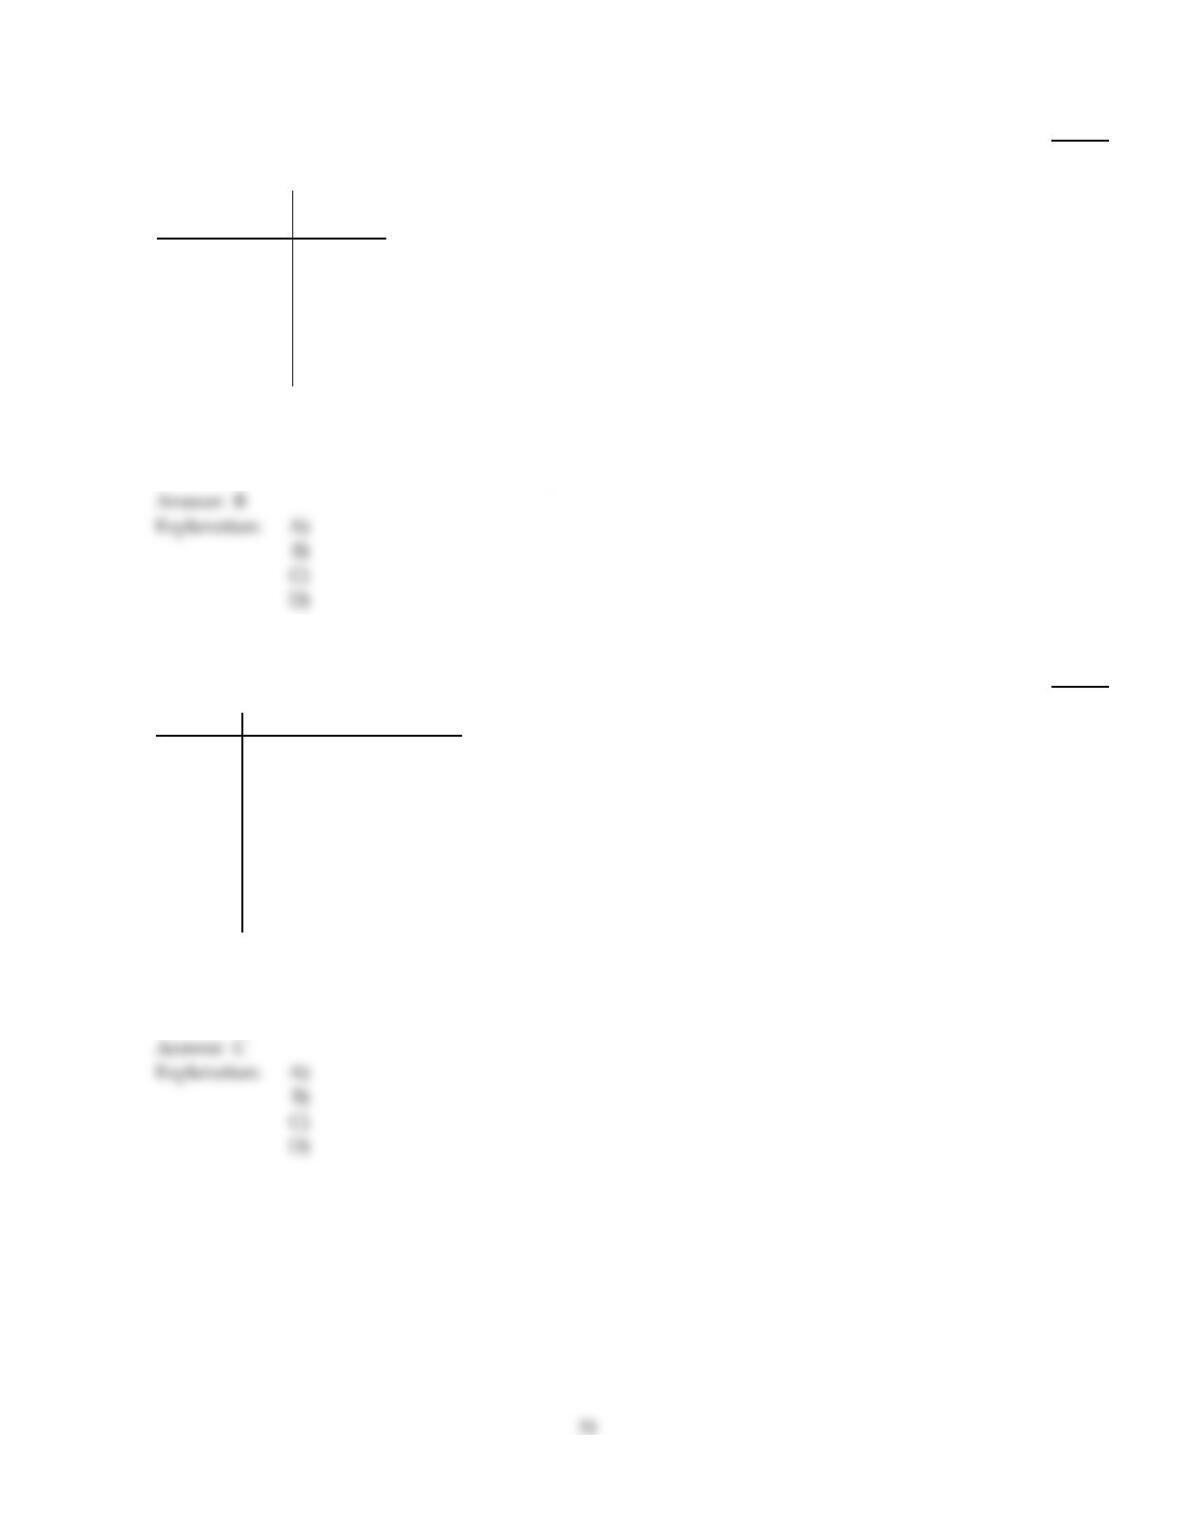
Provide the requested table entry.
100)
The data in the following table represent heights of students at a highschool. Find the value of the
missing entry.
Height
(centimeters) Relative
frequency
142–under 152 0.03
152–under 162 0.22
162–under 172 0.25
172–under 182 0.26
182–under 192
192–under 202 0.04
100)
A)
0.16
B)
0.20
C)
20%
D)
The value cannot be determined from the given data.
Identify the variable.
101)
The following table shows the average weight of offensive linemen for each given football team.
Team Average weight (pounds)
Gators 303.52
Lakers 326.78
Eagles 290.61
Pioneers 321.96
Lions 297.35
Mustangs 302.49
Rams 345.88
Buffalos 329.24
Identify the variable under consideration in the second column?
101)
A)
Gators
B)
pounds
C)
average weight of offensive linemen
D)
team name
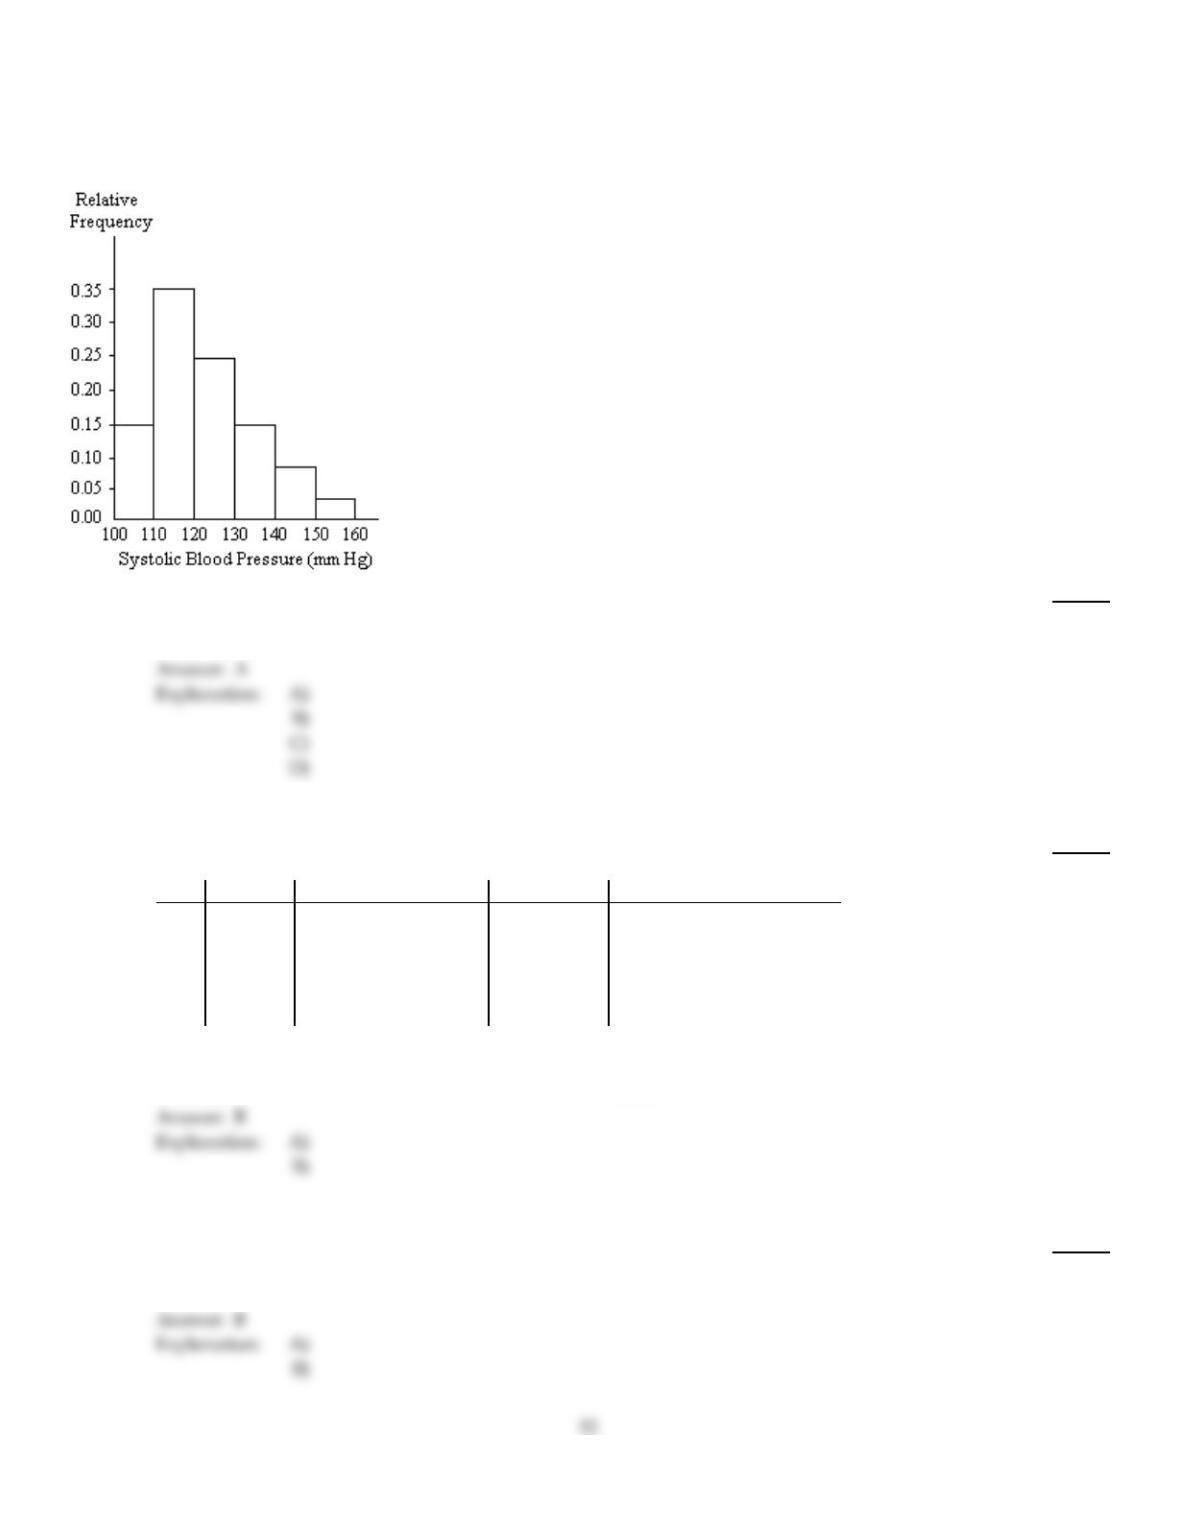
A nurse measured the blood pressure of each person who visited her clinic. Following is a relative–frequency histogram
for the systolic blood pressure readings for those people aged between 25 and 40. Use the histogram to answer the
question. The blood pressure readings were given to the nearest whole number.
102)
Given that 300 people were aged between 25 and 40, approximately how many had a systolic blood
pressure reading between 140 and 149 inclusive?
102)
A)
24
B)
2
C)
240
D)
8
Classify the data as either qualitative or quantitative.
103)
The following table gives the top five movies at the box office this week.
Rank Last week Movie title Studio Box office sales ($ millions)
1N/A Pirate Adventure Movie Giant 35.2
2 2 Secret Agent Files G.M.G. 19.5
3 1 Epic Super Hero Team 22nd Century 14.3
4 5 Reptile Ride Movie Giant 10.1
5 4 Must Love Cats Dreamboat 9.9
What kind of data is provided by the information in the fifth column?
103)
A)
Qualitative
B)
Quantitative
Tell whether the statement is true or false.
104)
A variable whose possible values are 1.15, 1.20, 1.25, 1.30, 1.35, 1.40, 1.45, 1.50, 1.55, 1.60, is a
continuous variable.
104)
A)
True
B)
False
Construct a stem–and–leaf diagram for the given data.
105)
The diastolic blood pressures for a sample of patients at a clinic were as follows. The measurements
are in mmHg.
78 87 91 85 97 102 73 90 110 105
94 85 81 95 77 106 84 111 83 92
79 81 96 88 100 85 89 101 83 120
88 95 78 74 105 85 87 92 114 83
105)
A)
7
8
9
10
11
12
8 3 7 9 8 4
7 5 5 1 4 3 1 8 5 9 3 8 5 7 3
1 7 0 4 5 2 6 5 2
2 5 6 0 1 5
0 1 4
0
B)
7
8
9
10
8 3 7 9 8 4
7 5 5 1 4 3 1 8 5 9 3 8 5 7 3
1 7 0 4 5 2 6 5 2
2 0 5 6 1 0 1 5 4
A graphical display of a data set is given. Identify the overall shape of the distribution as (roughly) bell–shaped,
triangular, uniform, reverse J–shaped, J–shaped, right skewed, left skewed, bimodal, or multimodal.
106)
A stem–and–leaf diagram is given below for the ages of the patients at a hospital.
0
1
2
3
4
5
6
7
8
9
4 0
4 2
0 2 0 3
0 1 5 8 2 9
3 4 5 1 7 1 8 2
3 6 2 6 8 9 3 3 0 6 3 6 3
6 2 8 1 8 3 3 6 2 6 9 0 5 0 3 6 7 5
2 5 3 7 8 9 5 3 6 7 8 4 8 9 3 6 7 8 5 5
4 6 0 8 5 3 2 6 2 7 8 9 0
1 4 6 7 3
106)
A)
Reverse J–shaped
B)
Left skewed
C)
Right skewed
D)
J–shaped
B
A
Classify the data as either qualitative or quantitative.
107)
The following table shows the average weight of offensive linemen for each given football team.
Team Average weight (pounds)
Gators 303.52
Lakers 326.78
Eagles 290.61
Pioneers 321.96
Lions 297.35
Mustangs 302.49
Rams 345.88
Buffalos 329.24
What kind of data is provided by the information in the first column?
107)
A)
Qualitative
B)
Quantitative
A graphical display of a data set is given. Identify the overall shape of the distribution as (roughly) bell–shaped,
triangular, uniform, reverse J–shaped, J–shaped, right skewed, left skewed, bimodal, or multimodal.
108)
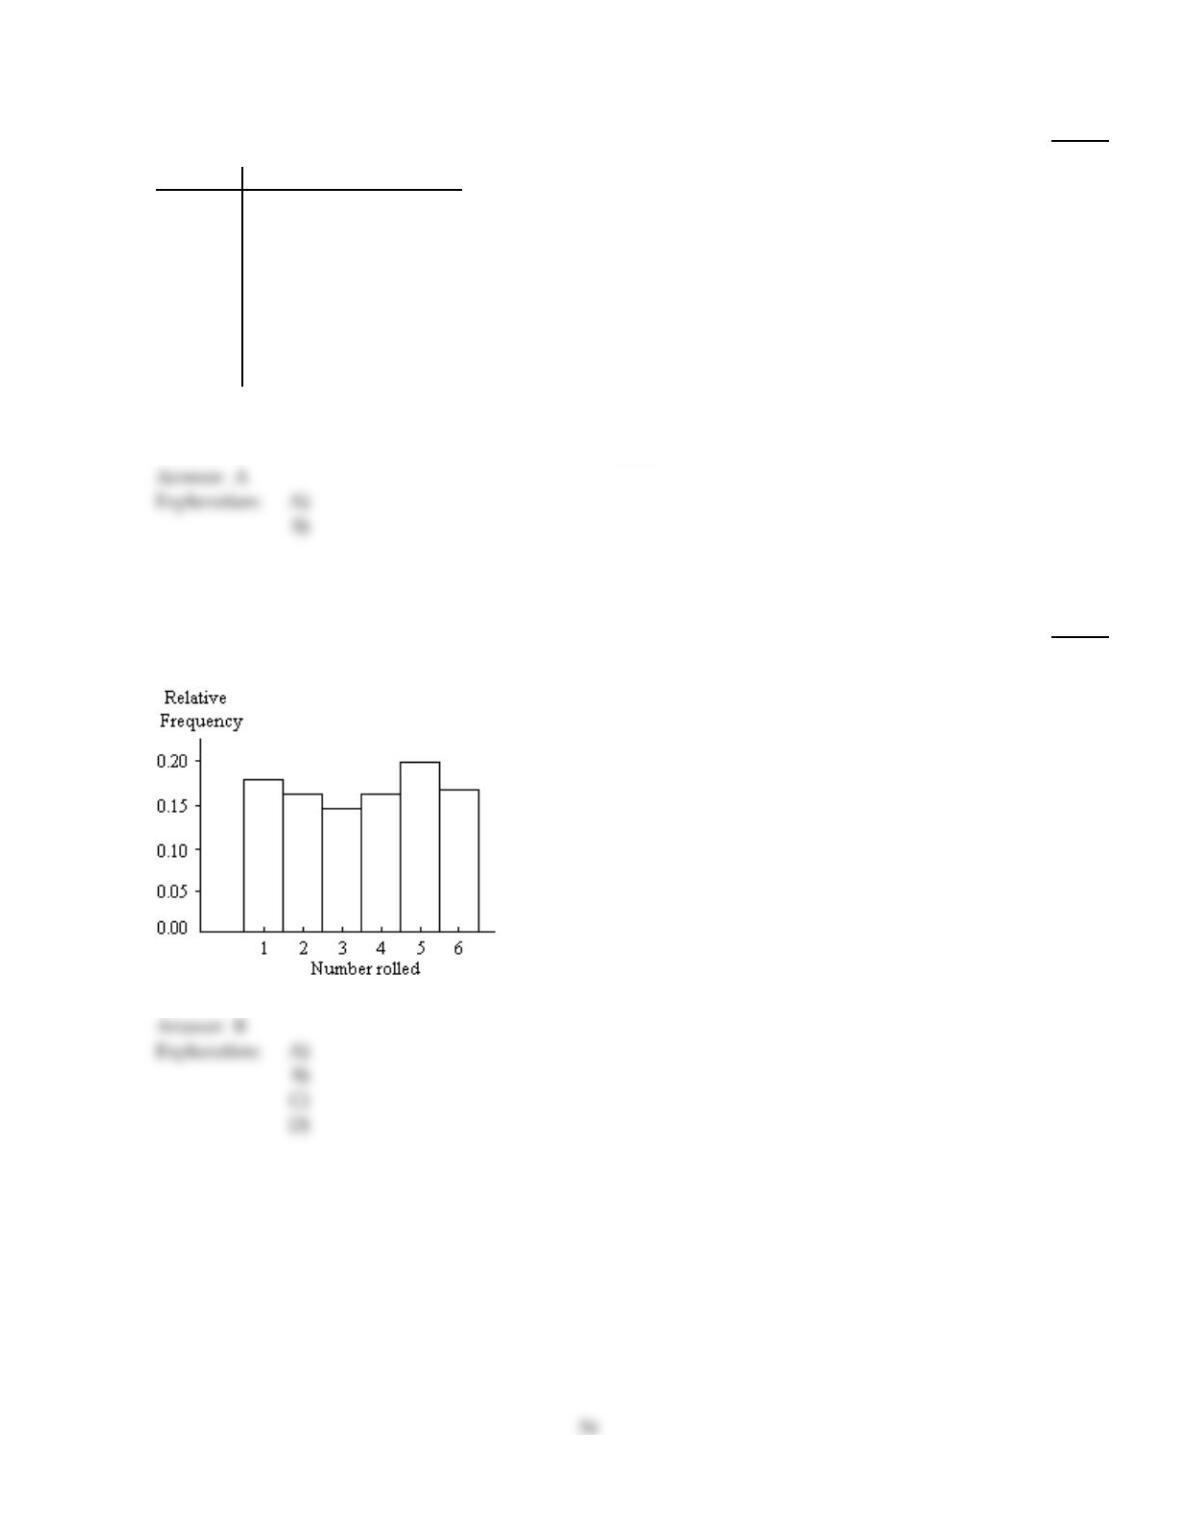
A die was rolled 200 times and a record was kept of the numbers obtained. The results are shown
in the relative frequency histogram below.
108)
A)
Left skewed
B)
Uniform
C)
J–shaped
D)
Triangular
109)
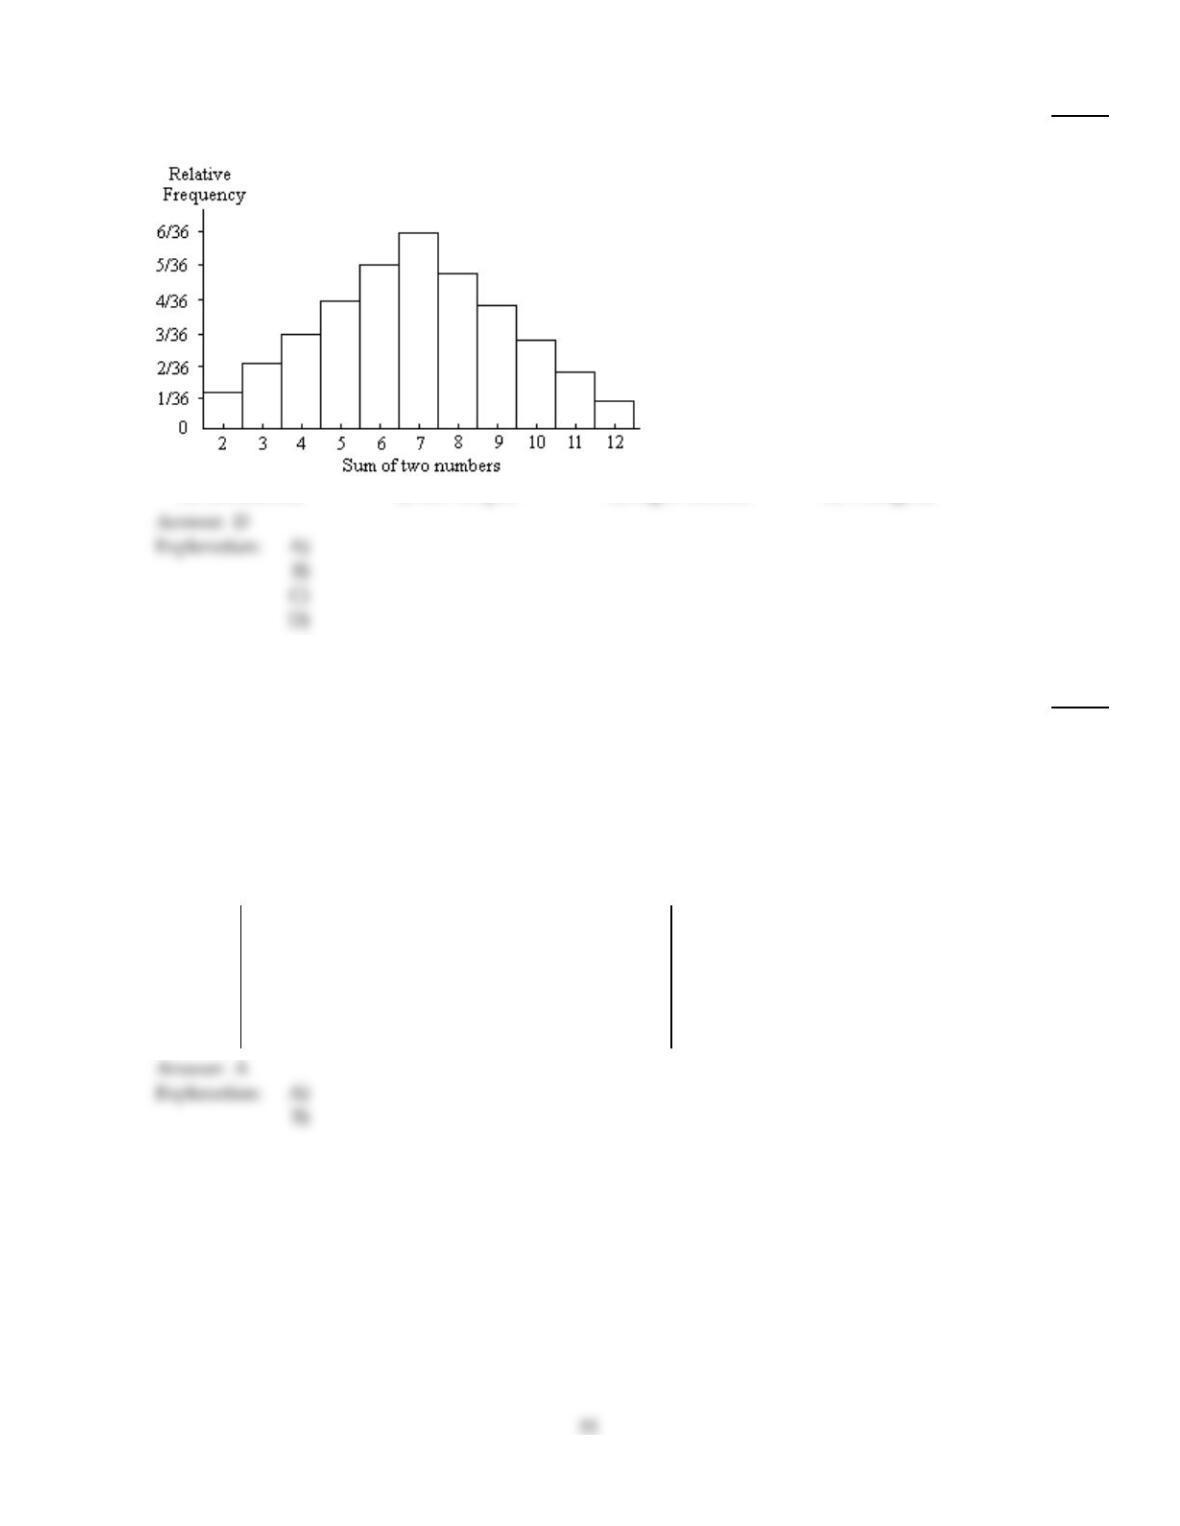
Two dice were rolled and the sum of the two numbers was recorded. This procedure was repeated
400 times. The results are shown in the relative frequency histogram below.
109)
A)
Left skewed
B)
Bell–shaped
C)
Right–skewed
D)
Triangular
Construct a stem–and–leaf diagram for the given data.
110)
The lengths (in inches) of a random sample of bottlenose dolphins are given below. Truncate each
observation by dropping the decimal part, then construct a stem–and–leaf diagram of the
truncated data using two lines per stem.
97.7 142.2 105.2 110.5 115.8 112.4
136.7 99.9 101.2 124.3 121.9 98.8
121.8 132.7 128.9 117.8 141.9 108.2
118.0 127.3 133.4 116.9 104.4 132.0
110)
A)
9
10
11
12
13
14
7 8 9
1 4 5 8
0 2 5 6 7 8
1 1 4 7 8
2 2 3 6
1 2
B)
9
10
11
12
13
14
8 9
0 1 4 5 8
1 2 6 7 8 8
2 2 4 7 9
2 3 3 7
2 2
Provide the requested table entry.
111)
The data in the following table represent heights of students at a highschool. Find the value of the
missing entry.
Height
(centimeters) Relative
frequency
142–under 152 0.03
152–under 162 0.21
162–under 172 0.27
172–under 182 0.28
182–under 192
192–under 202 0.02
111)
A)
0.21
B)
19%
C)
0.19
D)
The value cannot be determined from the given data.
Construct a frequency distribution for the given qualitative data.
112)
The table shows the country represented by the winner of the 10,000 meter run in the Summer
Olympic Games in various years.
Year Country
1912 Finland
1920 Finland
1924 Finland
1928 Finland
1932 Poland
1936 Finland
1948 Czechoslovakia
1952 Czechoslovakia
1956 USSR
1960 USSR
1964 United States
1968 Kenya
1972 Finland
1976 Finland
1980 Ethiopia
1984 Italy
1988 Morocco
1992 Morocco
112)
56
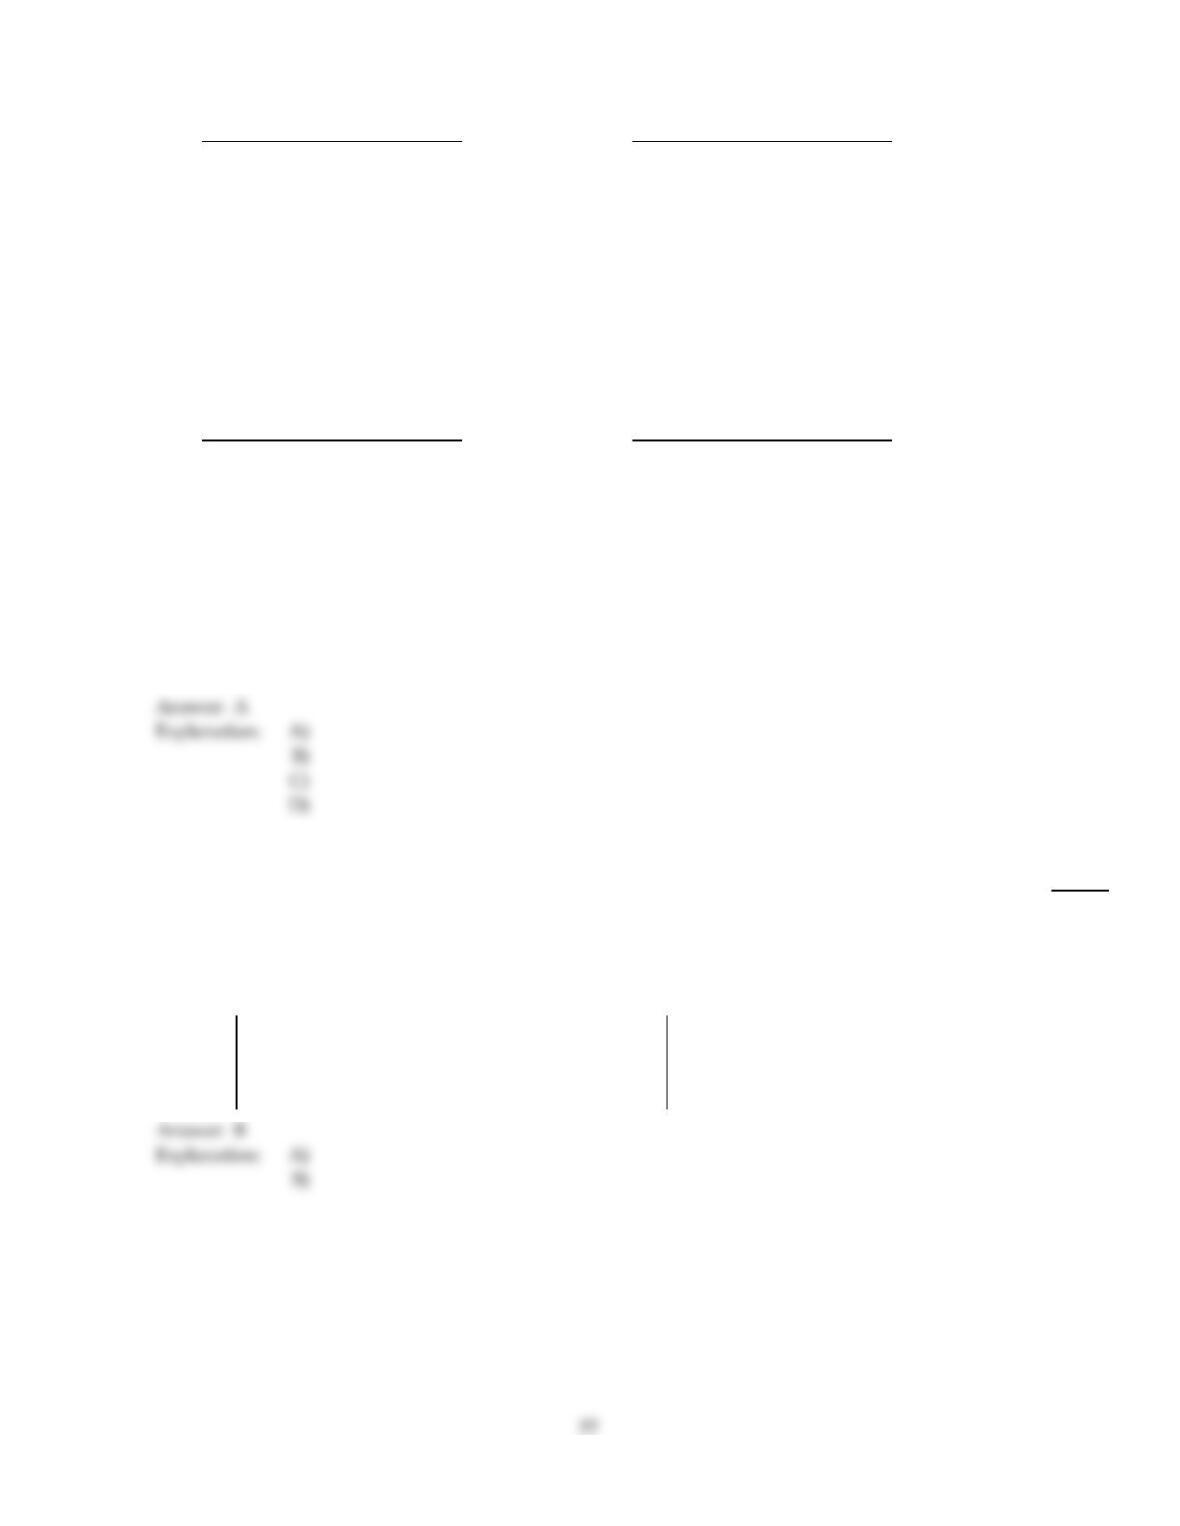
A)
Country Frequency
Finland 7
Poland 1
Czechoslovakia 2
USSR 2
United States 1
Kenya 1
Ethiopia 1
Italy 1
Morocco 2
B)
Country Frequency
Finland 7
Poland 1
Czechoslovakia 2
USSR 2
United States 1
Ethiopia 1
Italy 1
Morocco 2
C)
Country Frequency
Finland 7
Poland 1
Czechoslovakia 2
USSR 2
United States 1
Kenya 1
France 1
Ethiopia 1
Italy 1
Morocco 2
D)
Country Frequency
Finland 6
Poland 1
Czechoslovakia 2
USSR 2
United States 1
Kenya 1
Ethiopia 1
Italy 1
Morocco 2
Construct a stem–and–leaf diagram for the given data.
113)
The attendance counts for this season‘s basketball games are listed below.
227 239 215 219
221 233 229 233
235 228 245 231
113)
A)
21
22
23
24
5 7 9
1 8 9
1 3 3 5 9
5
B)
21
22
23
24
5 9
7 1 9 8
9 3 3 5 1
5
Classify the data as either discrete or continuous.
114)
The number of cars passing a busy intersection between 4:30 P.M. and 6:30 P.M. on a Monday is
2,200.
114)
A)
Discrete
B)
Continuous
Complete the contingency table and use it to solve the problem.
115)
The partially filled contingency table gives the frequencies of the data on age (in years) and sex
from the residents of a retirement home.
Age (yrs)
60–69 70–79 Over 79 Total
Male 6 3 5
Female 14 8 4
Total
What is the relative frequency for persons in the age group 60–69 ?
115)
A)
2
3
B)
1
2
C)
1
4
D)
1
3
Tell whether the statement is true or false.
116)
A variable which can take any real–number value in the interval [ 0, 1 ] is a continuous variable.
116)
A)
True
B)
False
Complete the contingency table and use it to solve the problem.
117)
The partially filled contingency table gives the relative frequencies of the data on age (in years) and
sex from the residents of a retirement home.
Age (yrs)
60–69 70–79 Over 79 Total
Male 0.17 0.1 0.13
Female 0.2 0.1 0.3
Total 1
What percentage of residents are males in the age group 60–79?
117)
A)
28.5%
B)
29%
C)
26%
D)
27%
Tell whether the statement is true or false.
118)
A person’s blood type can be classified as A, B, AB, or O. In this example, “blood type” is the
variable while A, B, AB, O constitute the data.
118)
A)
True
B)
False
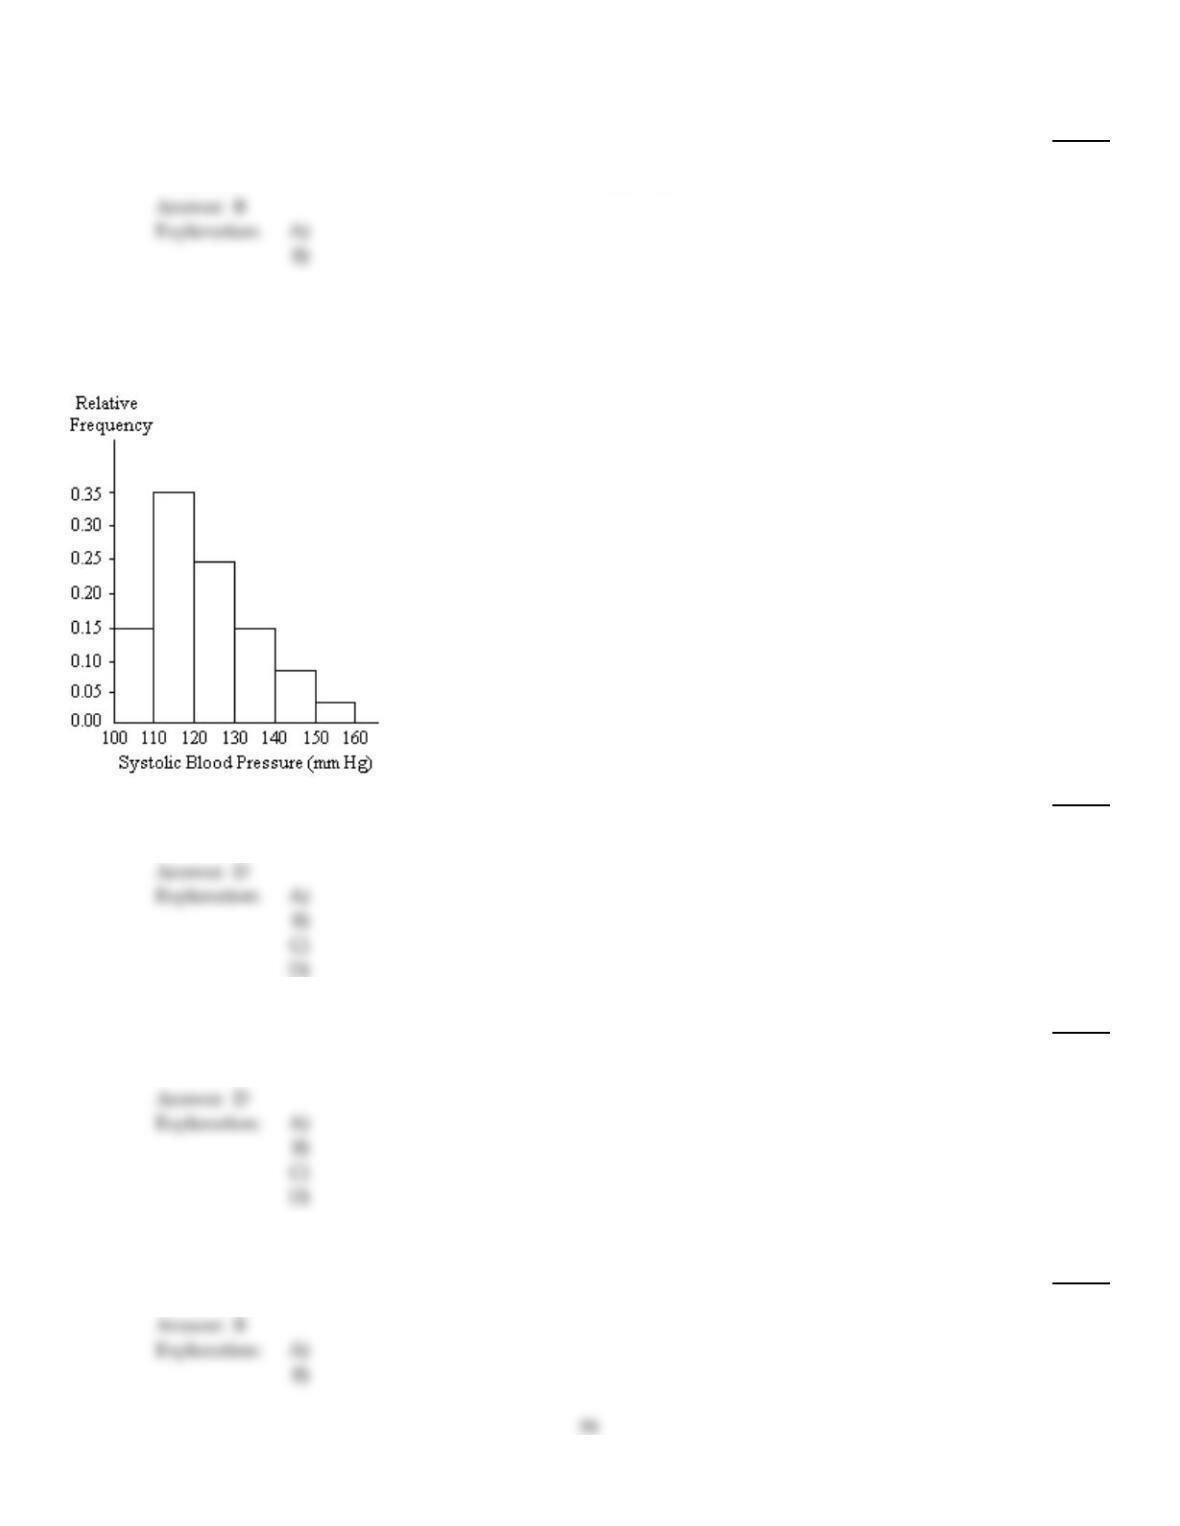
A nurse measured the blood pressure of each person who visited her clinic. Following is a relative–frequency histogram
for the systolic blood pressure readings for those people aged between 25 and 40. Use the histogram to answer the
question. The blood pressure readings were given to the nearest whole number.
119)
Approximately what percentage of the people aged 25–40 had a systolic blood pressure reading
between 110 and 119 inclusive?
119)
A)
0.35%
B)
3.5%
C)
30%
D)
35%
120)
Given that 800 people were aged between 25 and 40, approximately how many had a systolic blood
pressure reading of 140 or higher?
120)
A)
8
B)
11
C)
64
D)
88
Tell whether the statement is true or false.
121)
A discrete variable can only yield whole–number values.
121)
A)
True
B)
False
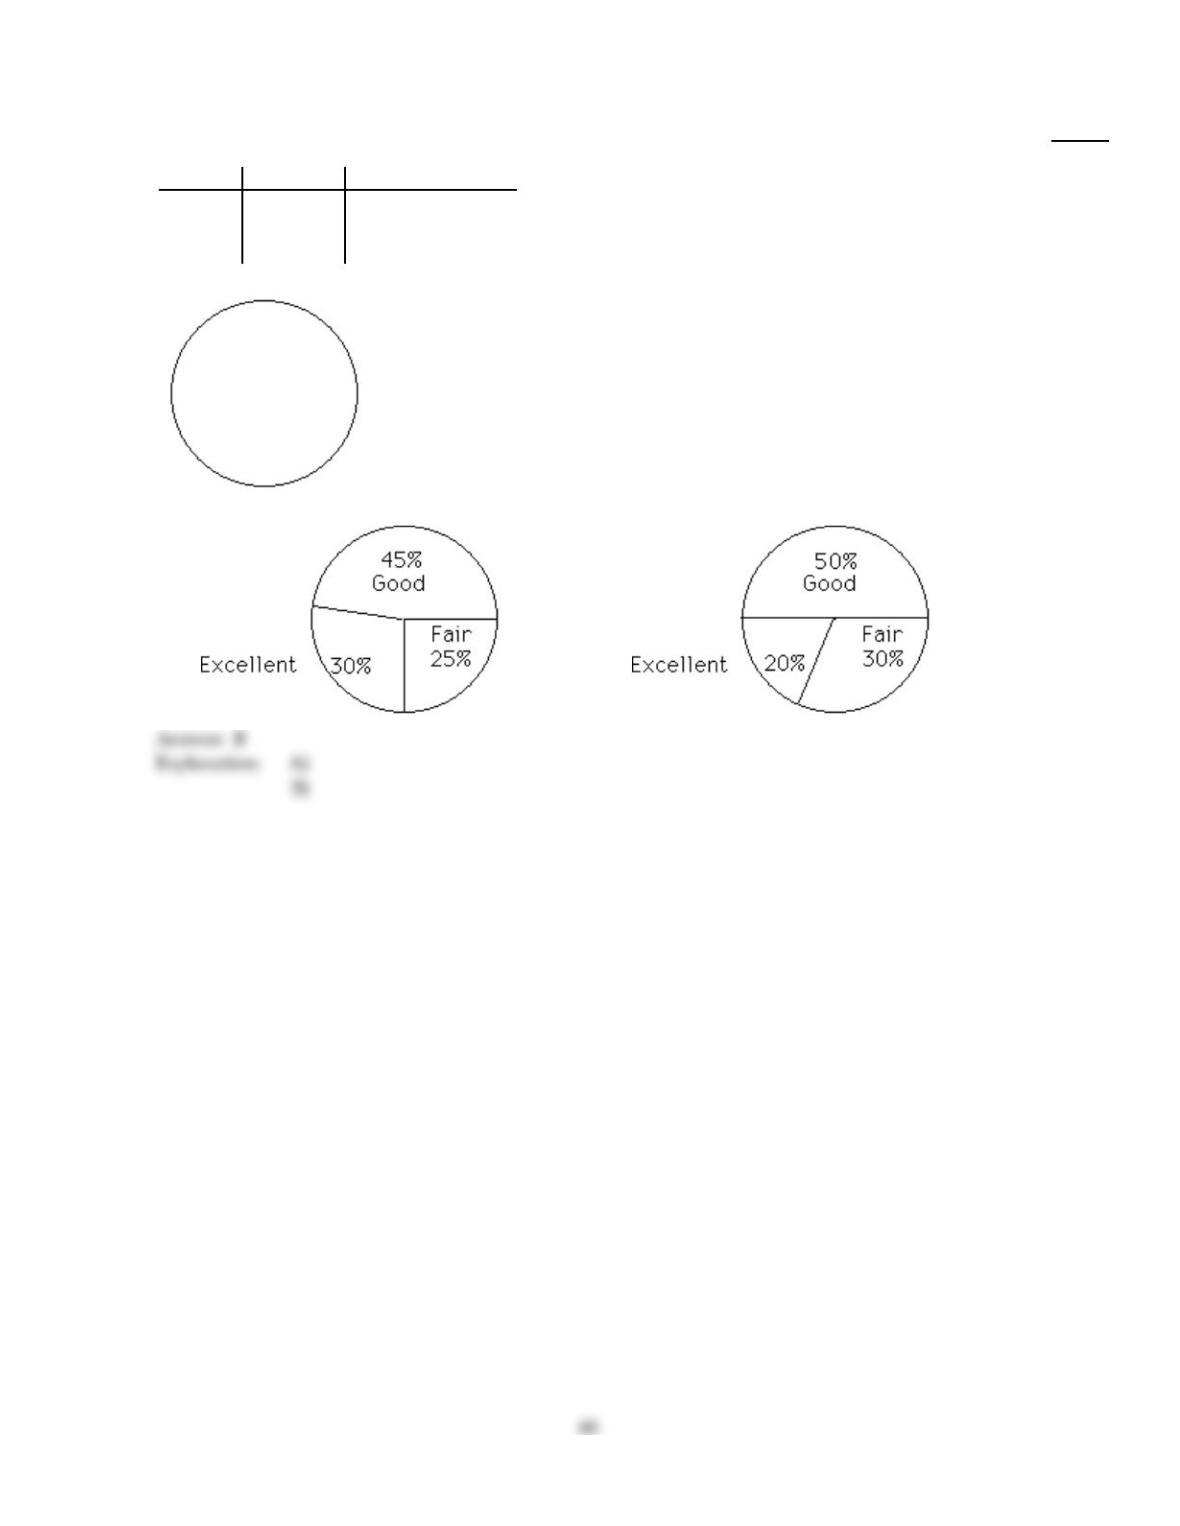
Construct a pie chart representing the given data set.
122)
600 movie critics rated a movie. The following data give the rating distribution.
Rating Frequency Relative Frequency
Excellent 120 0.20
Good 300 0.50
Fair 180 0.30
122)
A)
B)
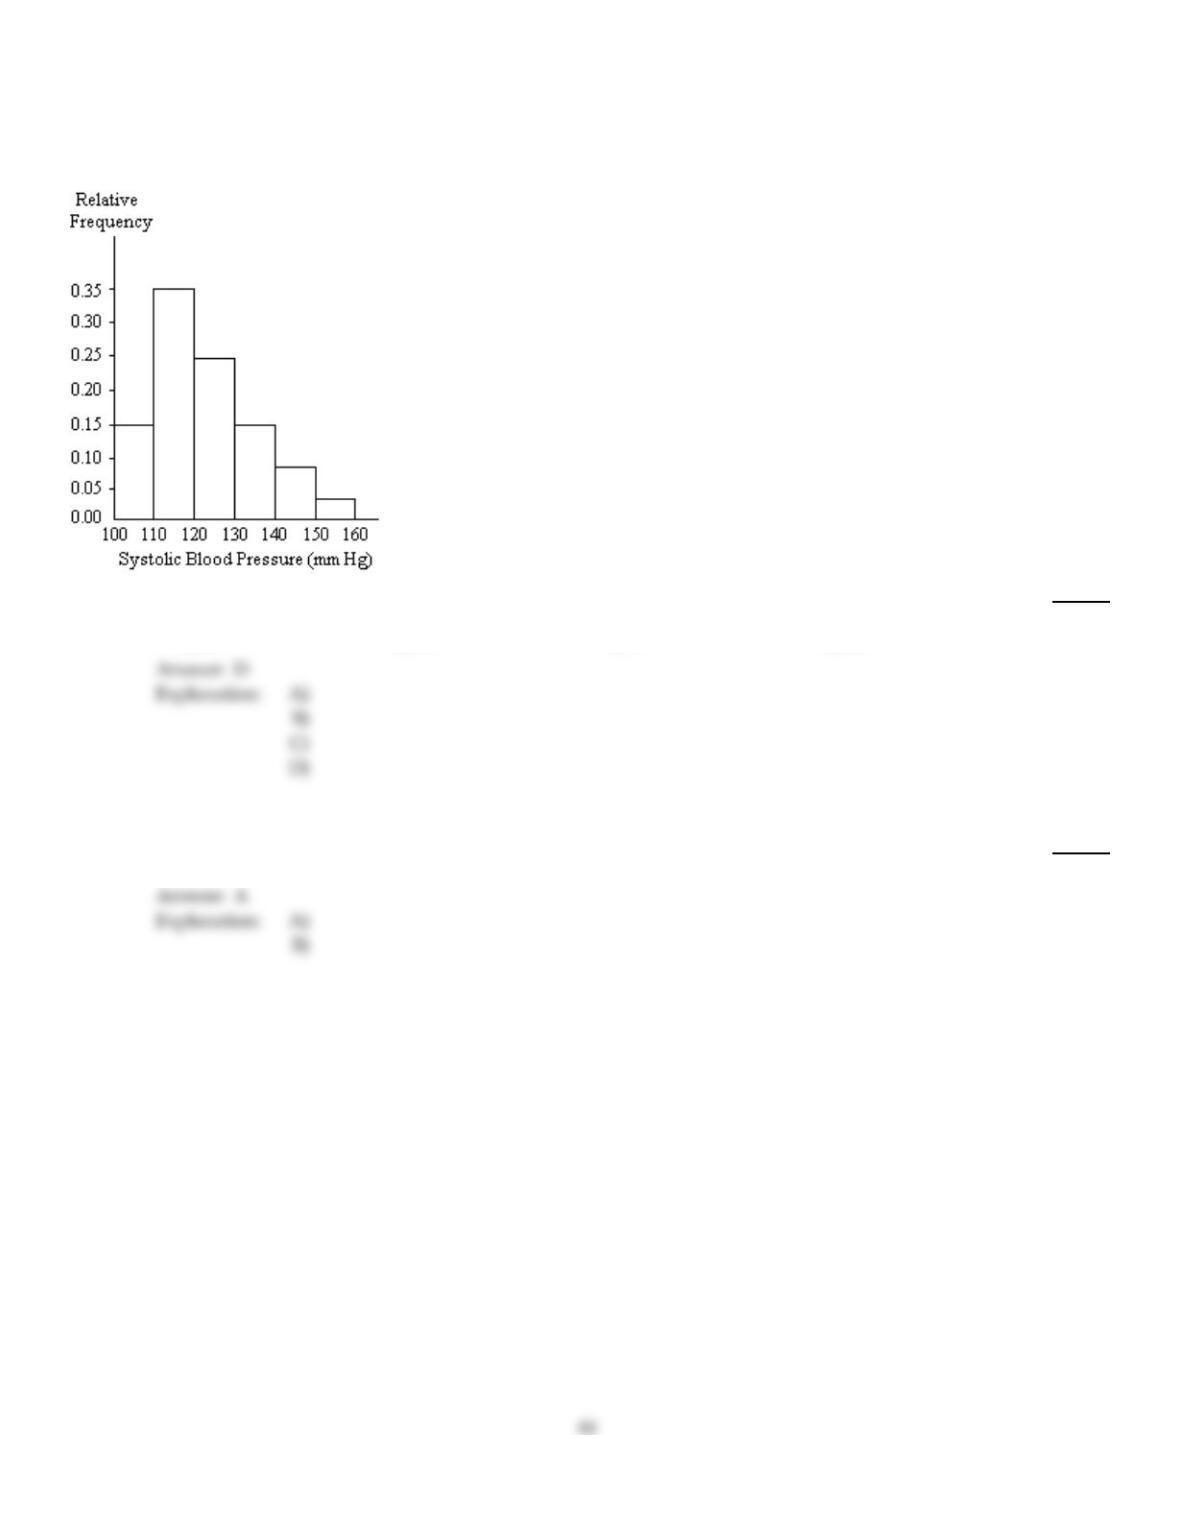
A nurse measured the blood pressure of each person who visited her clinic. Following is a relative–frequency histogram
for the systolic blood pressure readings for those people aged between 25 and 40. Use the histogram to answer the
question. The blood pressure readings were given to the nearest whole number.
123)
Given that 200 people were aged between 25 and 40, approximately how many had a systolic blood
pressure reading between 130 and 149 inclusive?
123)
A)
30
B)
23
C)
5
D)
46
Tell whether the statement is true or false.
124)
A variable whose values are observed by counting something must be a discrete variable.
124)
A)
True
B)
False
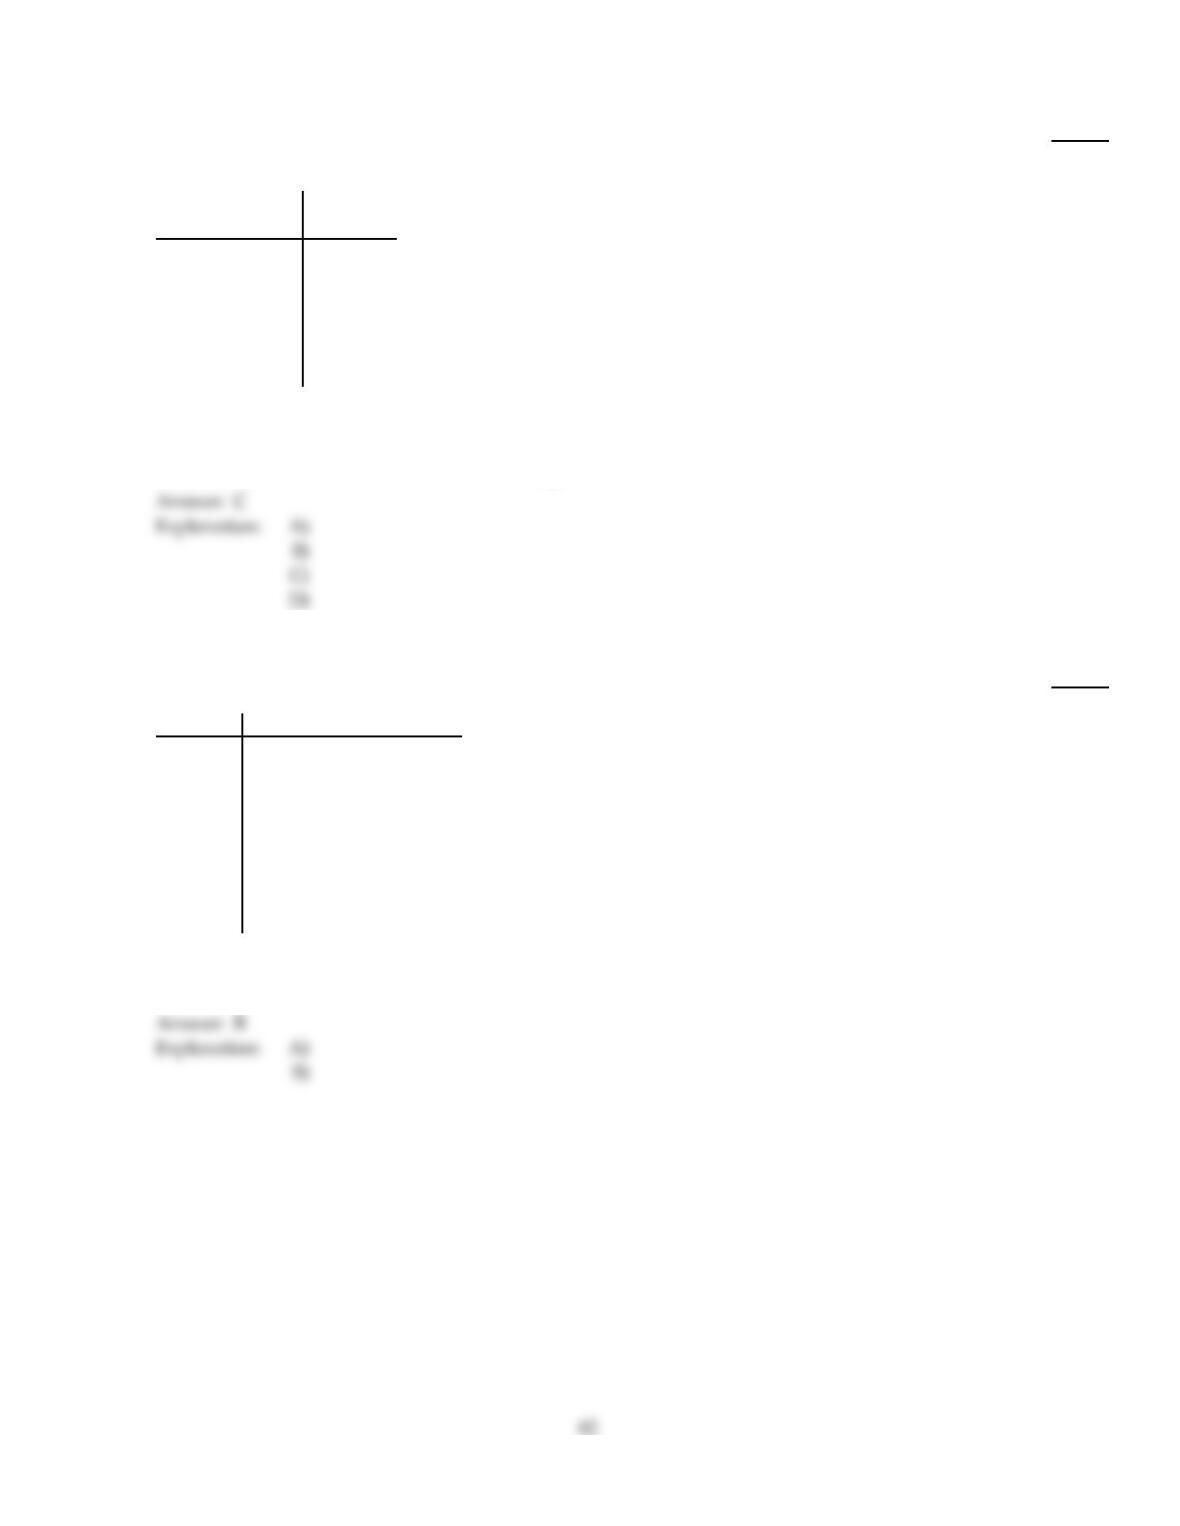
Provide the requested table entry.
125)
The data in the following table reflect the amount of time 40 students in a section of Statistics 101
spend on homework each day. Find the value of the missing entry.
Homework time
(minutes) Relative
frequency
0–14 0.05
15–29 0.10
30–44 0.25
45–59
60–74 0.15
75–89 0.05
125)
A)
16
B)
40%
C)
0.40
D)
The value cannot be determined from the given data.
Classify the data as either qualitative or quantitative.
126)
The following table shows the average weight of offensive linemen for each given football team.
Team Average weight (pounds)
Gators 303.52
Lakers 326.78
Eagles 290.61
Pioneers 321.96
Lions 297.35
Mustangs 302.49
Rams 345.88
Buffalos 329.24
What kind of data is provided by the information in the second column?
126)
A)
Qualitative
B)
Quantitative
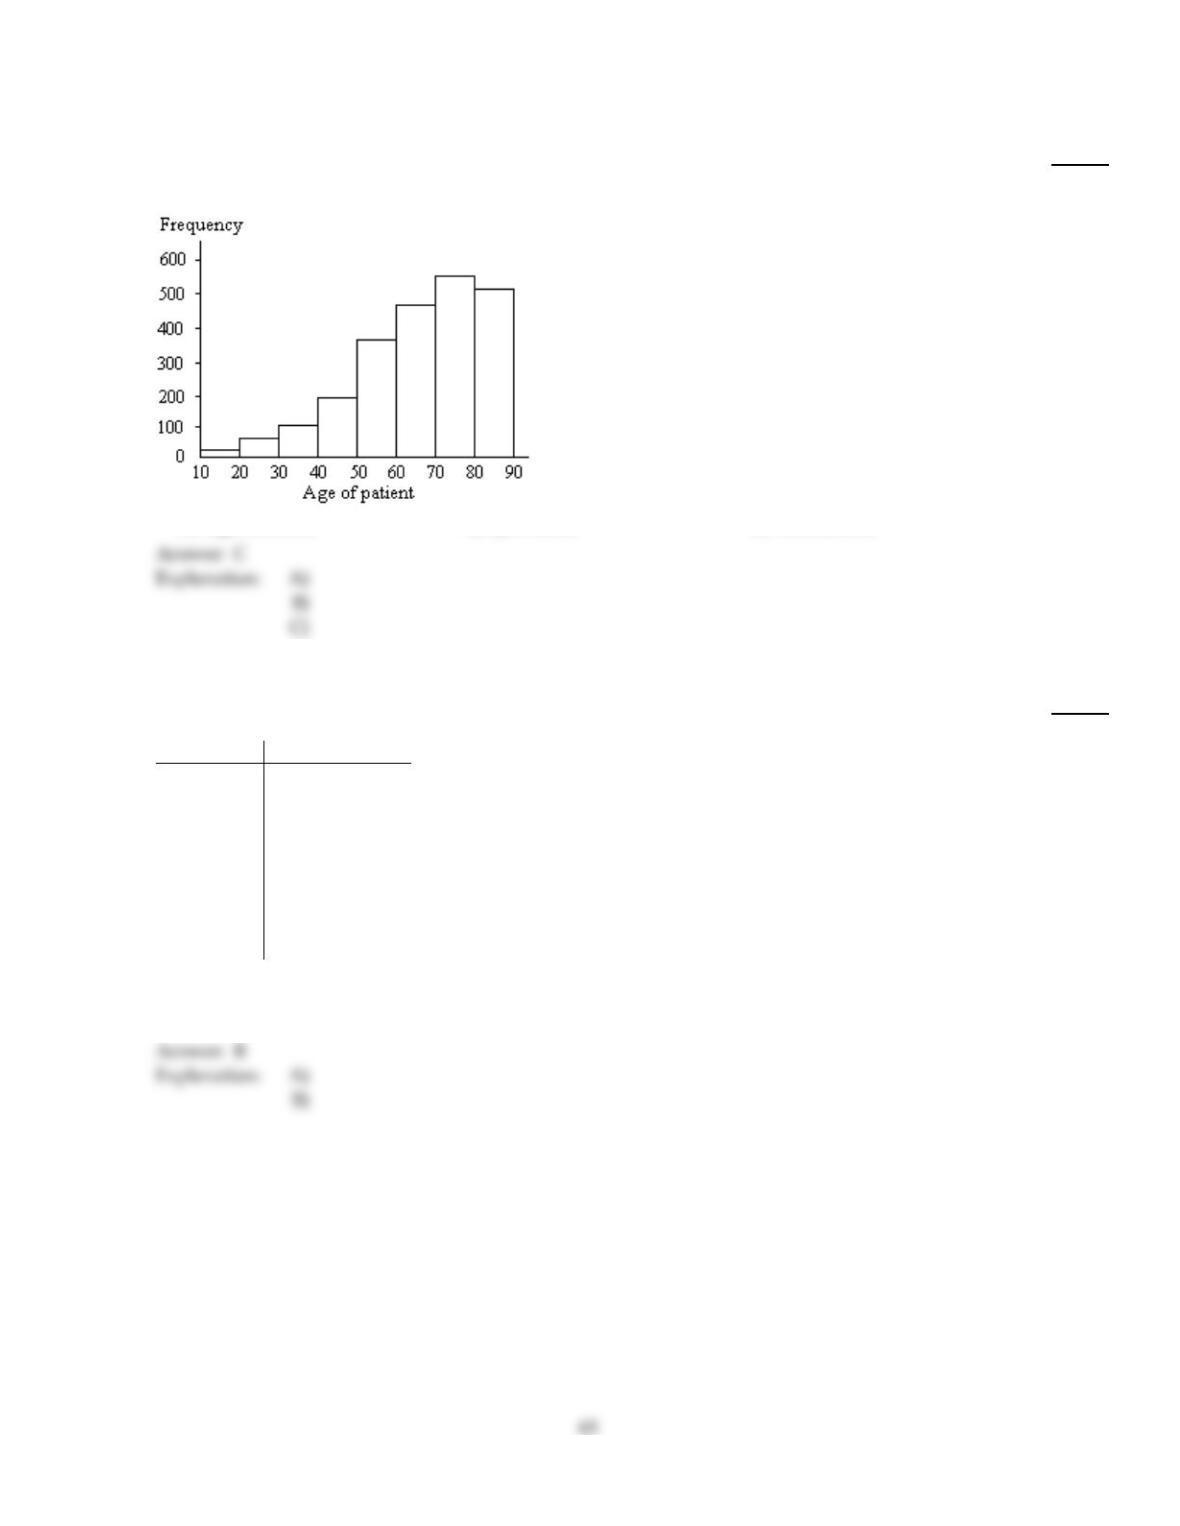
A graphical display of a data set is given. State whether the distribution is (roughly) symmetric, right skewed, or left
skewed.
127)
The ages of a group of patients being treated at one hospital for osteoporosis are summarized in the
frequency histogram below.
127)
A)
Right skewed
B)
Symmetric
C)
Left skewed
Classify the data as either qualitative or quantitative.
128)
A large record company reported the following sales figures for various music media last year.
Media Sales ($ millions)
CD 1477.3
CD single 1.8
MP3 65.9
Vinyl 2.6
Music video 531.4
Mini Disc 0.3
DVD 108.2
Cassette 3.4
What kind of data is provided by the information in the second column?
128)
A)
Qualitative
B)
Quantitative
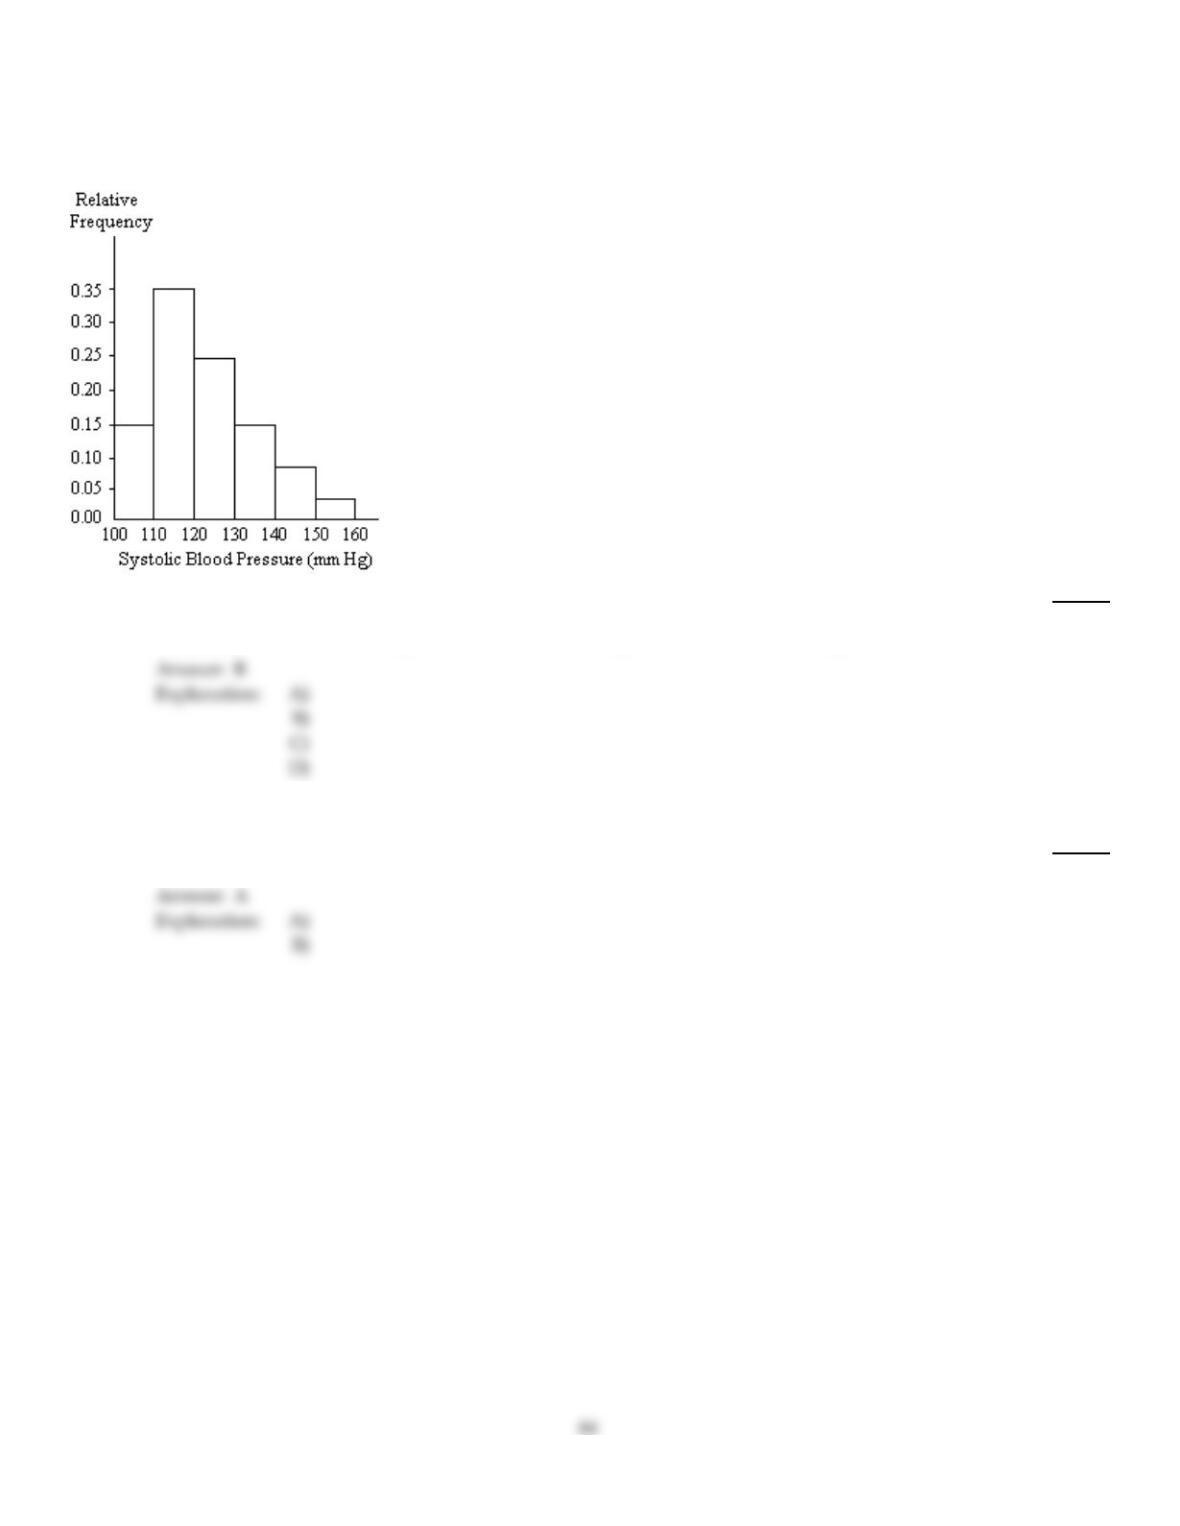
A nurse measured the blood pressure of each person who visited her clinic. Following is a relative–frequency histogram
for the systolic blood pressure readings for those people aged between 25 and 40. Use the histogram to answer the
question. The blood pressure readings were given to the nearest whole number.
129)
Approximately what percentage of the people aged 25–40 had a systolic blood pressure reading
less than 120?
129)
A)
3.5%
B)
50%
C)
35%
D)
5%
Tell whether the statement is true or false.
130)
A discrete variable always yields numerical values.
130)
A)
True
B)
False
Identify the variable.
131)
The following table shows the average weight of offensive linemen for each given football team.
Team Average weight (pounds)
Gators 303.52
Lakers 326.78
Eagles 290.61
Pioneers 321.96
Lions 297.35
Mustangs 302.49
Rams 345.88
Buffalos 329.24
Identify the variable under consideration in the first column?
131)
A)
Gators
B)
pounds
C)
average weight of offensive linemen
D)
team name
A graphical display of a data set is given. Identify the overall shape of the distribution as (roughly) bell–shaped,
triangular, uniform, reverse J–shaped, J–shaped, right skewed, left skewed, bimodal, or multimodal.
132)
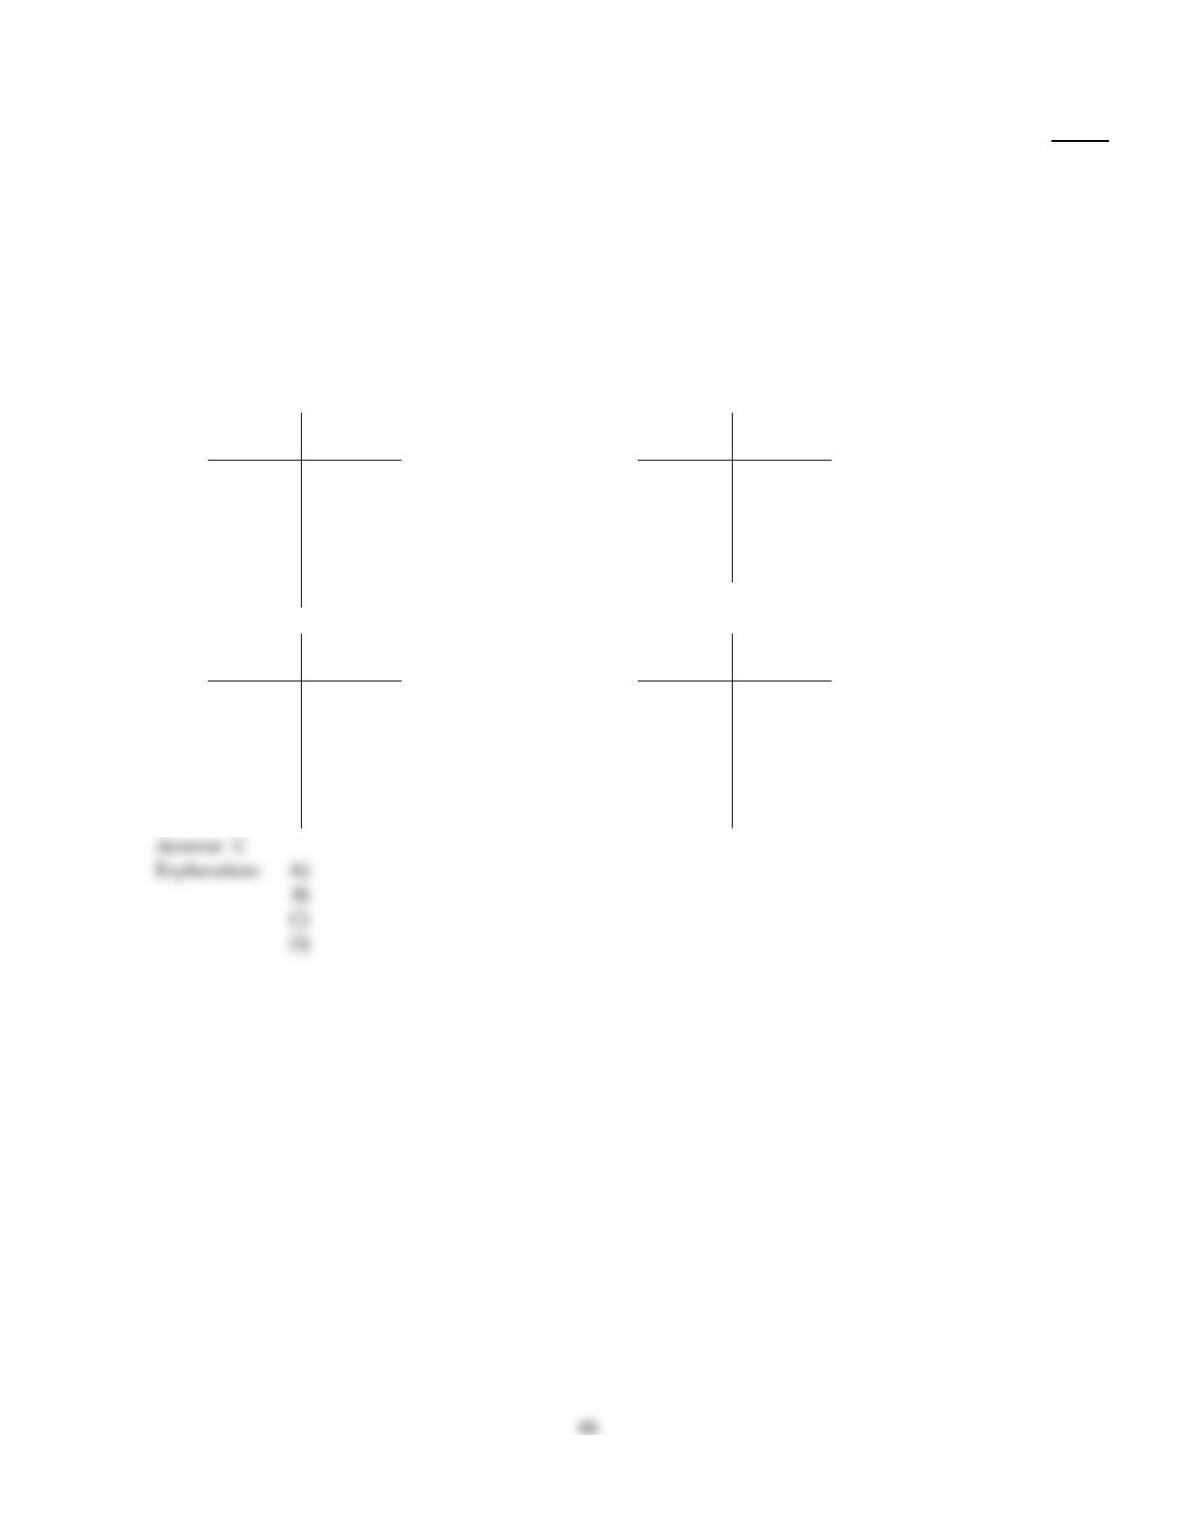
The dotplot shows heights of wrestlers.
132)
A)
Left skewed
B)
J–shaped
C)
Reverse J–shaped
D)
Right skewed
D
D
Use single–value grouping to organize these data into a frequency distribution.
133)
A car insurance company conducted a survey to find out how many car accidents people had been
involved in. They selected a sample of 32 adults between the ages of 30 and 70 and asked each
person how many accidents they had been involved in the past ten years. The following data were
obtained.
0 1 0 3 2 1 0 2
1 1 1 0 2 0 4 1
2 0 0 1 0 2 1 3
1 3 0 0 1 0 5 4
Construct a frequency distribution for the number of car accidents.
133)
A)
Number of
accidents Frequency
012
1 9
2 5
3 3
4 2
5 1
B)
Number of
accidents Frequency
110
2 5
3 3
4 2
5 1
C)
Number of
accidents Frequency
011
110
2 5
3 3
4 2
5 1
D)
Number of
accidents Frequency
011
110
2 5
3 3
4 1
5 1
Complete the contingency table and use it to solve the problem.
134)
The partially filled contingency table gives the frequencies of the data on age (in years) and sex
from the residents of a retirement home.
Age (yrs)
60–69 70–79 Over 79 Total
Male 19 7 5
Female 1 4 4
Total
What is the relative frequency for males ?
134)
A)
31
40
B)
27
40
C)
31
20
D)
29
40
Construct a stem–and–leaf diagram for the given data.
135)
The diastolic blood pressures for a sample of patients at a clinic were as follows. The measurements
are in mmHg.
78 87 91 85 97 102 73 90 102 105
94 85 81 95 77 106 84 101 83 92
79 81 96 88 100 85 89 87 83 90
88 95 78 74 108 85 87 92 97 83
Construct a stem–and–leaf diagram using two lines per stem.
135)
A)
7
7
8
8
9
9
10
10
3 4
8 7 9 8
1 4 3 1 3 3
7 5 5 8 5 9 7 8 5 7
1 0 4 2 0 2
7 5 6 5 7
2 2 1 0
5 6 8
B)
7
7
8
8
9
9
10
10
8 3 7
9 8 4
7 5 5 1 4 3 1 8
5 9 7 3 8 5 7 3
1 7 0 4 5 2
6 0 5 2 7
2 2 5 6
1 0 8
A graphical display of a data set is given. Identify the overall shape of the distribution as (roughly) bell–shaped,
triangular, uniform, reverse J–shaped, J–shaped, right skewed, left skewed, bimodal, or multimodal.
136)
A stem–and–leaf diagram is given below for the number of vacation days taken in 2006 by the
employees of an electronics company.
0
1
2
3
4
4 0 1 3 6 3 5 8 4 3 6 8 0 0 2
1 4 2 5 1 4 0 3 0 1 0
0 2 0 3 4
0 1
3
136)
A)
Reverse J–shaped
B)
J–shaped
C)
Right skewed
D)
Left skewed
Tell whether the statement is true or false.
137)
The set of possible values that a variable can take constitutes the data.
137)
A)
True
B)
False
B
A
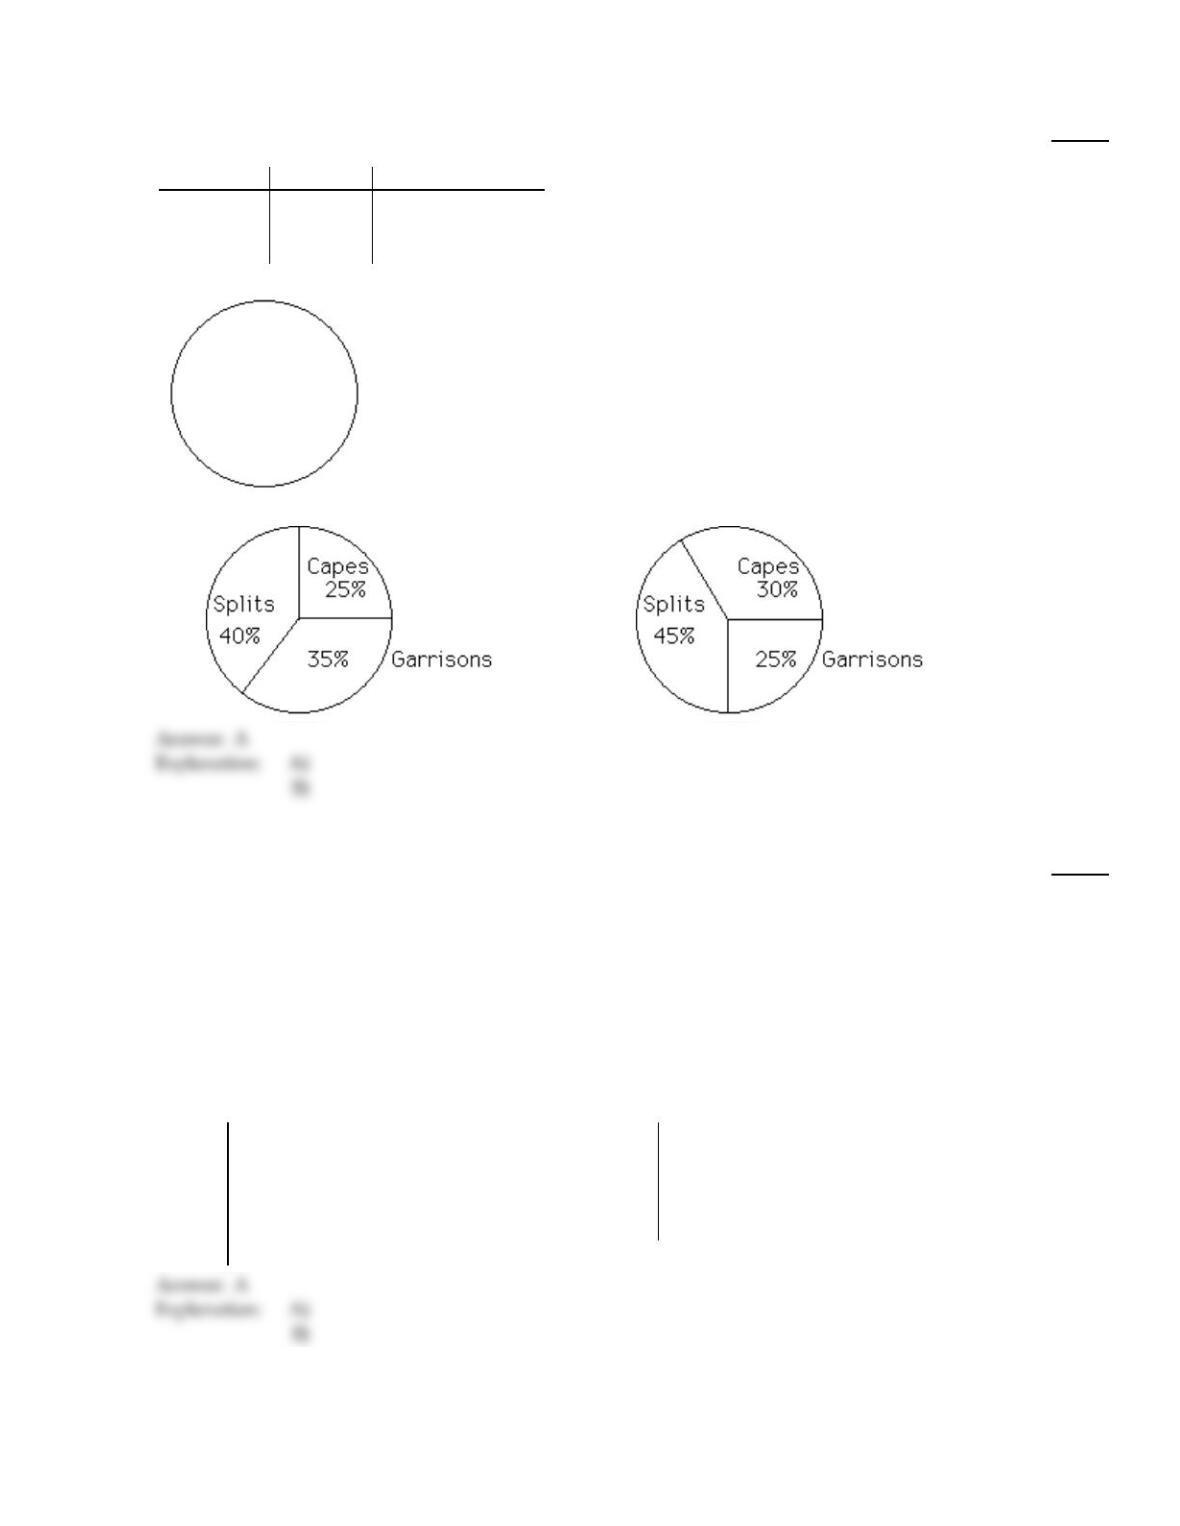
Construct a pie chart representing the given data set.
138)
The following data give the distribution of the types of houses in a town containing 20,000 houses.
House Type Frequency Relative Frequency
Cape 5000 0.25
Garrison 8000 0.35
Split 7000 0.40
138)
A)
B)
Construct a stem–and–leaf diagram for the given data.
139)
The maximum recorded temperatures (in degrees Fahrenheit) for 35 different U.S. cities are given
below.
108 125 119 109 112 104 118
110 115 113 108 116 105 113
120 111 114 106 112 119 107
110 112 104 121 106 108 123
105 117 124 115 110 114 113
Construct a stem–and–leaf diagram using two lines per stem.
139)
A)
10
10
11
11
12
12
4 4
8 9 8 5 6 7 6 8 5
2 0 3 3 1 4 2 0 2 0 4 3
9 8 5 6 9 7 5
0 1 3 4
5
B)
10
10
11
11
12
4 4 5 5
8 9 8 6 7 6 8
2 0 3 3 1 4 2 0 2 0 4 3 5
9 8 6 9 7
0 1 3 4 5
Use single–value grouping to organize these data into a frequency distribution.
69
140)
The following data represent the total number of years of formal education for 40 employees of a
bank.
13 17 13 14 12 17 19 13 15 13
16 18 13 11 19 19 12 14 13 13
14 15 13 15 17 18 17 14 13 17
12 17 17 16 16 17 15 13 13 14
Construct a frequency distribution for the number of years of education.
140)
A)
Number of
years of
education Frequency
11 1
12 3
13 12
14 5
15 4
16 3
17 8
18 2
19 2
B)
Number of
years of
education Frequency
11 1
12 3
13 11
14 6
15 4
16 3
17 7
18 2
19 3
C)
Number of
years of
education Frequency
11 1
12 3
13 11
14 5
15 4
16 3
17 8
18 2
19 3
D)
Number of
years of
education Frequency
12 3
13 11
14 5
15 4
16 3
17 8
18 2
19 3
Classify the data as either discrete or continuous.
141)
The total number of phone calls a sales representative makes in a month is 425.
141)
A)
Discrete
B)
Continuous
Use single–value grouping to organize these data into a frequency distribution.
142)
A teacher asked each of her students how many novels they had read in the previous six months.
The results are shown below.
0 1 5 4 2 1 3 2
2 7 2 5 0 1 0 1
1 2 6 0 2 3 1 2
7 1 4 2 3 1 7 0
0 2 1 1 0 6 1 7
Construct a frequency distribution for the number of novels read.
142)
A)
Number of
novels Frequency
111
2 9
3 3
4 2
5 2
6 2
7 4
B)
Number of
novels Frequency
0 7
110
2 9
3 3
4 2
5 2
6 2
7 3
C)
Number of
novels Frequency
0 7
111
2 9
3–5 7
6–8 6
D)
Number of
novels Frequency
0 7
111
2 9
3 3
4 2
5 2
6 2
7 4
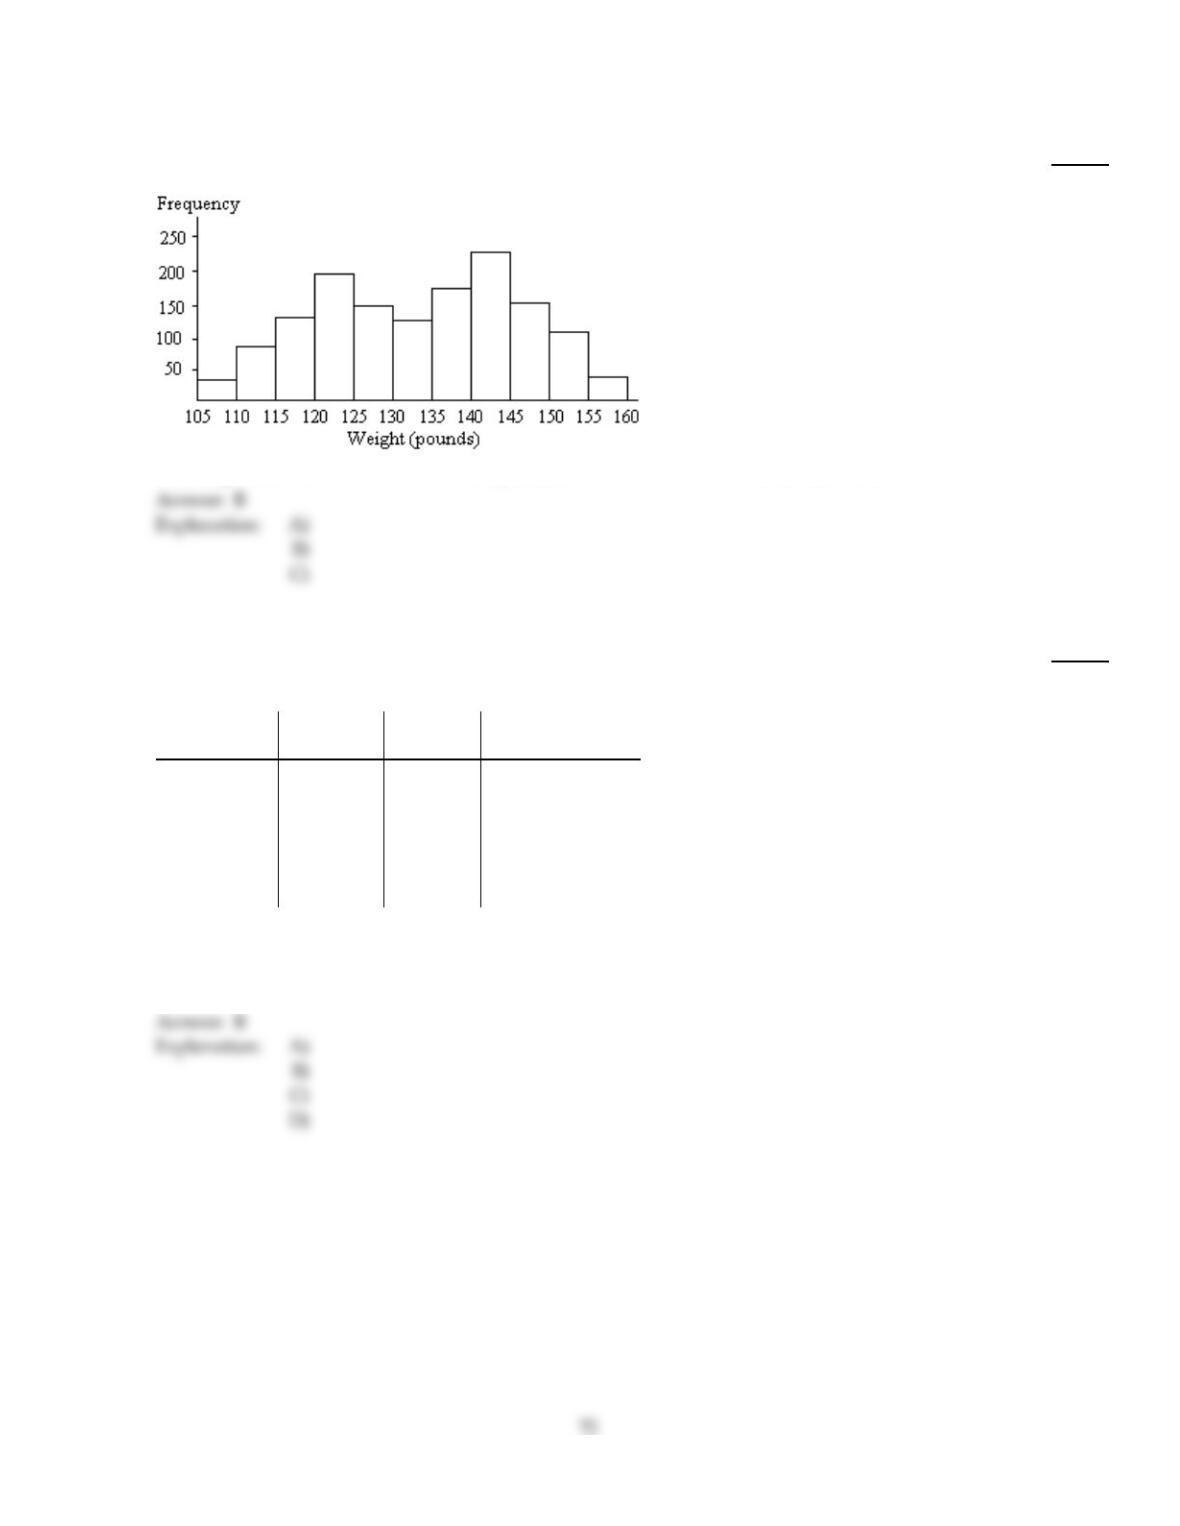
A graphical display of a data set is given. State whether the distribution is (roughly) symmetric, right skewed, or left
skewed.
143)
A frequency histogram is given below for the weights of a sample of college students.
143)
A)
Right skewed
B)
Symmetric
C)
Left skewed
Provide the requested response.
144)
The table contains data from a study of daily study time for 40 students from Statistics 101. In
constructing an ogive from the data, what quantity should be assigned to each axis.
Minutes on
homework Number of
students Relative
frequency Cumulative
relative frequency
0–under 15 20.05 0.05
15–under 30 40.10 0.15
30–under 45 80.20 0.35
45–under 60 18 0.45 0.80
60–under 75 40.10 0.90
75–under 90 40.10 1.00
144)
A)
Number of students on the x–axis and cumulative relative frequency on the y–axis
B)
Minutes on homework on the x–axis and cumulative relative frequency on the y–axis
C)
There is not enough data to decide.
D)
Minutes on homework on the x–axis and relative frequency on the y–axis
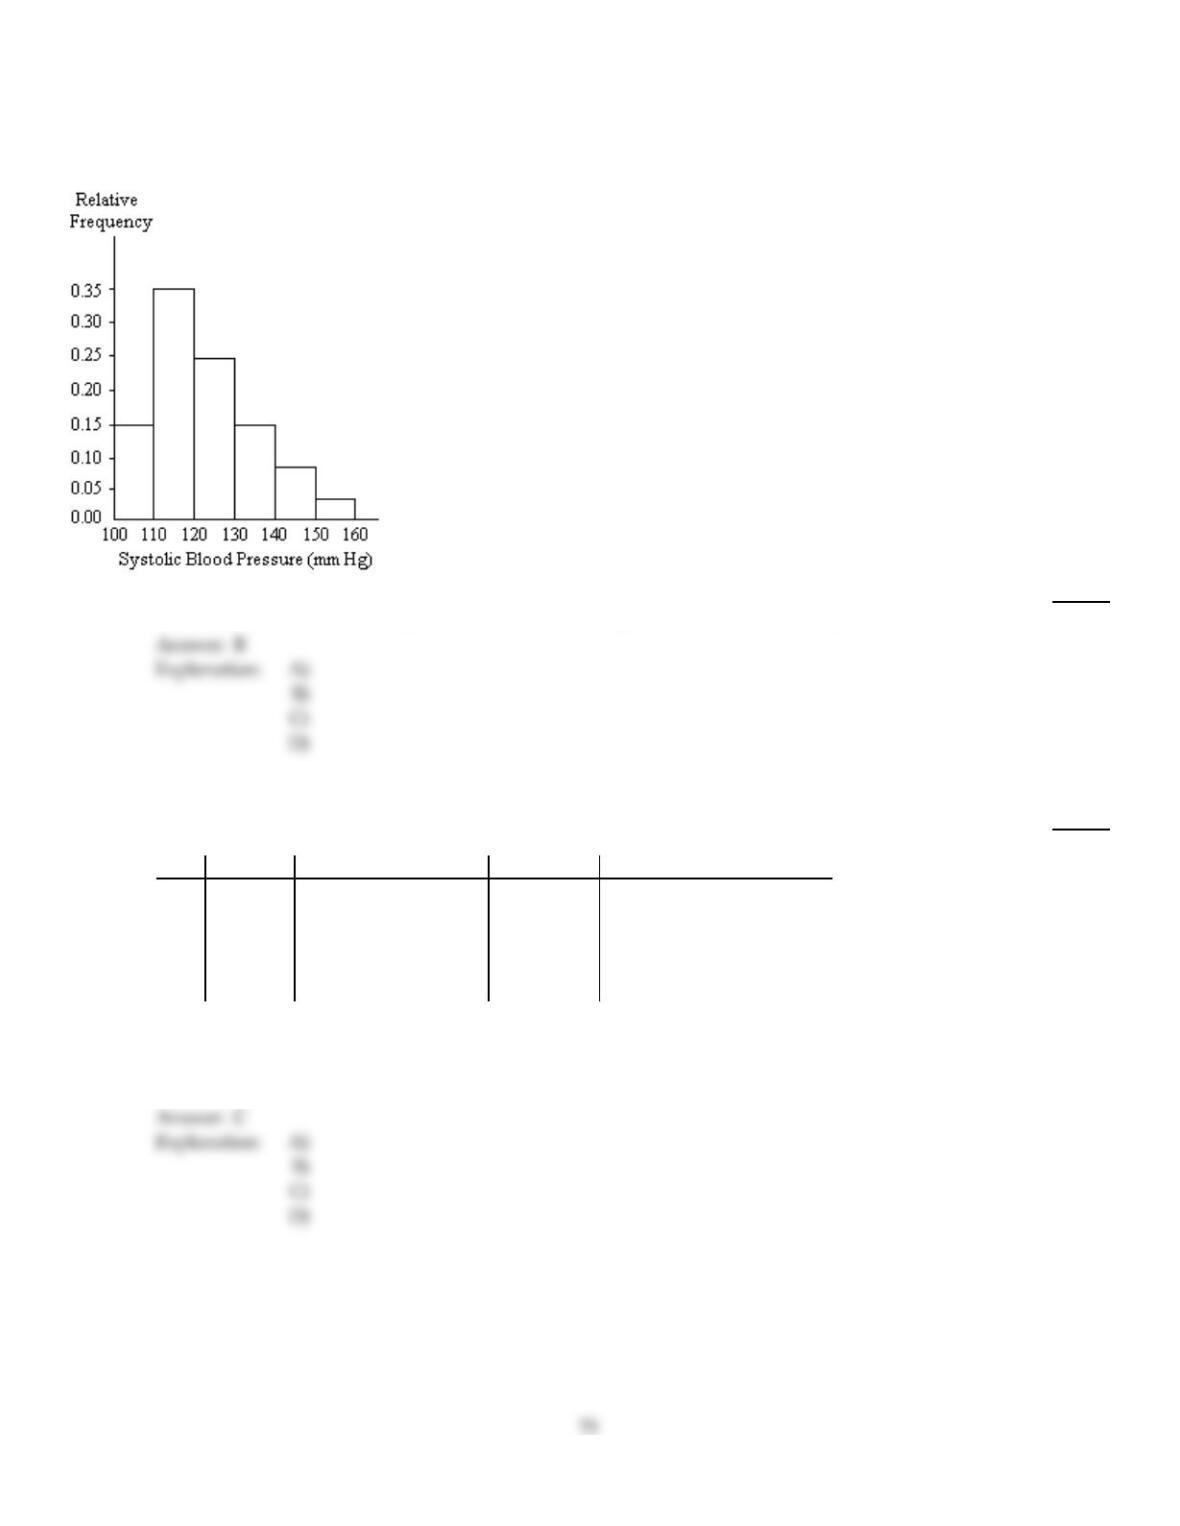
A nurse measured the blood pressure of each person who visited her clinic. Following is a relative–frequency histogram
for the systolic blood pressure readings for those people aged between 25 and 40. Use the histogram to answer the
question. The blood pressure readings were given to the nearest whole number.
145)
Identify the midpoint of the third class.
145)
A)
124
B)
125
C)
120
D)
130
Identify the variable.
146)
The following table gives the top five movies at the box office this week.
Rank Last week Movie title Studio Box office sales ($ millions)
1N/A Pirate Adventure Movie Giant 35.2
2 2 Secret Agent Files G.M.G. 19.5
3 1 Epic Super Hero Team 21st Century 14.3
4 5 Reptile Ride Movie Giant 10.1
5 4 Must Love Cats Dreamboat 9.9
Identify the variable under consideration in the third column?
146)
A)
rank
B)
Epic Super Hero Team
C)
movie title
D)
studio name
Explanation:
Explanation:
A graphical display of a data set is given. State whether the distribution is (roughly) symmetric, right skewed, or left
skewed.
147)
A stem–and–leaf diagram is given below for the ages of the patients at a hospital.
0
1
2
3
4
5
6
7
8
9
4 0
1 4 2
0 2 0 3
0 1 5 8 2 9
3 4 5 1 7 1 8 2
3 6 2 6 8 9 3 3 0 6 3 6 3
6 2 8 1 8 3 3 6 2 6 9 0 5 0 3 6 7 5
2 5 3 7 8 9 5 3 6 7 8 4 8 9 3 6 7 8 5 5
4 6 0 8 5 3 2 6 2 7 8 9 0
1 4 6 7 3
147)
A)
Right skewed
B)
Left skewed
C)
Symmetric
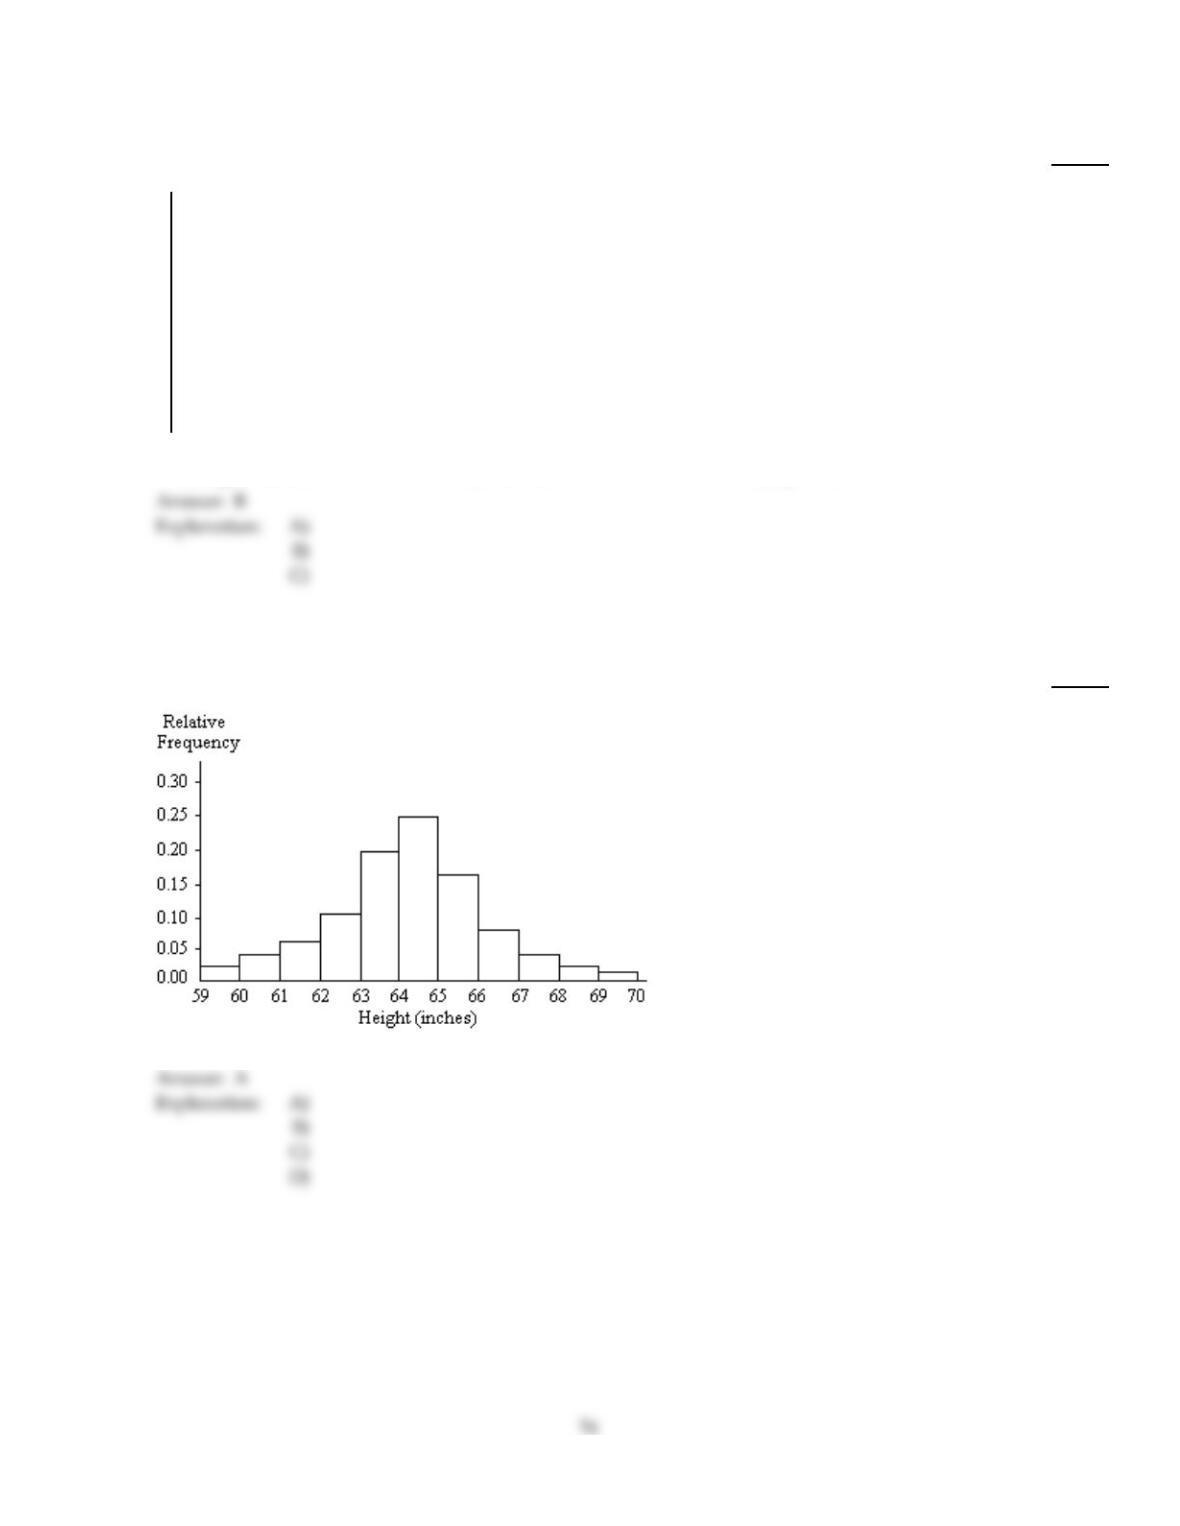
A graphical display of a data set is given. Identify the overall shape of the distribution as (roughly) bell–shaped,
triangular, uniform, reverse J–shaped, J–shaped, right skewed, left skewed, bimodal, or multimodal.
148)
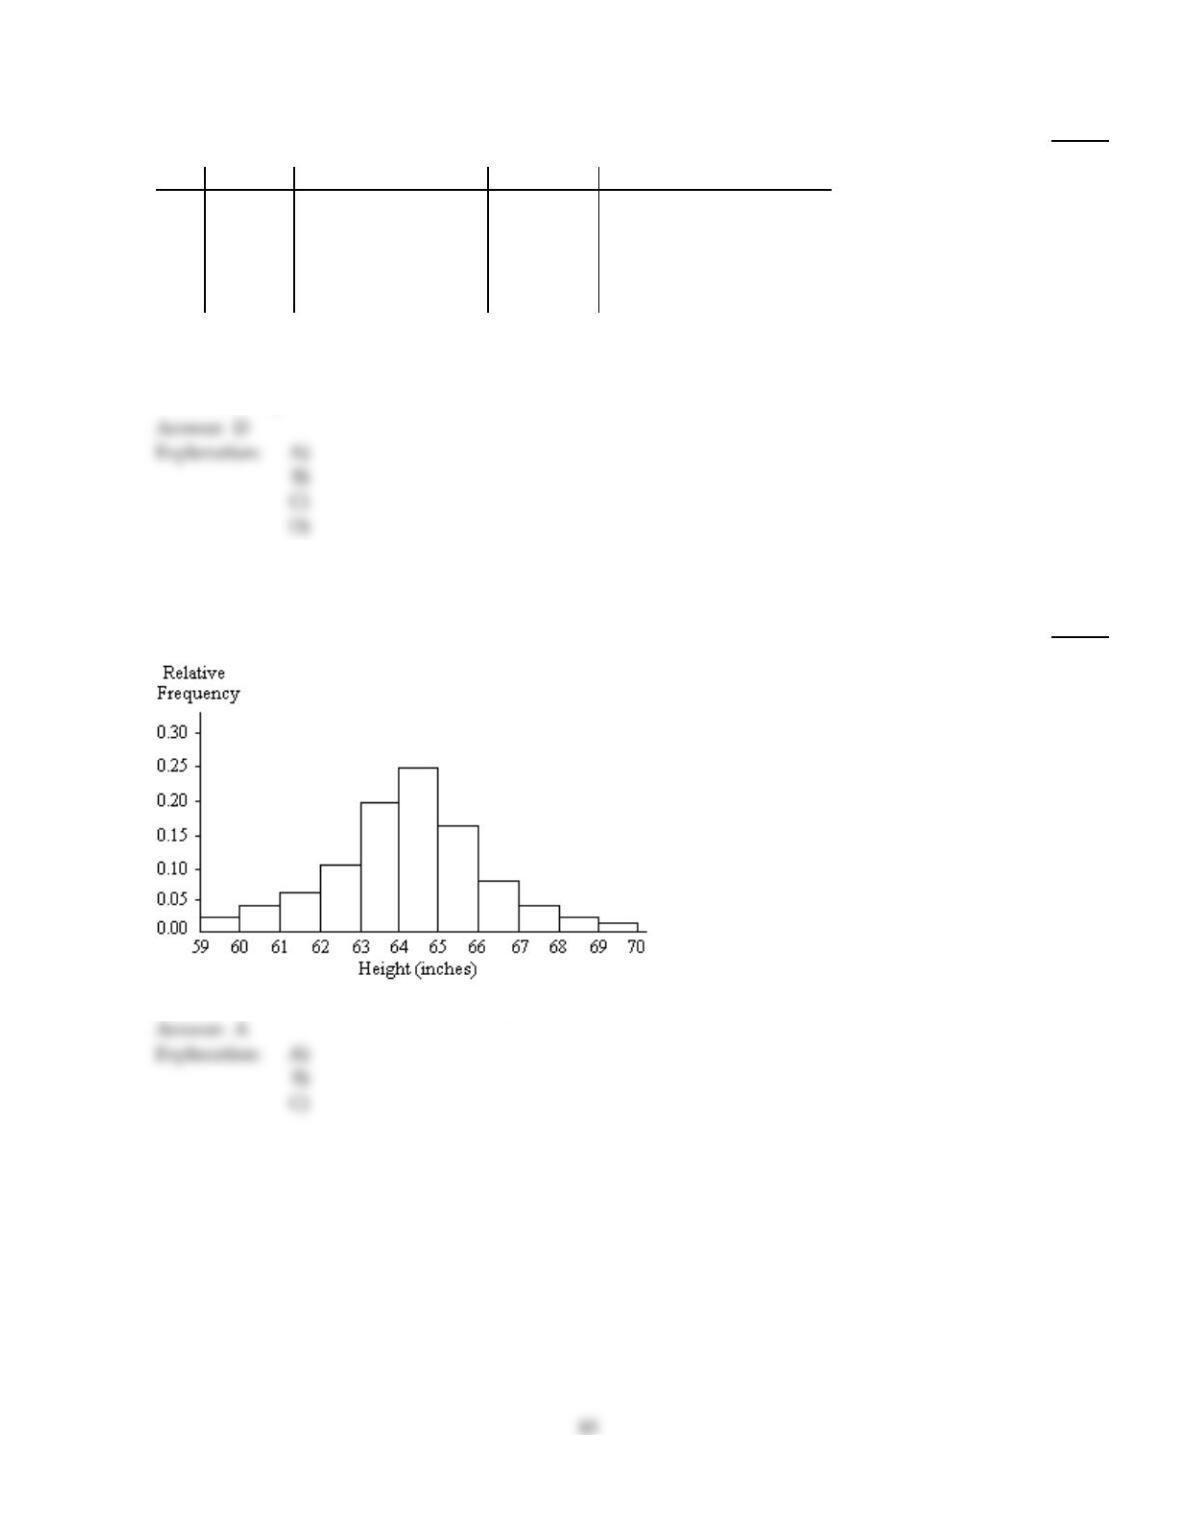
A relative frequency histogram for the heights of a sample of adult women is shown below.
148)
A)
Bell–shaped
B)
Left skewed
C)
Triangular
D)
J–shaped
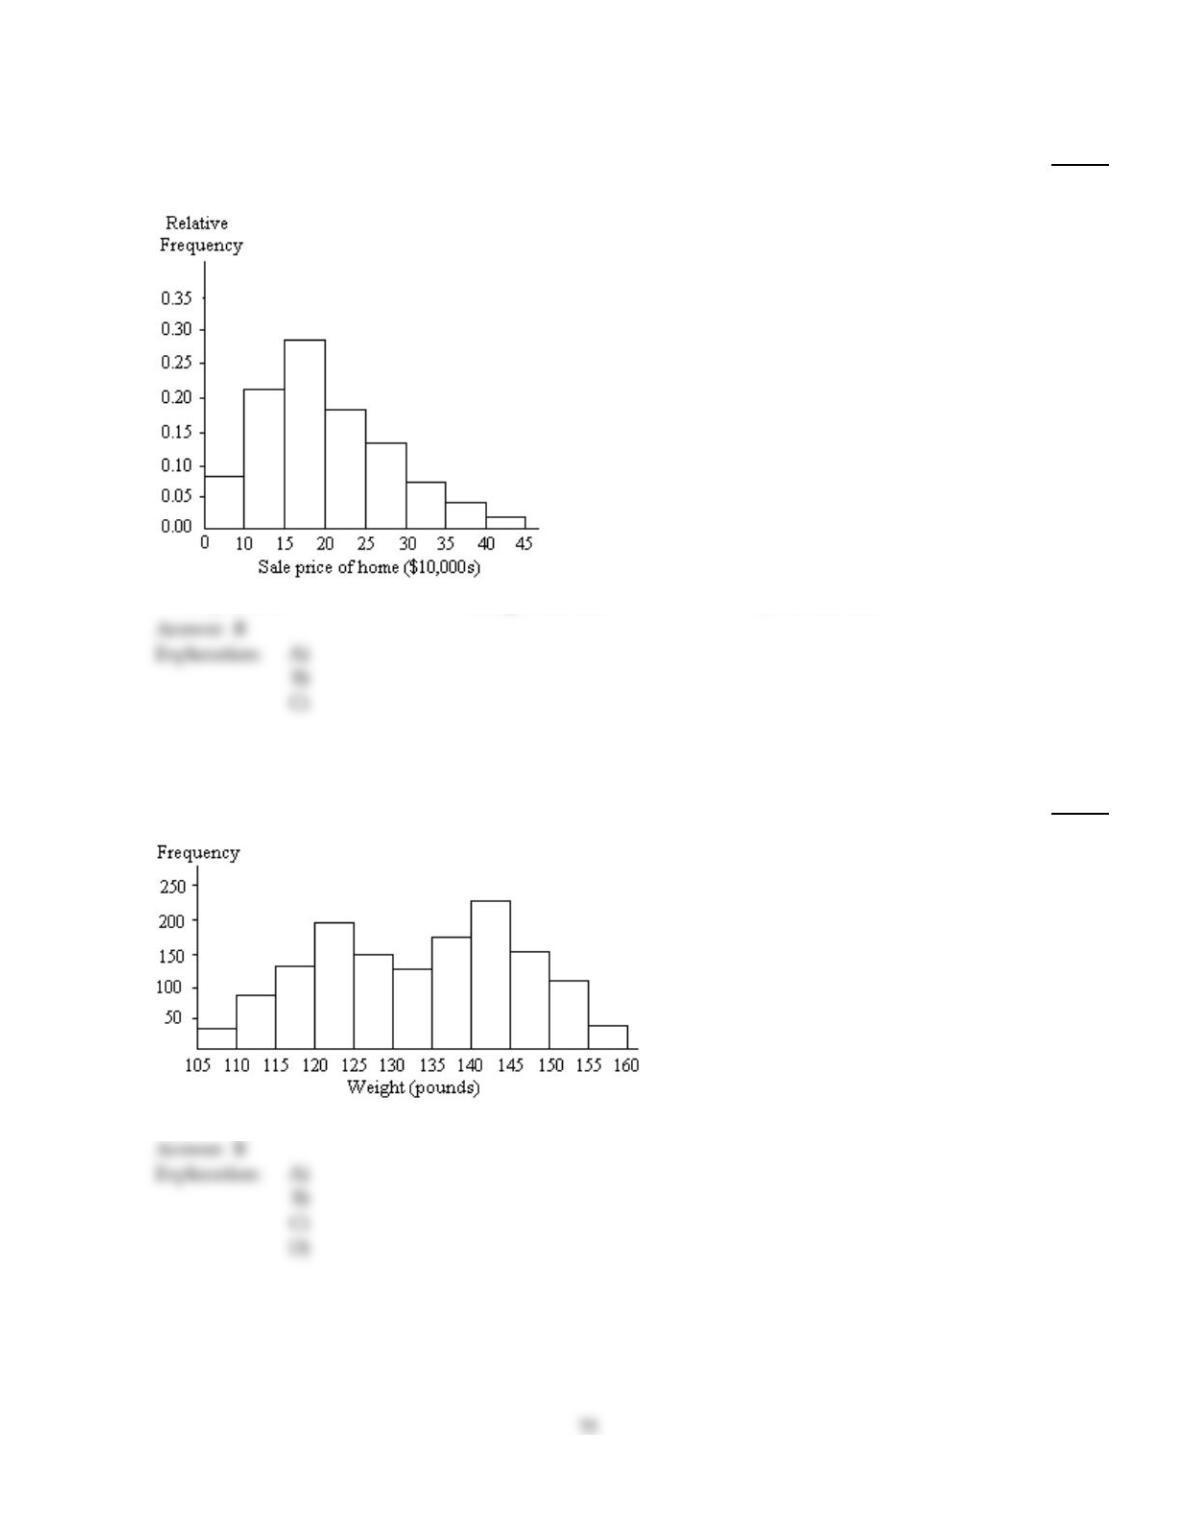
A graphical display of a data set is given. State whether the distribution is (roughly) symmetric, right skewed, or left
skewed.
149)
A relative frequency histogram for the sale prices of homes sold in one city during 2006 is shown
below.
149)
A)
Symmetric
B)
Right skewed
C)
Left skewed
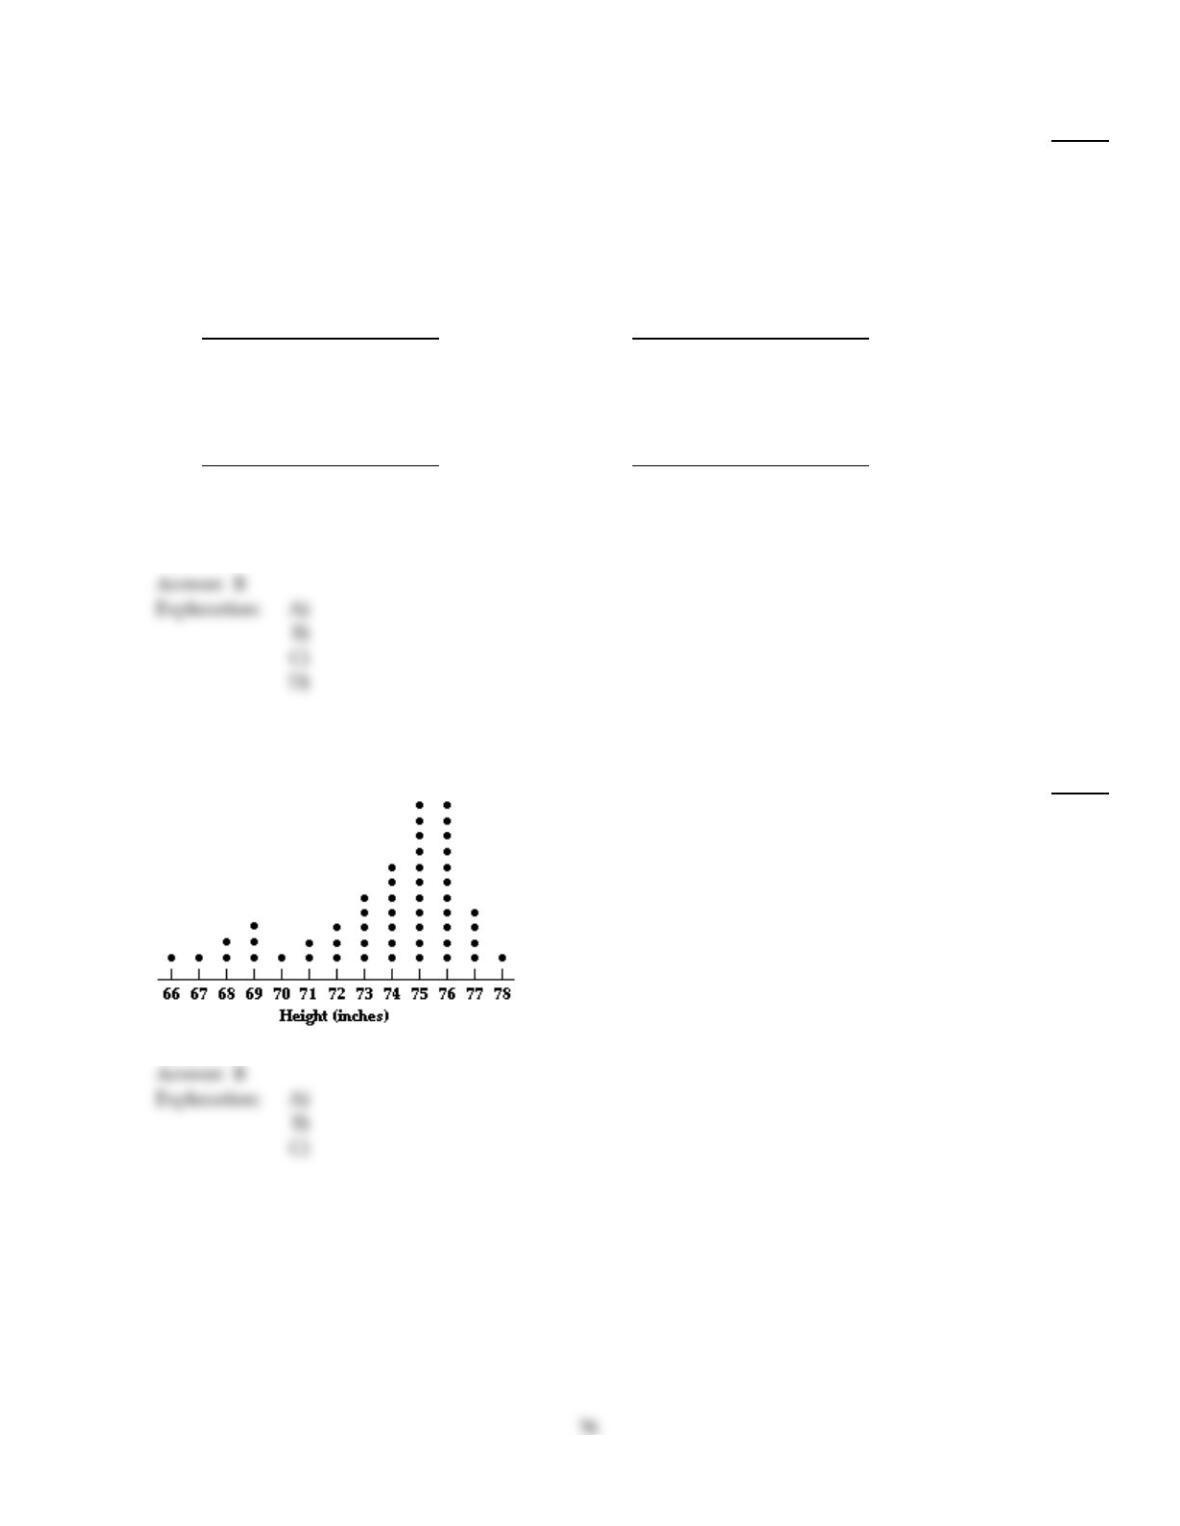
A graphical display of a data set is given. Identify the overall shape of the distribution as (roughly) bell–shaped,
triangular, uniform, reverse J–shaped, J–shaped, right skewed, left skewed, bimodal, or multimodal.
150)
A frequency histogram is given below for the weights of a sample of college students.
150)
A)
Bell–shaped
B)
Bimodal
C)
Uniform
D)
Multimodal
Construct a frequency distribution for the given qualitative data.
151)
The blood types for 40 people who agreed to participate in a medical study were as follows.
O A A O O AB O B A O
A O A B O O O AB A A
A B O A A O O B O O
O A O O A B O O A AB
Construct a frequency distribution for the data.
151)
A)
Blood type Frequency
O20
A13
B 4
AB 3
B)
Blood type Frequency
O19
A13
B 5
AB 3
C)
Blood type Frequency
O19
A11
B 5
AB 2
D)
Blood type Frequency
O18
A14
B 5
AB 3
A graphical display of a data set is given. State whether the distribution is (roughly) symmetric, right skewed, or left
skewed.
152)
The dotplot shows heights of football players.
152)
A)
Right skewed
B)
Left skewed
C)
Symmetric
153)
A stem–and–leaf diagram is given below for the number of vacation days taken in 2006 by the
employees of an electronics company.
0
1
2
3
4
4 0 1 3 6 3 5 8 4 3 6 8 0 0 2
1 4 2 5 1 4 0 3 0 1 0
0 2 0 3 4
0 1
3
153)
A)
Symmetric
B)
Right skewed
C)
Left skewed
Classify the data as either qualitative or quantitative.
154)
The following table gives the top five movies at the box office this week.
Rank Last week Movie title Studio Box office sales ($ millions)
1N/A Pirate Adventure Movie Giant 35.2
2 2 Secret Agent Files G.M.G. 19.5
3 1 Epic Super Hero Team 21st Century 14.3
4 5 Reptile Ride Movie Giant 10.1
5 4 Must Love Cats Dreamboat 9.9
What kind of data is provided by the information in the fourth column?
154)
A)
Qualitative
B)
Quantitative
Complete the contingency table and use it to solve the problem.
155)
The partially filled contingency table gives the frequencies of the data on age (in years) and sex
from the residents of a retirement home.
Age (yrs)
60–69 70–79 Over 79 Total
Male 14 9 5
Female 6 2 4
Total
What percentage of residents are female ?
155)
A)
30.4%
B)
29.5%
C)
30%
D)
31%
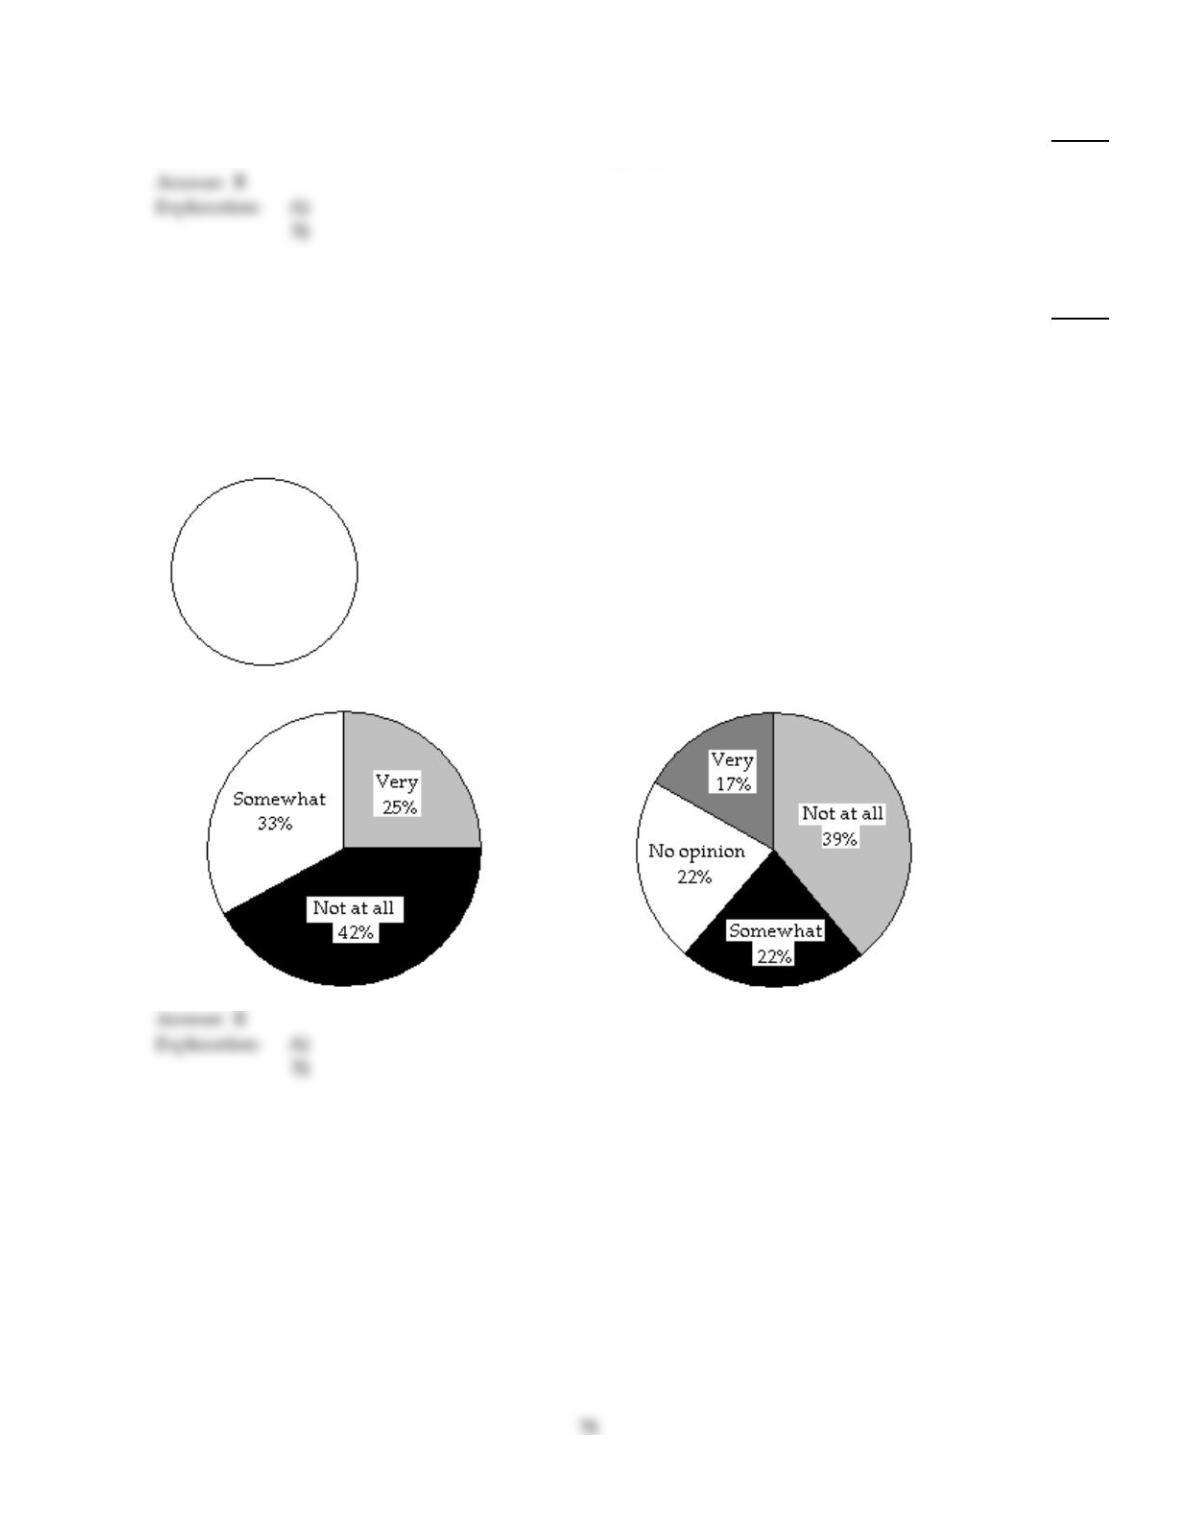
Tell whether the statement is true or false.
156)
The possible values of a discrete variable always form a finite set.
156)
A)
True
B)
False
Construct a pie chart representing the given data set.
157)
The data below represent the results of a poll in which the the following question was asked: “To
what degree are you satisfied with the outcome of the 2006 mayoral election?”
Very 17%
Somewhat 22%
Not at All 39%
No opinion 22%
157)
A)
B)
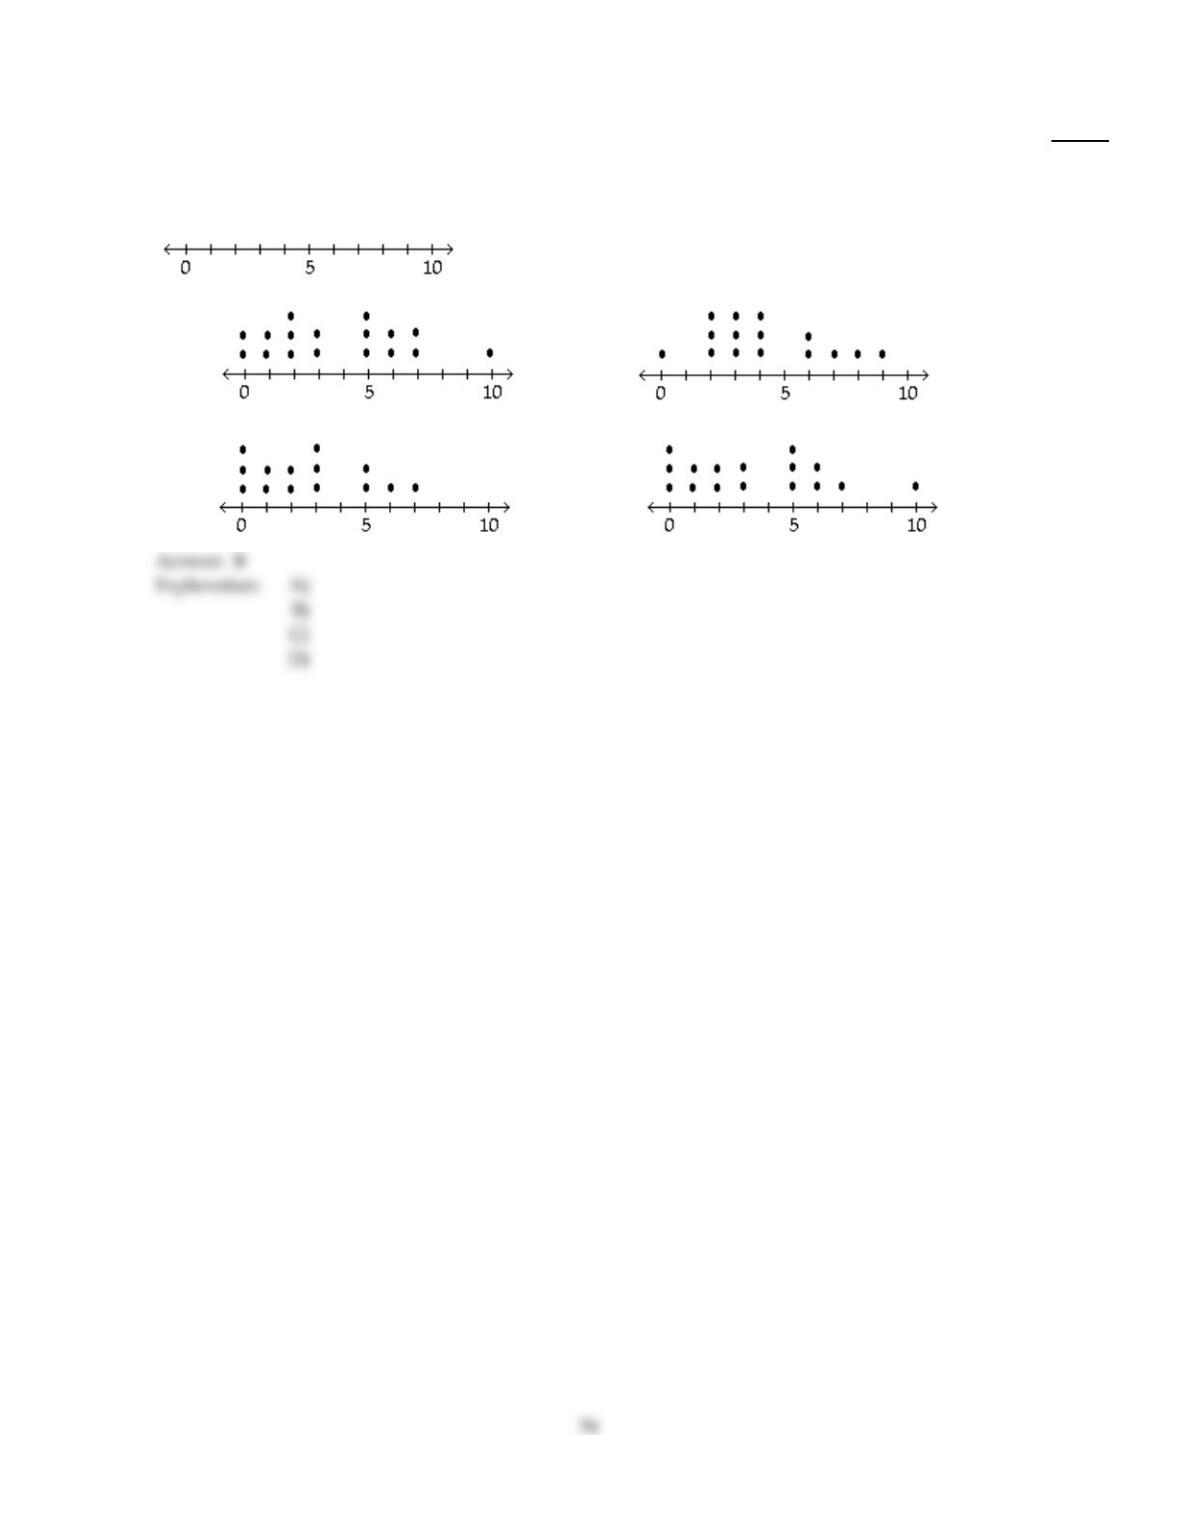
Construct a dotplot for the given data.
158)
Attendance records at a school show the number of days each student was absent during the year.
The days absent for each student were as follows.
9 3 4 2 8 6 3 4 0 6 7 3 4 2 2
158)
A)
B)
C)
D)
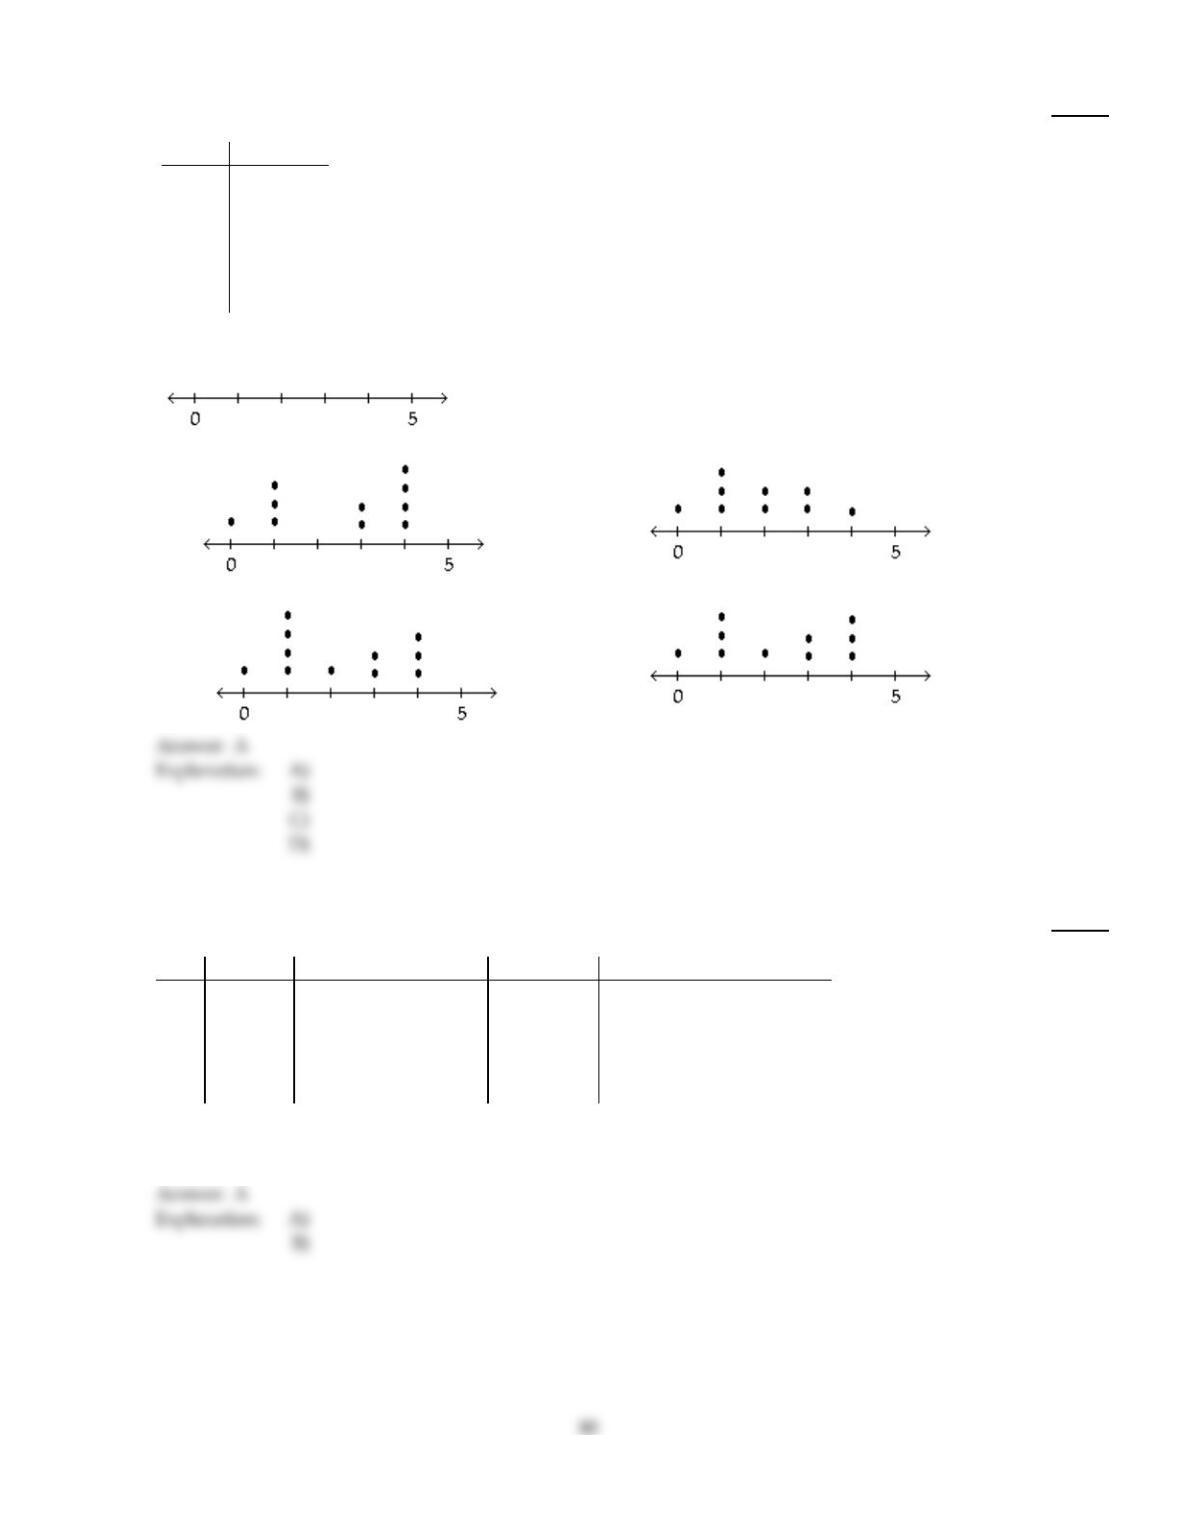
159)
The frequency chart shows the distribution of defects for the machines used to produce a product.
Defects Frequency
0 1
1 3
2 0
3 2
4 4
5 0
159)
A)
B)
C)
D)
Classify the data as either qualitative or quantitative.
160)
The following table gives the top five movies at the box office this week.
Rank Last week Movie title Studio Box office sales ($ millions)
1N/A Pirate Adventure Movie Giant 35.2
2 2 Secret Agent Files G.M.G. 19.5
3 1 Epic Super Hero Team 21st Century 14.3
4 5 Reptile Ride Movie Giant 10.1
5 4 Must Love Cats Dreamboat 9.9
What kind of data is provided by the information in the third column?
160)
A)
Qualitative
B)
Quantitative
Construct a stem–and–leaf diagram for the given data.
161)
The midterm test scores for the seventh–period typing class are listed below.
85 77 93 91 74 65 68 97
88 59 74 83 85 72 63 79
161)
A)
5
6
7
8
9
9
5 8 3
7 4 4 2 9
5 8 3 5
3 1 7
B)
5
6
7
8
9
9
3 5 8
3 5 5 8
2 4 4 7 9
1 3 7
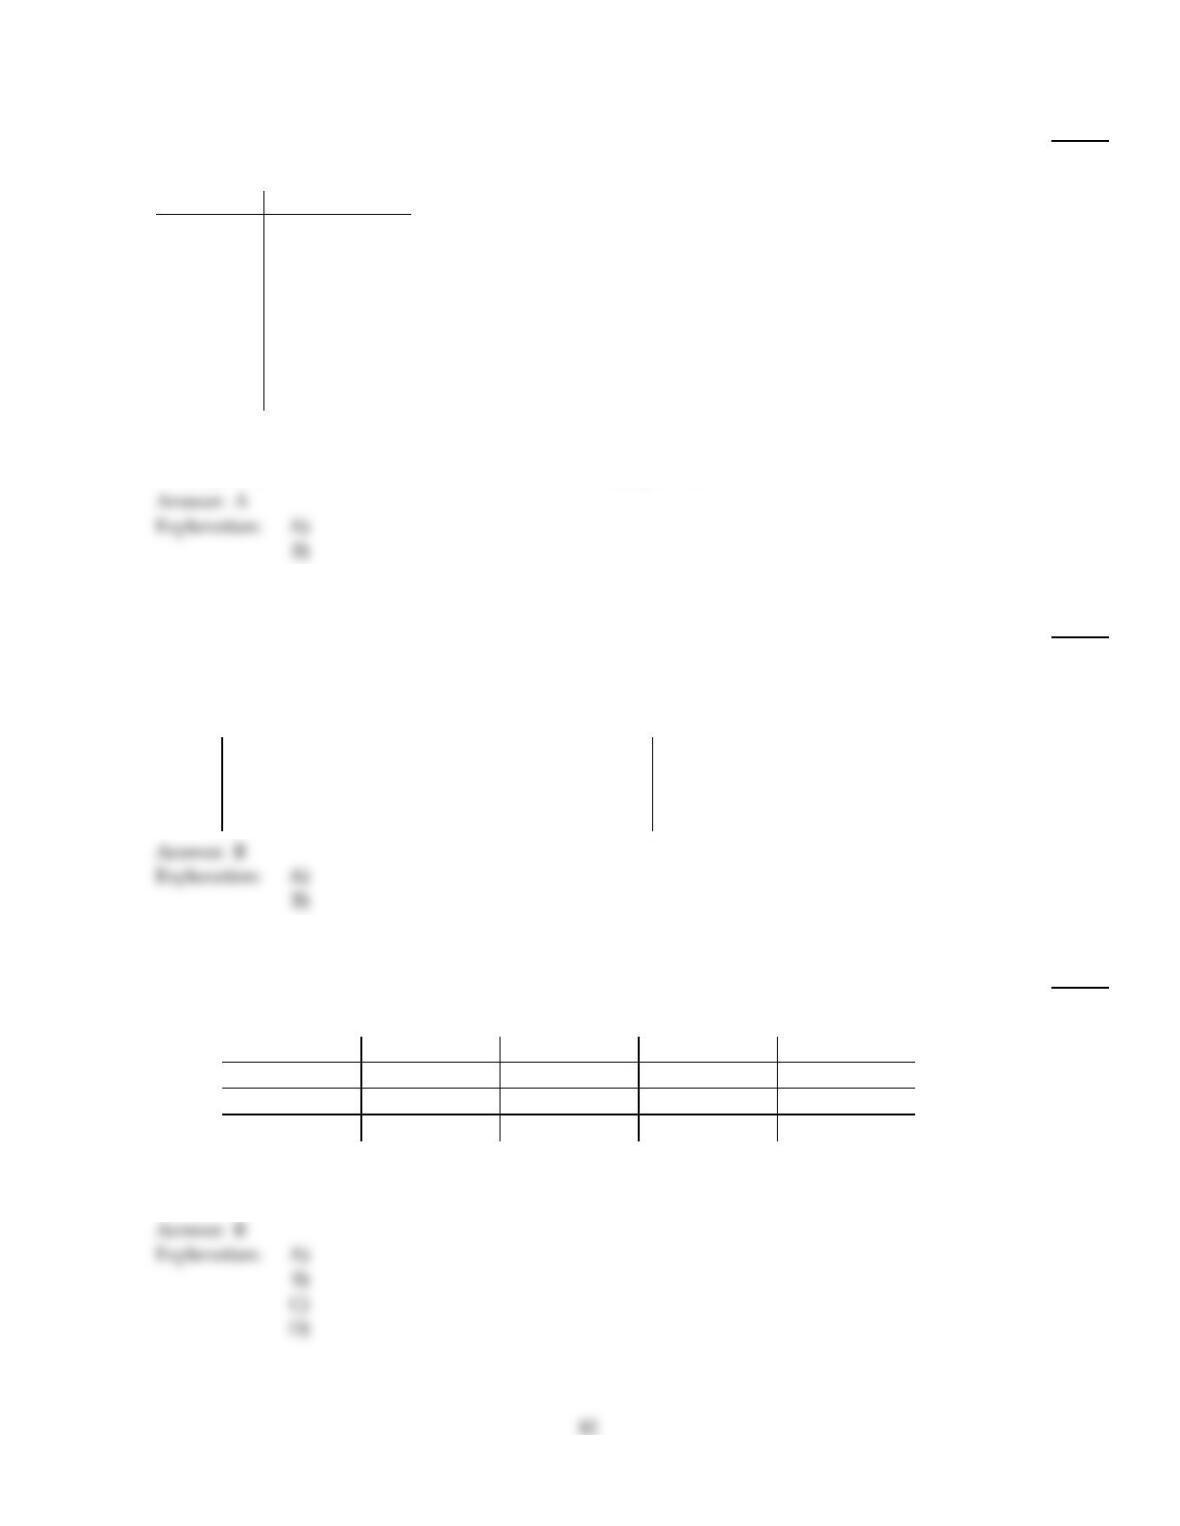
Construct a dotplot for the given data.
162)
A store manager counts the number of customers who make a purchase in his store each day. The
data are as follows.
5 6 3 9 2 5 5 6 3 2
0 5 10
162)
A)
0 5 10
B)
0 5 10
C)
0 5 10
D)
0 5 10
Classify the data as either qualitative or quantitative.
163)
For the year 2006 , a large record company reported the following sales figures for various music
media.
Media Sales ($ millions)
CD 1477.3
CD single 1.8
MP3 65.9
Vinyl 2.6
Music video 531.4
Mini Disc 0.3
DVD 108.2
Cassette 3.4
What kind of data is provided by the information in the first column?
163)
A)
Qualitative
B)
Quantitative
Construct a stem–and–leaf diagram for the given data.
164)
The following data show the number of laps run by each participant in a marathon.
46 65 55 43 51 48
57 30 43 49 32 56
164)
A)
3
4
4
6
0 2
3 6 8 9
1 3 5 6 7
5
B)
3
4
5
6
0 2
6 3 8 3 9
5 1 7 6
5
Complete the contingency table and use it to solve the problem.
165)
The partially filled contingency table gives the relative frequencies of the data on age (in years) and
sex from the residents of a retirement home.
Age (yrs)
60–69 70–79 Over 79 Total
Male 0.22 0.1 0.08
Female 0.2 0.2 0.2
Total 1
What percentage of residents are females in the age group 70–79?
165)
A)
22%
B)
20%
C)
19.5%
D)
18%
Identify the variable.
166)
The following table gives the top five movies at the box office this week.
Rank Last week Movie title Studio Box office sales ($ millions)
1N/A Pirate Adventure Movie Giant 35.2
2 2 Secret Agent Files G.M.G. 19.5
3 1 Epic Super Hero Team 21st Century 14.3
4 5 Reptile Ride Movie Giant 10.1
5 4 Must Love Cats Dreamboat 9.9
Identify the variable under consideration in the second column?
166)
A)
movie title
B)
box office sales
C)
Secret Agent Files
D)
last week’s rank
A graphical display of a data set is given. State whether the distribution is (roughly) symmetric, right skewed, or left
skewed.
167)
A relative frequency histogram for the heights of a sample of adult women is shown below.
167)
A)
Symmetric
B)
Right skewed
C)
Left skewed
Complete the contingency table and use it to solve the problem.
168)
The partially filled contingency table gives the frequencies of the data on age (in years) and sex
from the residents of a retirement home.
Age (yrs)
60–69 70–79 Over 79 Total
Male 19 3 5
Female 1 8 4
Total
What is the relative frequency for males in the age group 60–69?
168)
A)
11
20
B)
19
20
C)
19
40
D)
9
20
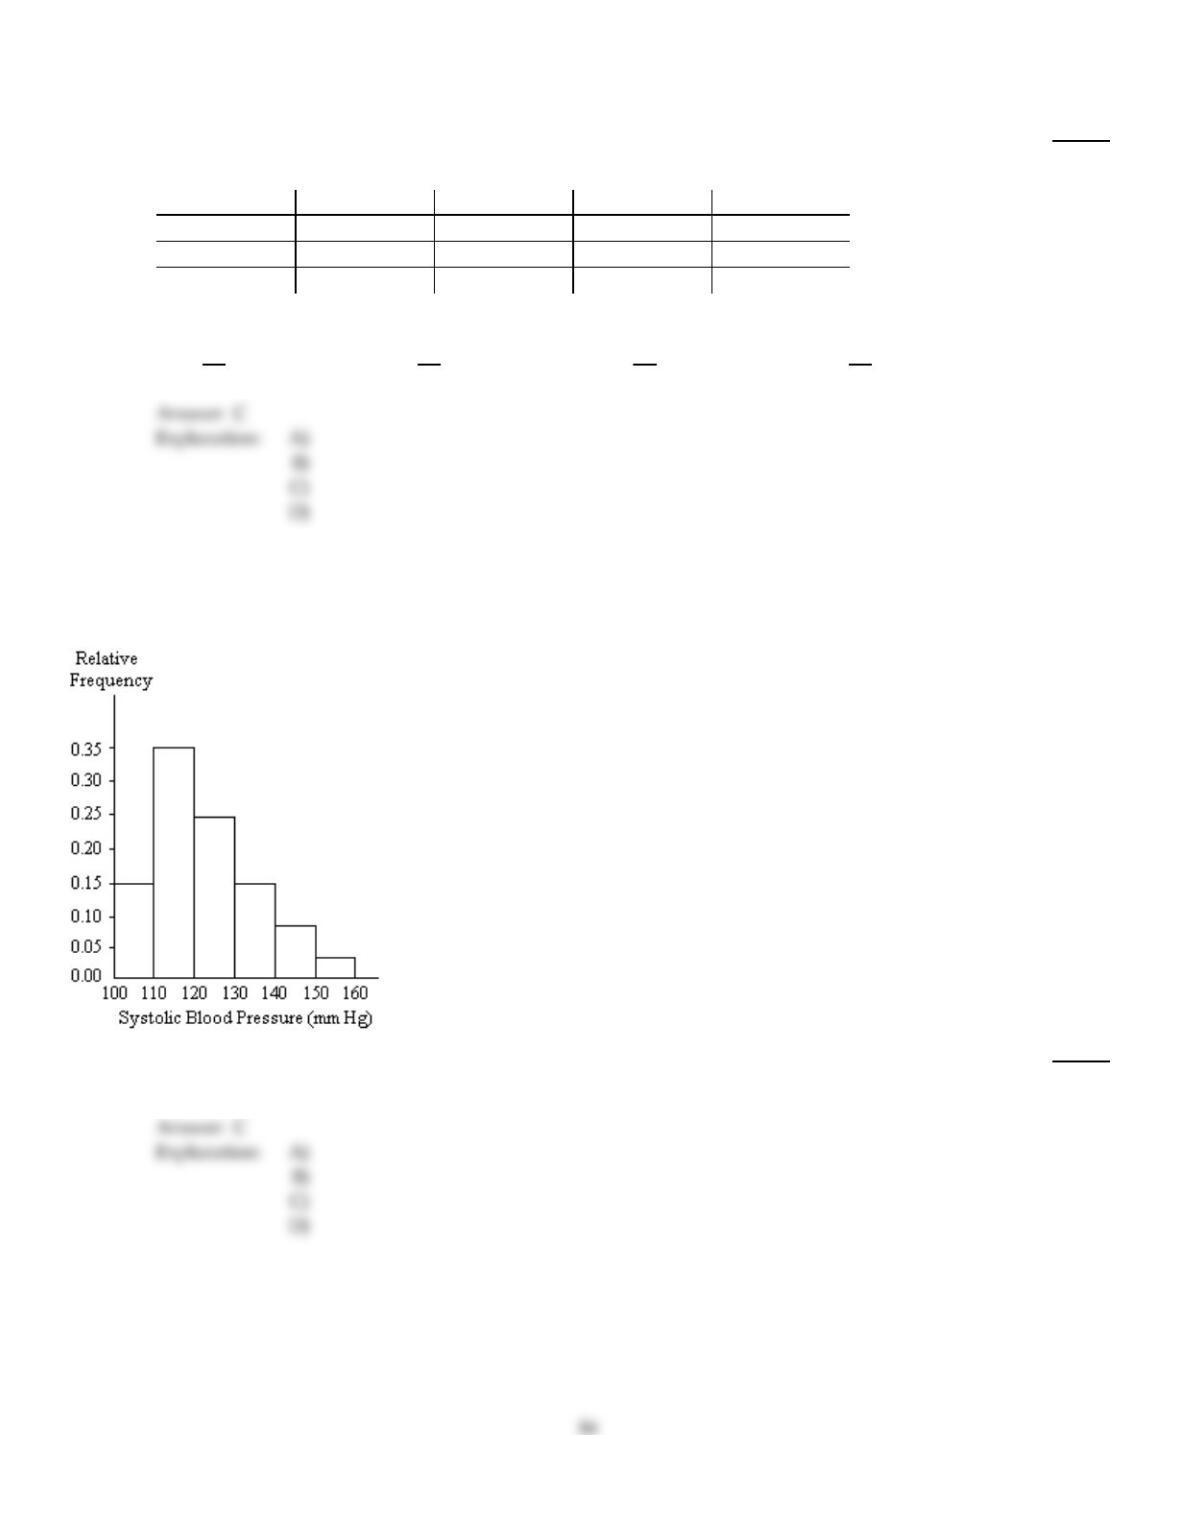
A nurse measured the blood pressure of each person who visited her clinic. Following is a relative–frequency histogram
for the systolic blood pressure readings for those people aged between 25 and 40. Use the histogram to answer the
question. The blood pressure readings were given to the nearest whole number.
169)
Given that 700 people were aged between 25 and 40, approximately how many had a systolic blood
pressure reading less than 130?
169)
A)
74
B)
52
C)
518
D)
168
Provide the requested table entry.
170)
The data in the following table reflect the amount of time 40 students in a section of Statistics 101
spend on homework each day. Determine the value that should be entered in the relative frequency
column for the class 15–29.
Homework time
(minutes) Number of
students Relative
frequency
0–14 2
15–29 4
30–44 10
45–59 16
60–74 6
75–89 2
170)
A)
4
B)
0.1
C)
4%
D)
10%
Classify the data as either discrete or continuous.
171)
The average height of all freshmen entering college in a certain year is 68.4 inches.
171)
A)
Discrete
B)
Continuous
A graphical display of a data set is given. Identify the overall shape of the distribution as (roughly) bell–shaped,
triangular, uniform, reverse J–shaped, J–shaped, right skewed, left skewed, bimodal, or multimodal.
172)
A stem–and–leaf diagram is given below for the annual precipitation in one U.S. city for 28
consecutive years. Precipitation data are in inches.
0
1
2
3
4
5
6
7
9
1 4 2
0 2 0 3
0 1 4 7 2 8 3 2
1 3 4 8 7
1 7 4 8
3 6
1
172)
A)
Bell–shaped
B)
Right skewed
C)
Triangular
D)
Left skewed
A graphical display of a data set is given. State whether the distribution is (roughly) symmetric, right skewed, or left
skewed.
173)
A stem–and–leaf diagram is given below for the annual precipitation in one U.S. city for 28
consecutive years. Precipitation data are in inches.
0
1
2
3
4
5
6
7
9
1 4 2
0 2 0 3
0 1 4 7 2 8 3 2
1 3 4 8 7
1 7 4 8
3 6
1
173)
A)
Right skewed
B)
Symmetric
C)
Left skewed
Answer Key
Testname: C2
Answer Key
Testname: C2
Answer Key
Testname: C2
89
Answer Key
Testname: C2
90
Answer Key
Testname: C2
91
Answer Key
Testname: C2
Answer Key
Testname: C2
93
Answer Key
Testname: C2
94
Answer Key
Testname: C2
Answer Key
Testname: C2
Answer Key
Testname: C2