92)
An example of a factor of production is
92)
A)
the automobiles exported by an auto manufacturer.
B)
a loan granted to an auto manufacturer.
C)
a worker hired by an auto manufacturer.
D)
a car produced by an auto manufacturer.
93)
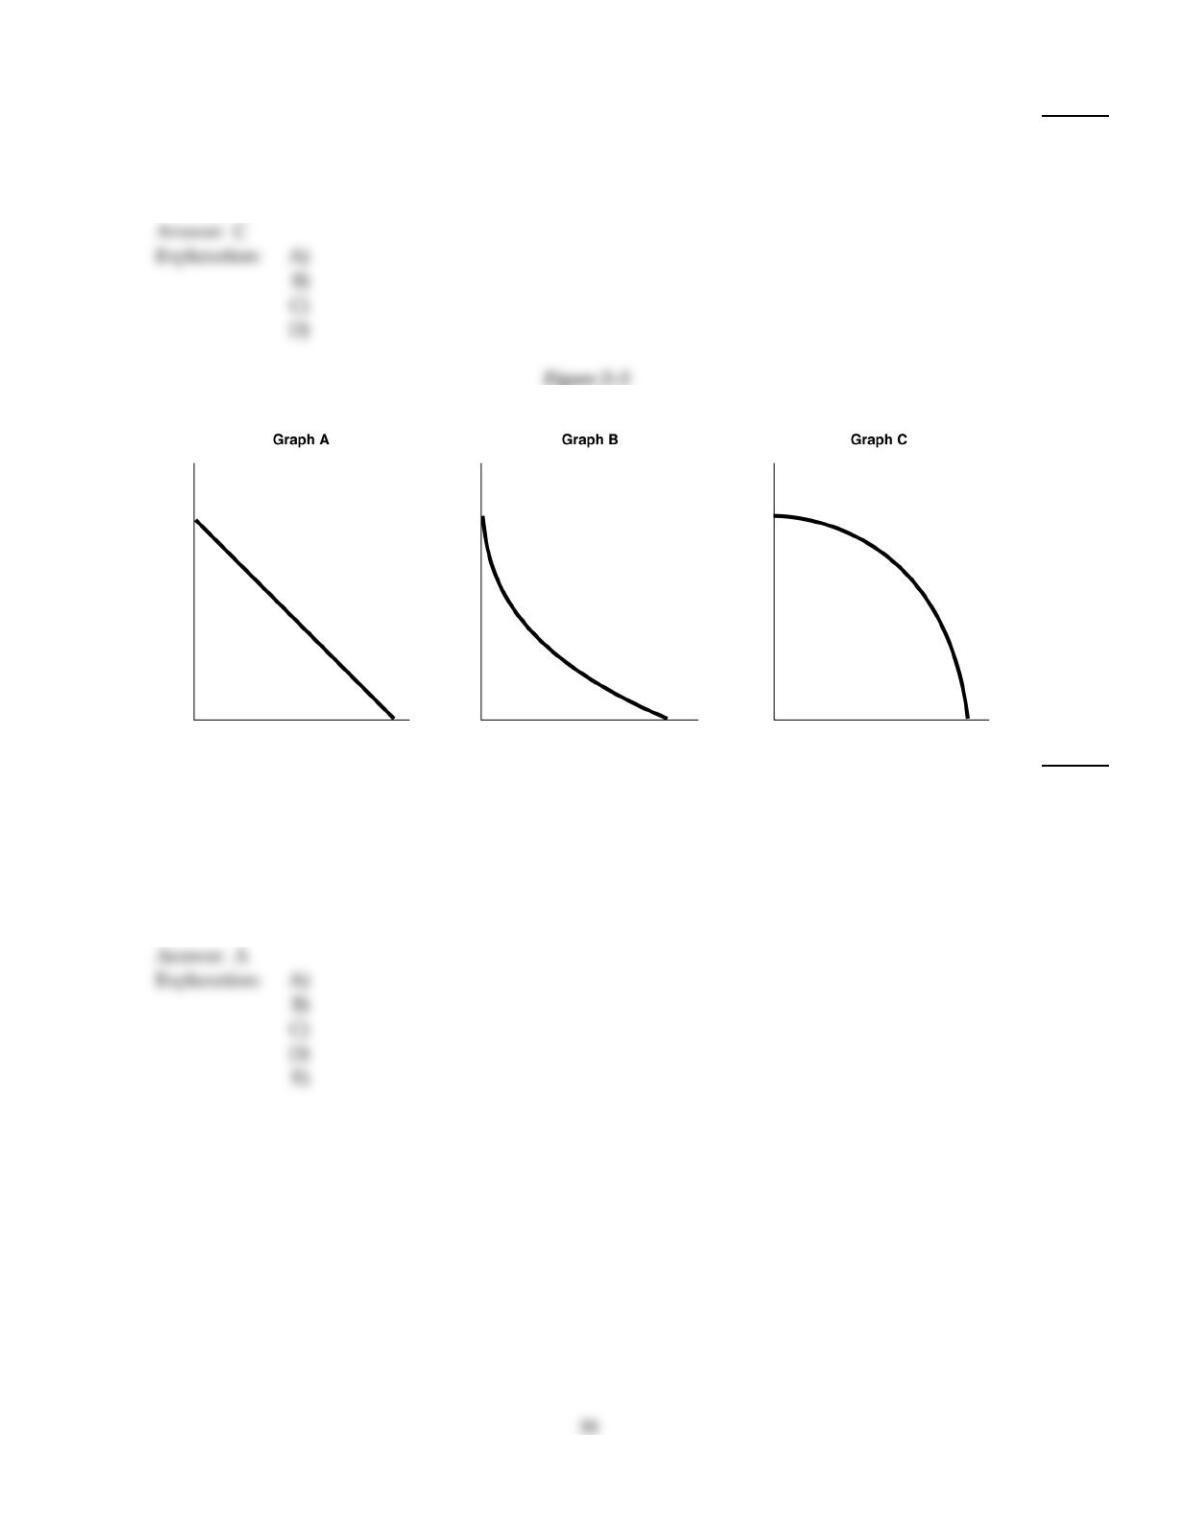
Refer to Figure 2–3. Carlos Vanya grows tomatoes and strawberries on his land. His land is equally
suited for growing either fruit. Which of the graphs in Figure 2–3 represent his production
possibilities frontier?
93)
A)
Graph A
B)
Graph B
C)
Graph C
D)
either graph B or Graph C
E)
either Graph A or Graph B
A
C
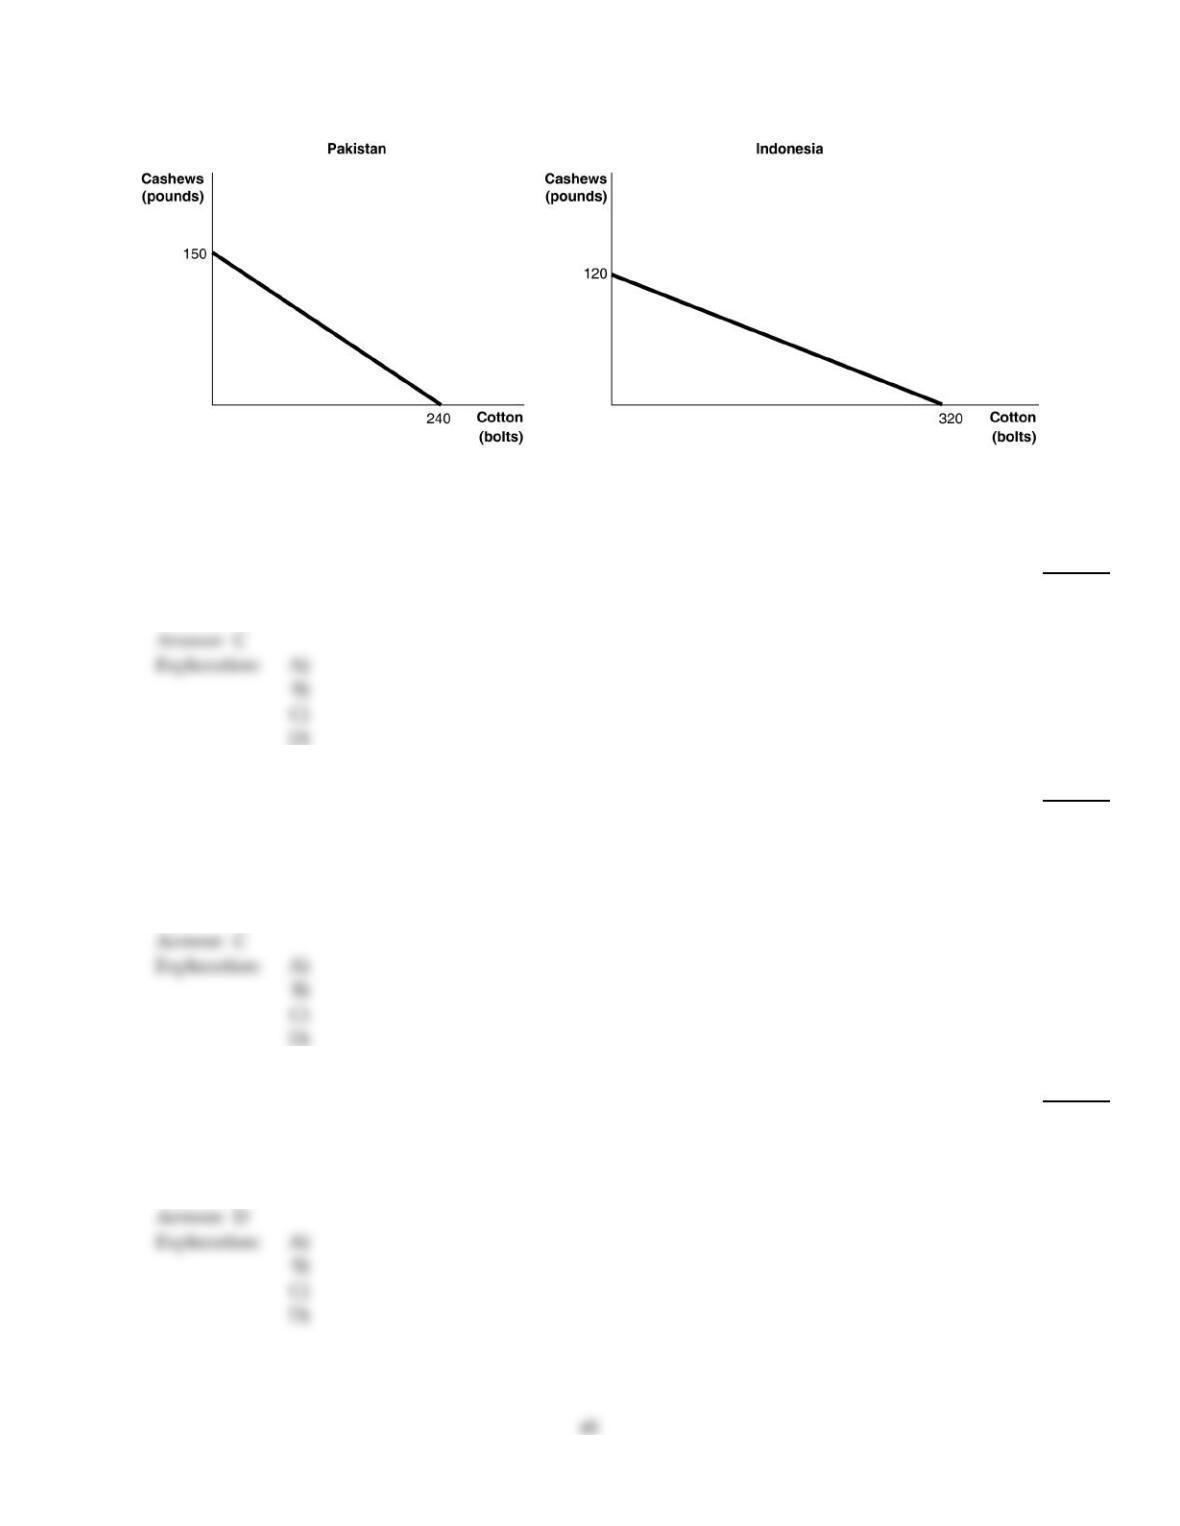
Figure 2–7
Figure 2–7 shows the production possibilities frontiers for Pakistan and Indonesia. Each country produces two goods, cotton
and cashews.
94)
Refer to Figure 2–7. What is the opportunity cost of producing 1 pound of cashews in Pakistan?
94)
A)
3/8 bolts of cotton
B)
5/8 bolts of cotton
C)
1 3/5 bolts of cotton
D)
240 bolts of cotton
95)
Which of the following is not an example of spending on goods and services in the circular flow
model?
95)
A)
Amanda purchases a new electric guitar to pursue her hobby seriously.
B)
Lenny buys a new digital camera to take pictures at his son’s graduation.
C)
Chaitanya buys a new spa pedicure chair for her expanding nail salon business.
D)
Hernan buys a pizza at Papa C’s.
Explanation:
96)
Which of the following statements about a simple circular flow model is true?
96)
A)
Households are sellers in the product market.
B)
Producers are neither buyers nor sellers in the product market.
C)
Households are neither buyers nor sellers in the factor market.
D)
Producers are buyers in the factor market.
Explanation:
Explanation:
Table 2–3
One Digital
Camera Wheat (per pound)
China 100 hours 4 hours
South Korea 60 hours 3 hours
Table 2–3 shows the number of labor hours required to produce a digital camera and a pound of wheat in China and South
Korea.
97)
Refer to Table 2–3. South Korea has a comparative advantage in
97)
A)
wheat production.
B)
both products.
C)
digital camera production.
D)
neither product.
98)
The opportunity cost of taking a semester–long economics class is
98)
A)
the cost of tuition and fees only.
B)
equal to the highest value of an alternative use of the time and money spent on the class.
C)
the value of the time spent in the classroom.
D)
the knowledge and enjoyment you receive from attending the class.
E)
zero because there is no admission charged if you are enrolled in the course.
B
C
Table 2–2
George Jack
Lawns Mowed 10 6
Gardens
Cultivated 5 4
Table 2–2 shows the output per day of two gardeners, George and Jack. They can either devote their time to mowing lawns
or cultivating gardens.
99)
Refer to Table 2–2. Which of the following statements is true?
99)
A)
Jack has an absolute advantage in garden cultivating and George has an absolute advantage
in lawn mowing.
B)
Jack has an absolute advantage in lawn mowing and George has an absolute advantage in
garden cultivating.
C)
George has an absolute advantage in both tasks.
D)
Jack has an absolute advantage in both tasks.
100)
In a report made to the U.S. Congress in 2001, the National Academy of Sciences cautioned that if
fuel economy encourages the production of smaller and lighter cars, “Some additional traffic
fatalities would be expected.” This statement suggests that
100)
A)
U.S. auto manufacturers are more concerned about producing fuel efficient cars to compete
with their Japanese and South Korean rivals than about consumer safety.
B)
society should value fuel economy more highly than consumer safety because of the
long–term environmental benefits generated by less gasoline use.
C)
there is a tradeoff between safety and fuel economy.
D)
society should value safety more highly than fuel economy.
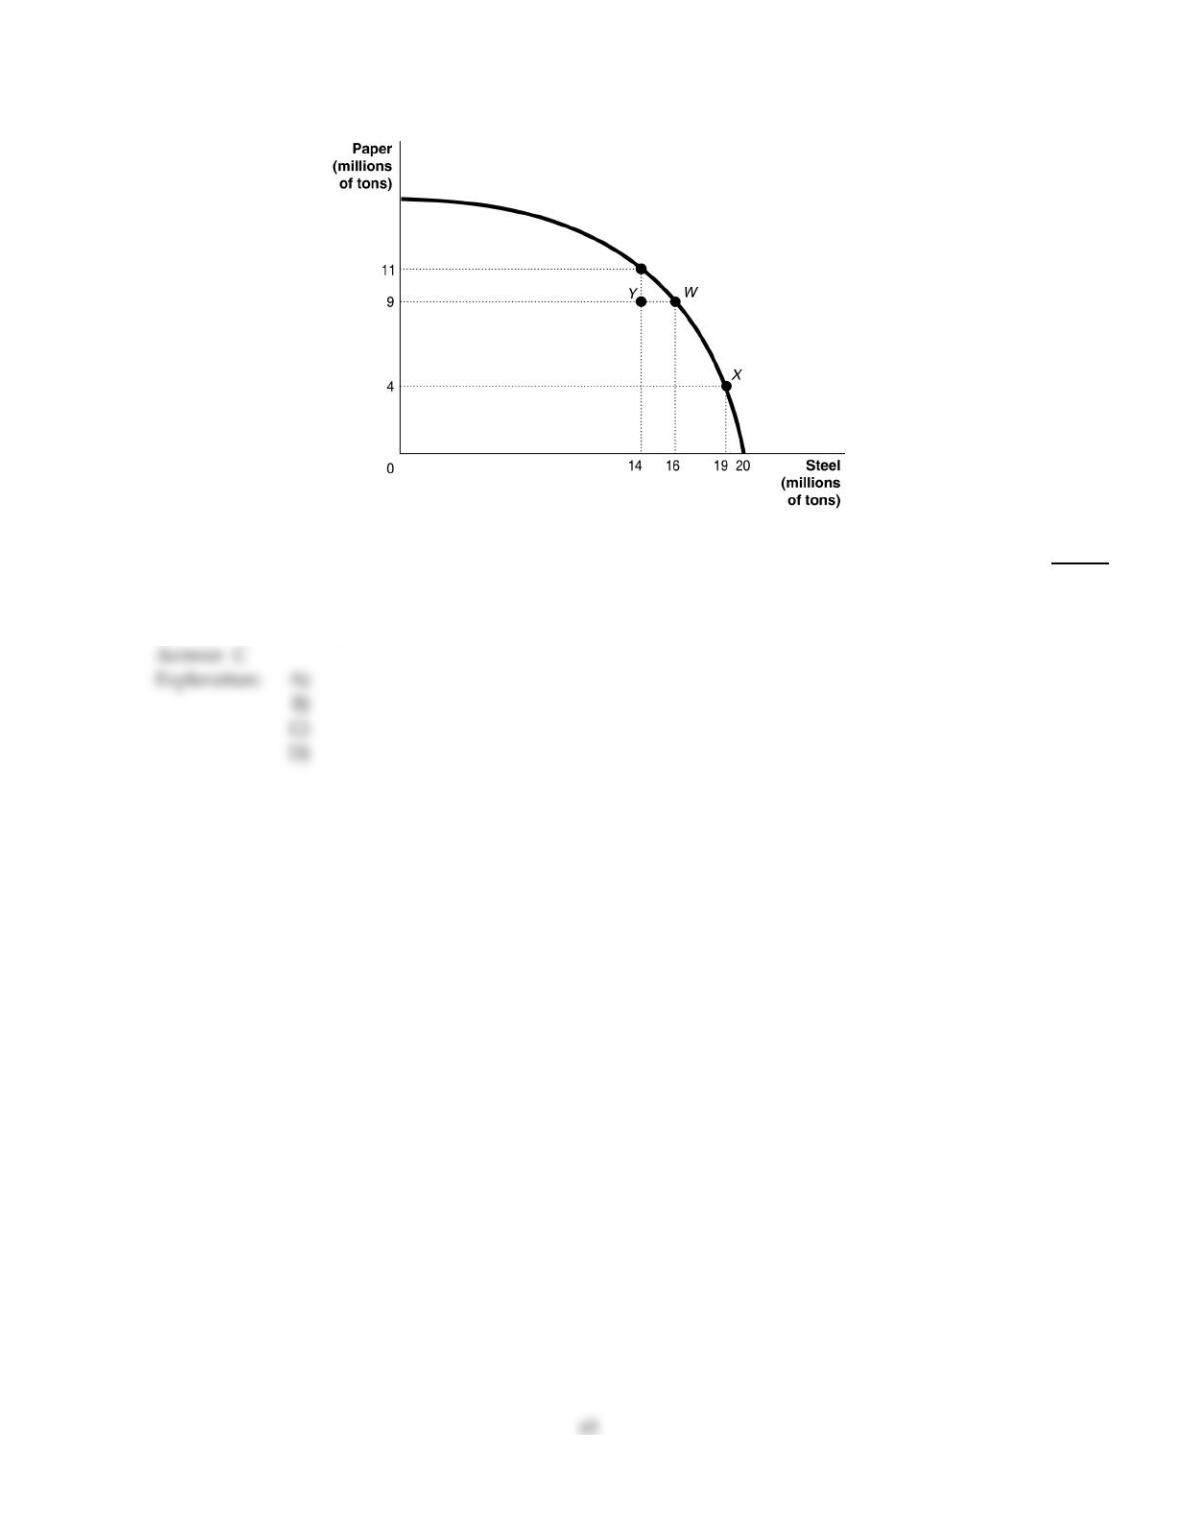
Figure 2–5
101)
Refer to Figure 2–5. If the economy is currently producing at point W, what is the opportunity cost
of moving to point X?
101)
A)
9 million tons of paper
B)
19 million tons of steel
C)
5 million tons of paper
D)
3 million tons of steel
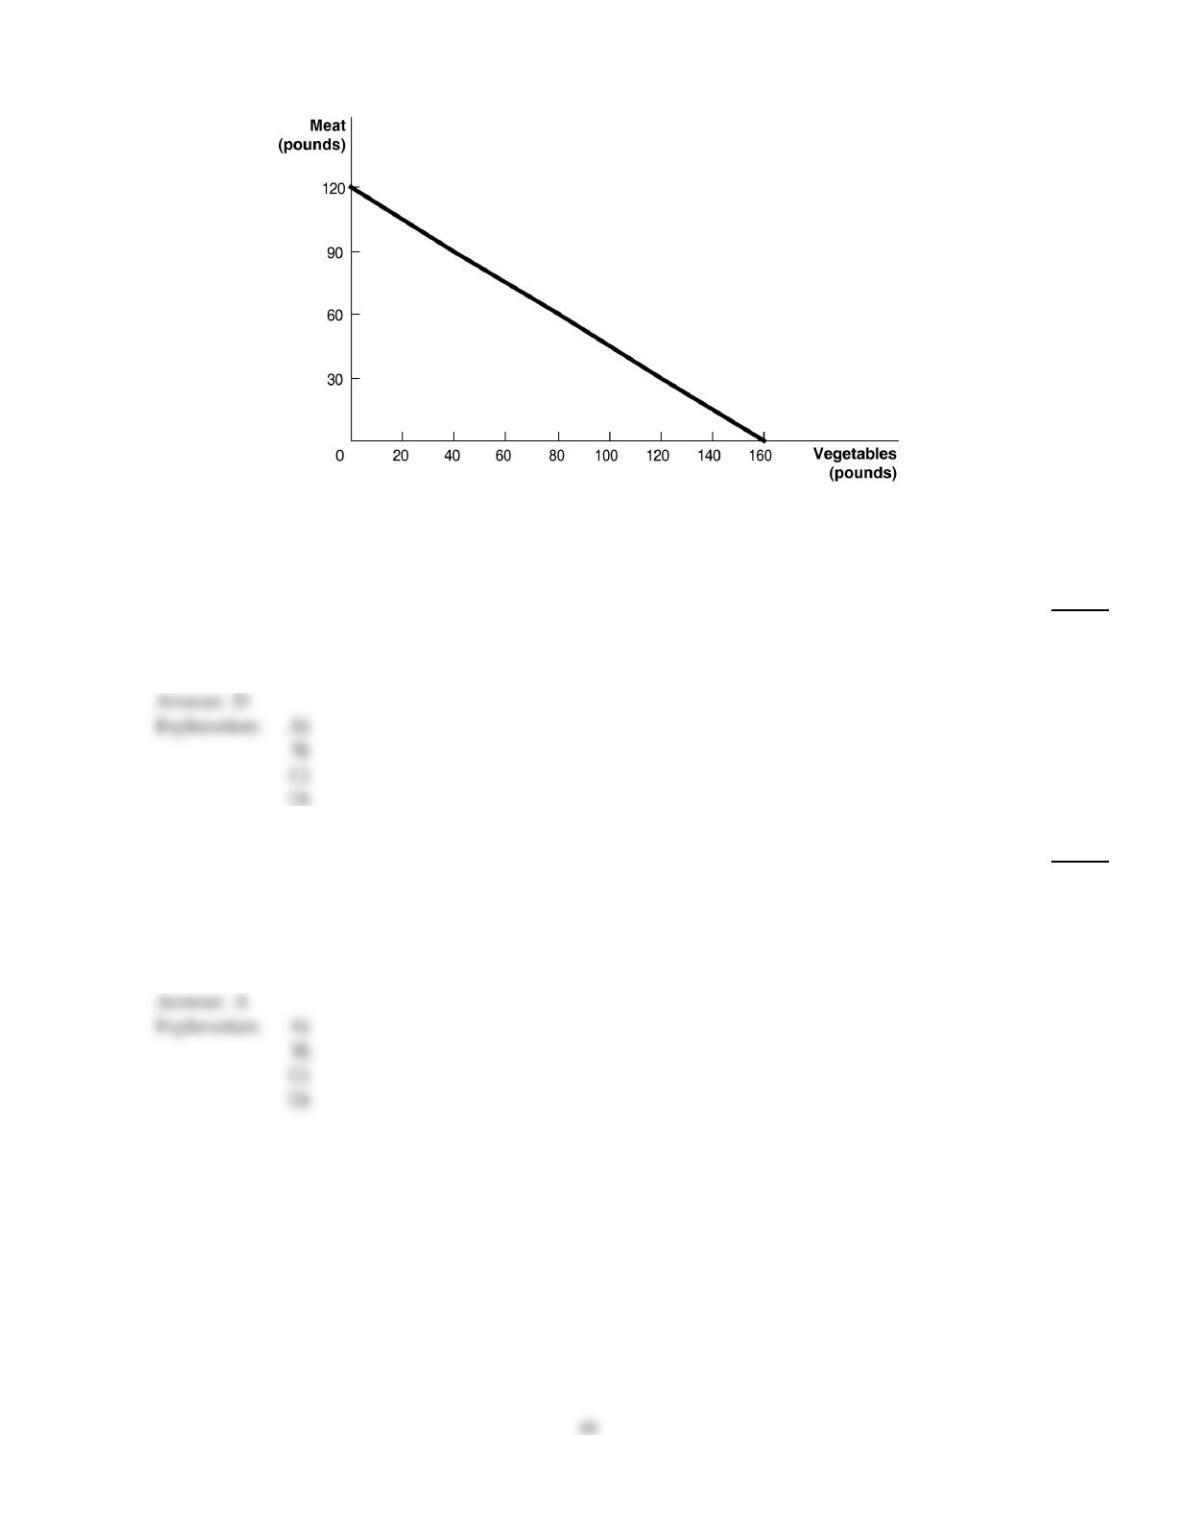
Figure 2–2
Figure 2–2 above shows the production possibilities frontier for Mendonca, an agrarian nation that produces two goods, meat
and vegetables.
102)
Refer to Figure 2–2. Suppose Mendonca is currently producing 60 pounds of vegetables per period.
How much meat is it also producing, assuming that resources are fully utilized?
102)
A)
45 pounds of meat
B)
80 pounds of meat
C)
100 pounds of meat
D)
75 pounds of meat
103)
The Great Depression of the 1930s, with a large number of workers and factories unemployed,
would be represented in a production possibilities frontier graph by
103)
A)
a point inside the frontier.
B)
an intercept on either the vertical or the horizontal axis.
C)
a point on the frontier.
D)
a point outside the frontier.
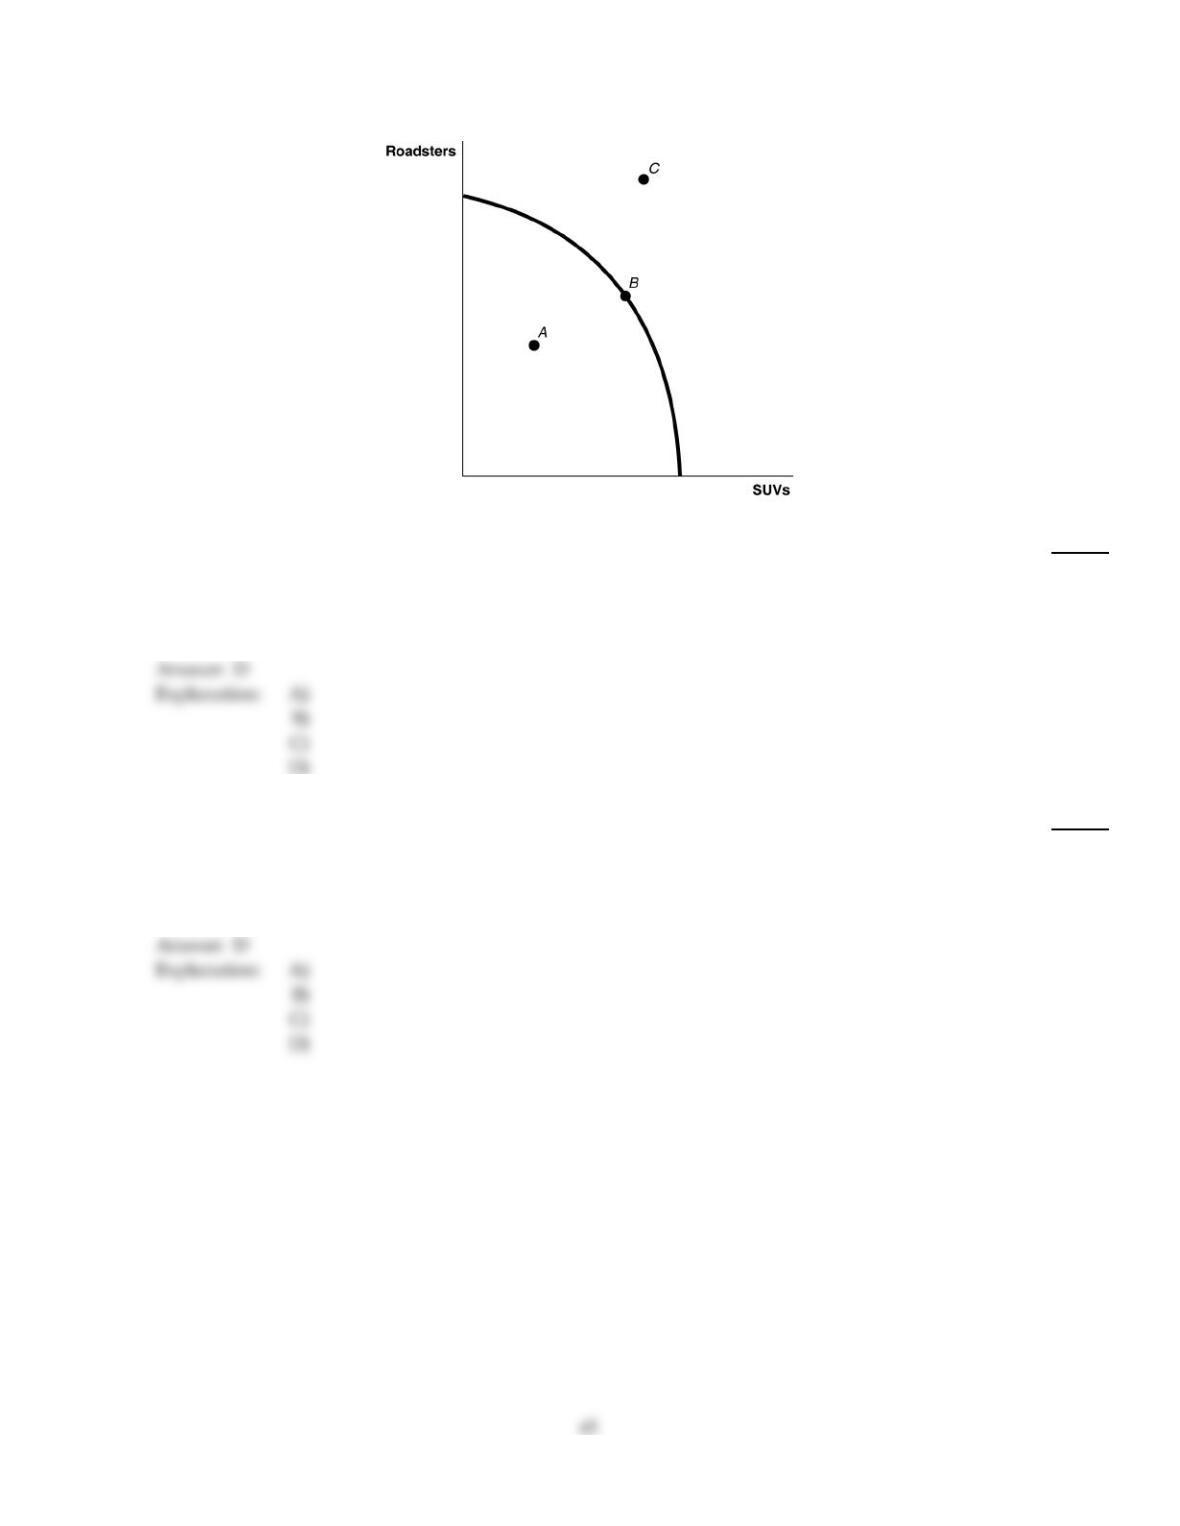
Figure 2–1
104)
Refer to Figure 2–1. Point C is
104)
A)
inefficient in that not all resources are being used.
B)
is the equilibrium output combination.
C)
efficient. All available resources are being fully utilized.
D)
unattainable with current resources.
105)
An outward shift of a nation’s production possibilities frontier can occur due to
105)
A)
a change in the amounts of one good desired.
B)
a reduction in unemployment.
C)
a natural disaster like a hurricane or bad earthquake.
D)
an increase in the labor force.
D
D
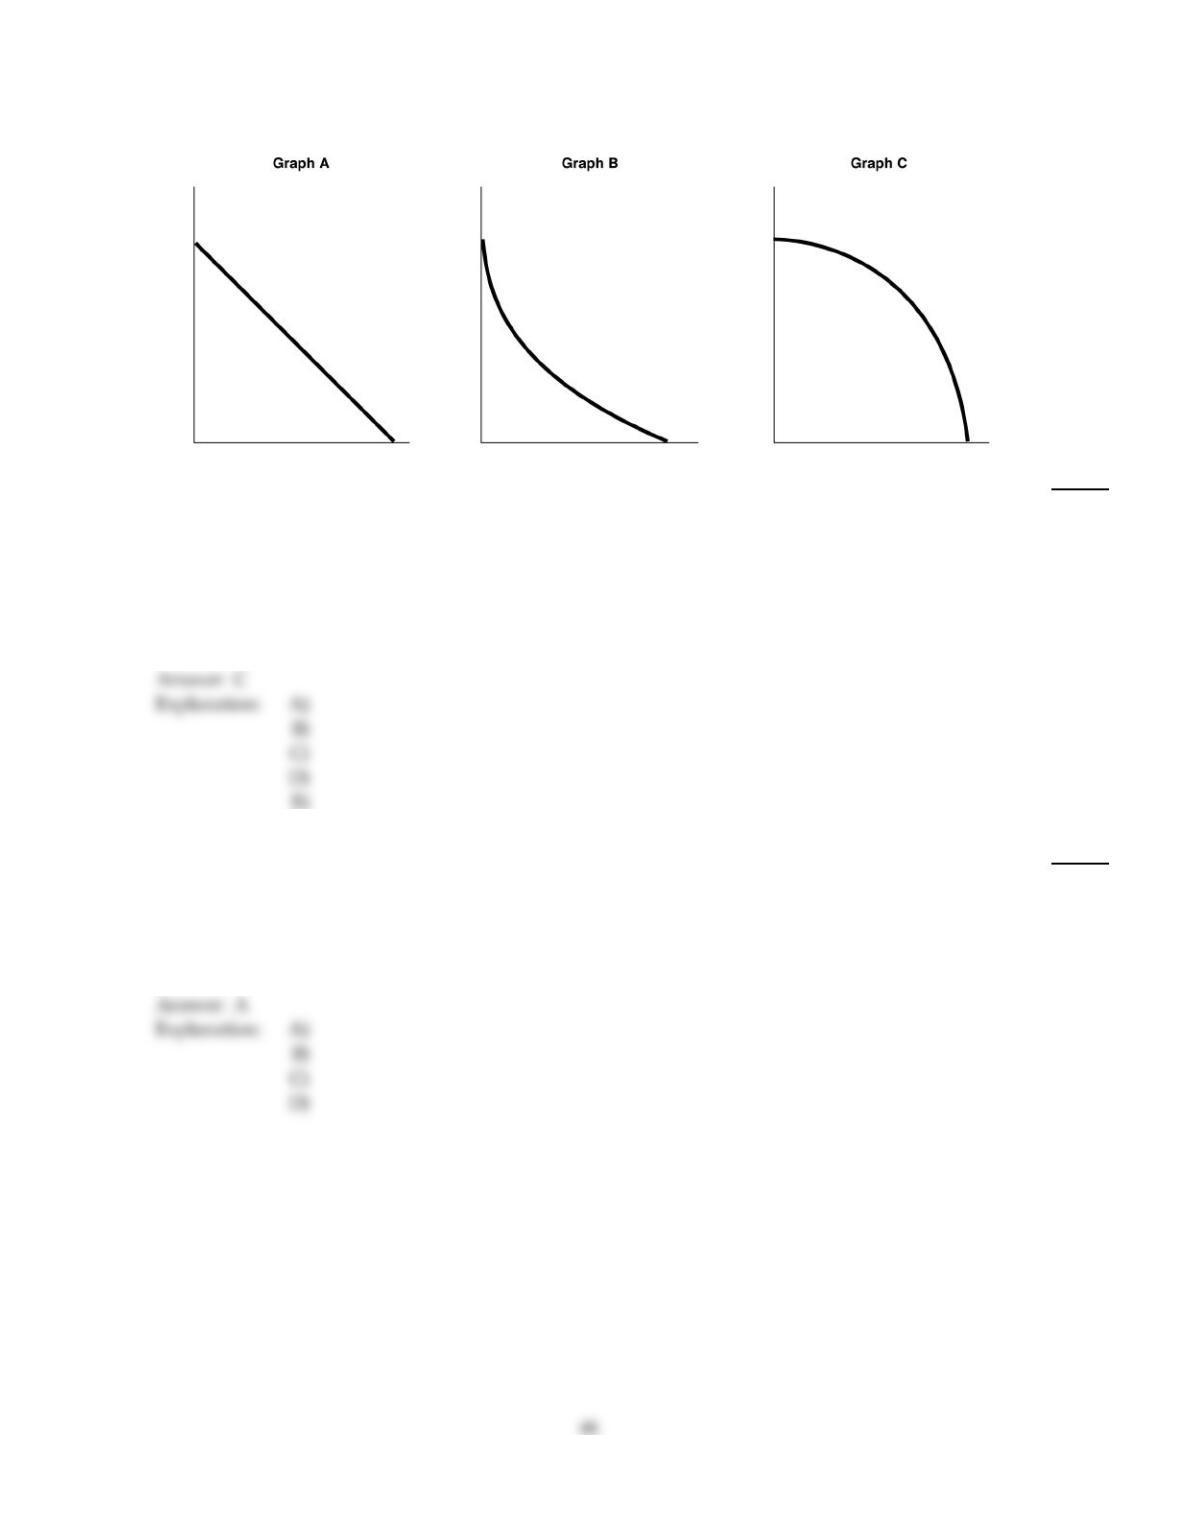
Figure 2–3
106)
Refer to Figure 2–3. Carlos Vanya grows tomatoes and strawberries on his land. A portion of his
land is more suitable for growing tomatoes and the other portion is better suited for strawberry
cultivation. Which of the graphs in Figure 2–3 represent his production possibilities frontier?
106)
A)
Graph A
B)
Graph B
C)
Graph C
D)
either Graph B or Graph C
E)
either Graph A or Graph B
107)
Suppose there is some unemployment in the economy and society decides that it wants more of one
good. Which of the following statements is true?
107)
A)
It can increase output without giving up another good by employing more resources.
B)
It will have to increase resource supplies.
C)
It is not possible to achieve this unless technology advances.
D)
It will have to give up production and consumption of some other good.
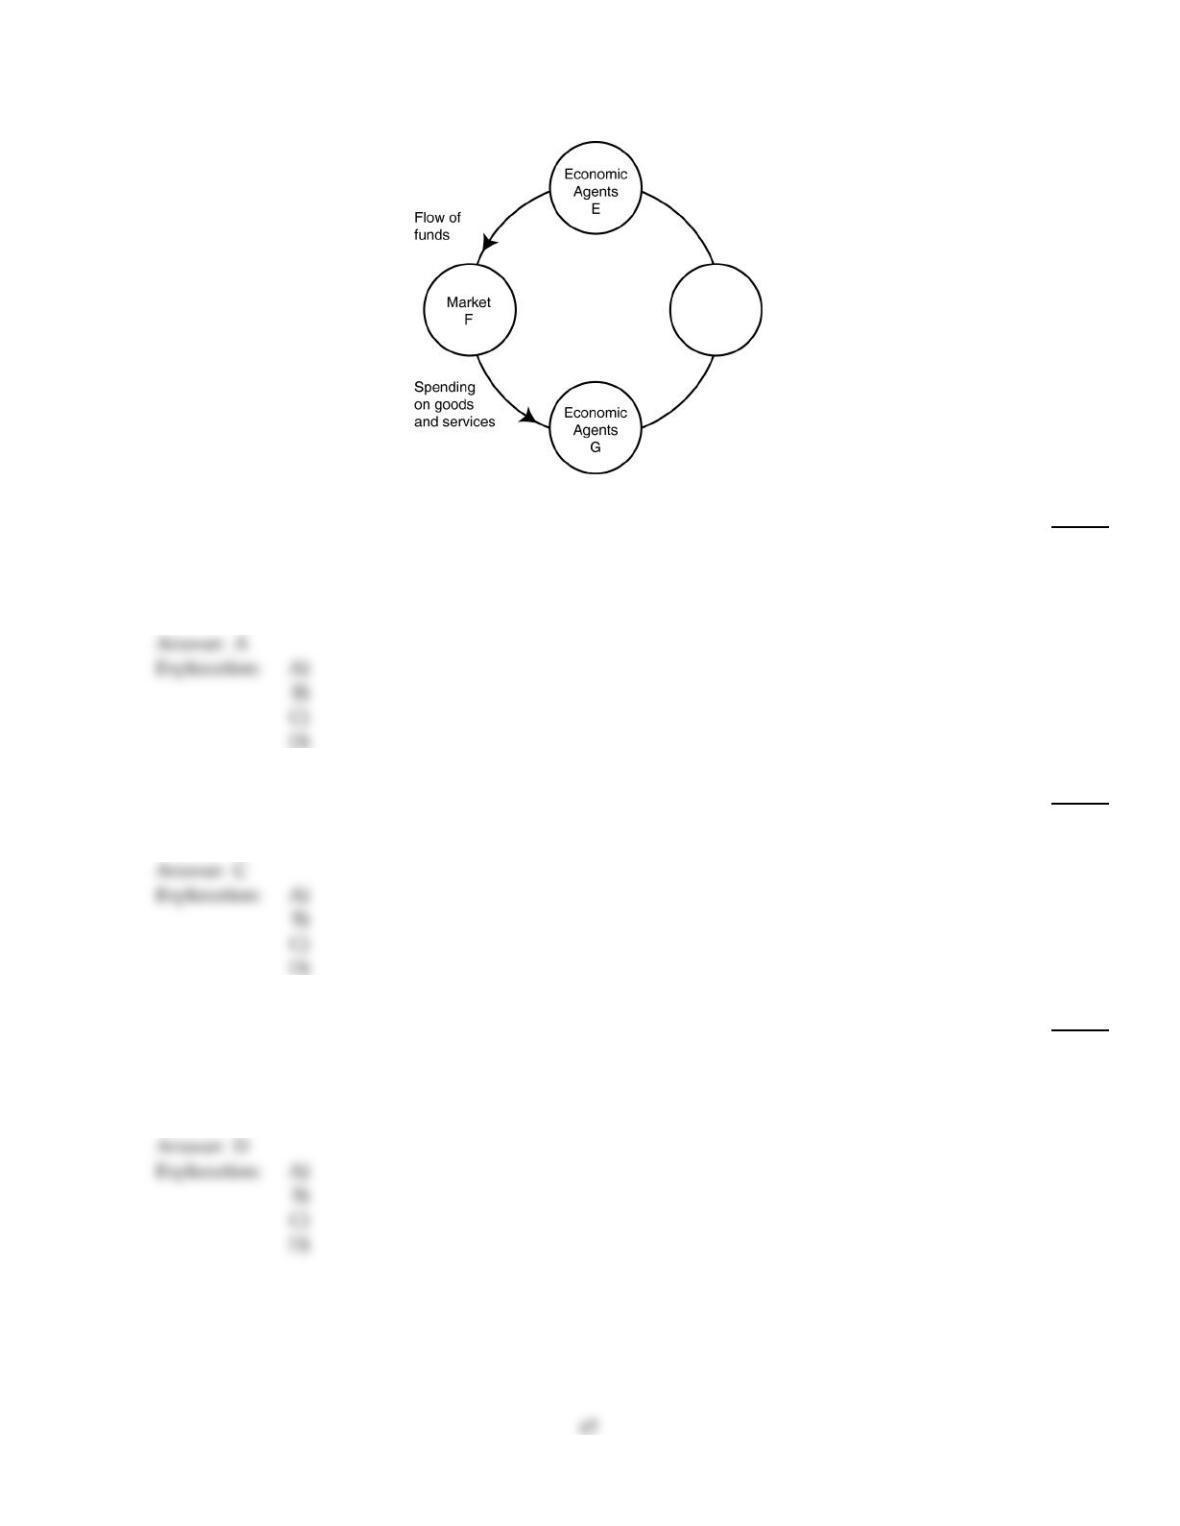
Figure 2–10
108)
Refer to Figure 2–10. The segment of the circular flow diagram in the Figure shows the flow of
funds from market F to economic agents G. The funds represent spending on goods and services.
What is market K and who are economic agents G?
108)
A)
F= product markets; G= firms
B)
F= product markets; G = households
C)
F= factor markets; G = firms
D)
F= factor markets; G= households
109)
If a commercial dairy farm wants to purchase feeding troughs, it does so in the
109)
A)
product market.
B)
dairy products market.
C)
factor market.
D)
output market.
110)
Adam Smith’s behavioral assumption about humans was that people
110)
A)
typically act randomly.
B)
are consistently greedy.
C)
typically act irrationally.
D)
usually act in a rational, self–interested way.
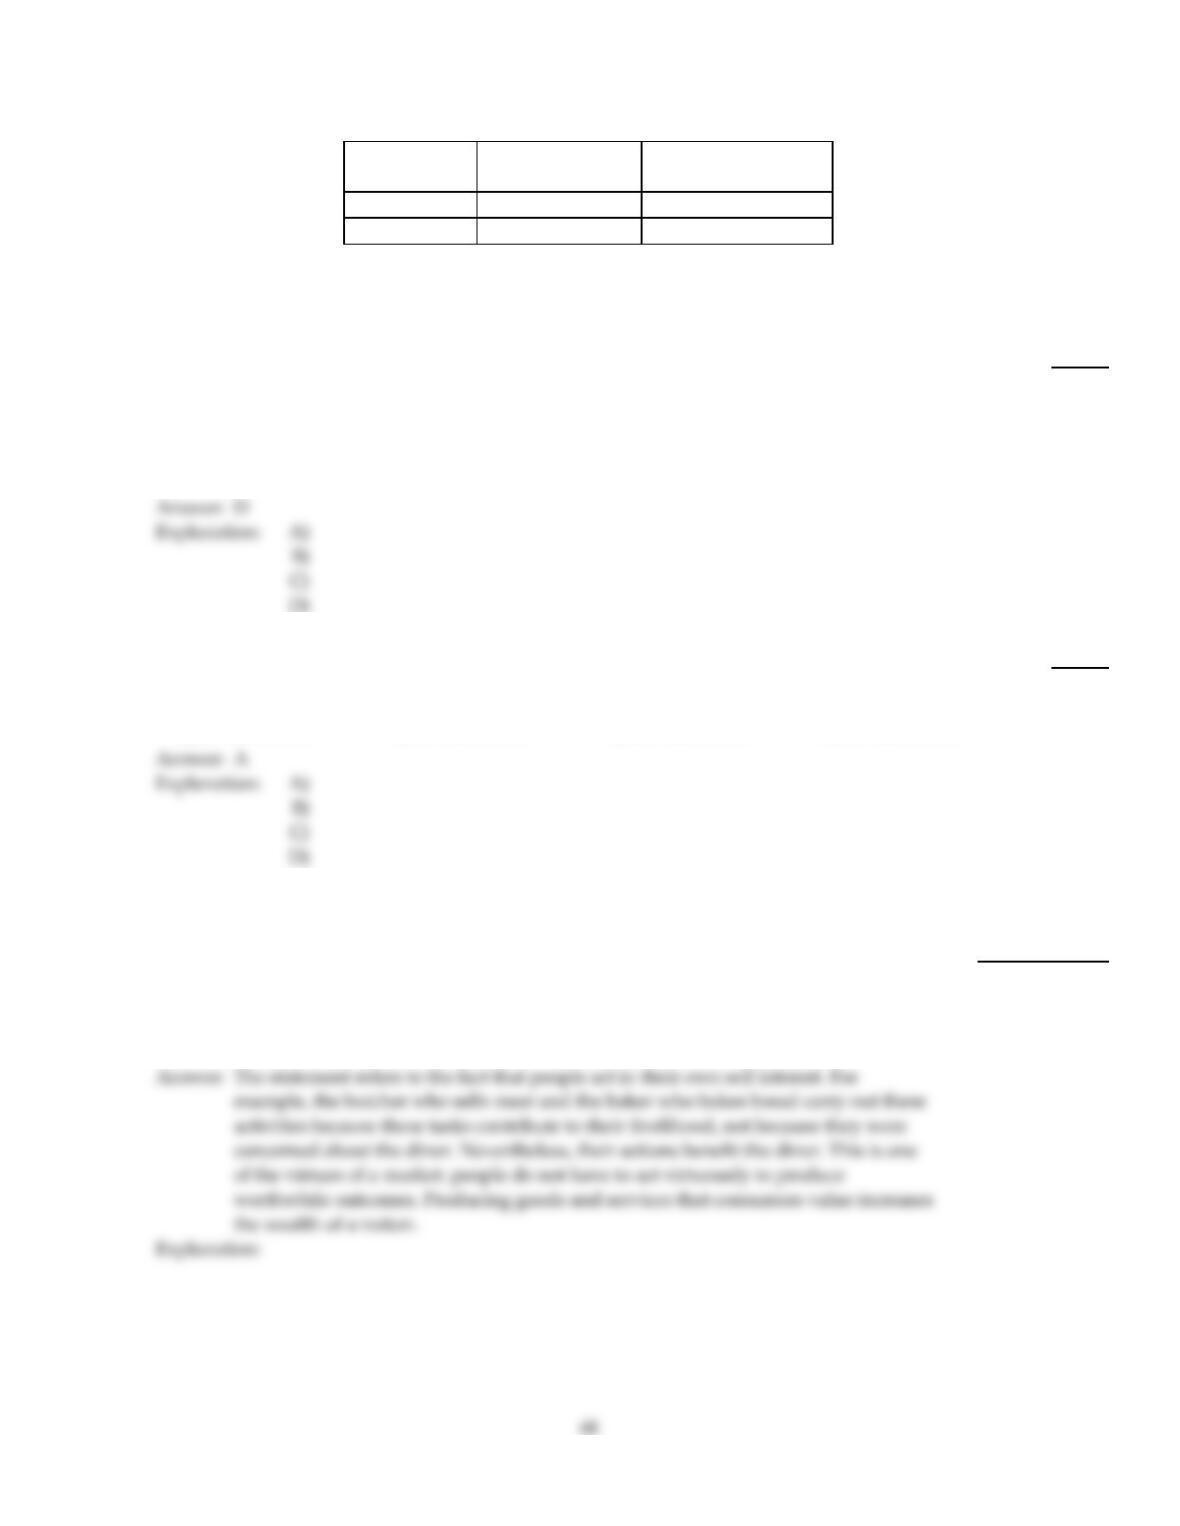
Table 2–3
One Digital
Camera Wheat (per pound)
China 100 hours 4 hours
South Korea 60 hours 3 hours
Table 2–3 shows the number of labor hours required to produce a digital camera and a pound of wheat in China and South
Korea.
111)
Refer to Table 2–3. Does either China or South Korea have an absolute advantage and if so, in what
product?
111)
A)
China has an absolute advantage in wheat.
B)
China has an absolute advantage in digital cameras.
C)
South Korea has an absolute advantage in wheat.
D)
South Korea has an absolute advantage in both products.
112)
Bella can produce either a combination of 60 silk roses and 80 silk leaves or a combination of 70 silk
roses and 55 silk leaves. If she now produces 60 silk roses and 80 silk leaves, what is the
opportunity cost of producing an additional 10 silk roses?
112)
A)
25 silk leaves
B)
10 silk leaves
C)
2.5 silk leaves
D)
55 silk leaves
SHORT ANSWER. Write the word or phrase that best completes each statement or answers the question.
113)
Adam Smith, the father of modern economics wrote in his book, An Inquiry into the Nature
and Causes of the Wealth of Nations, “It is not from the benevolence of the butcher, the
brewer, or the baker, that we expect our dinner but from their regard to their own interest.”
Explain what he meant by that statement and how such behavior promotes the wealth of a
nation.
113)
114)
When videos on YouTube contain material from television shows or movies, YouTube has
to obtain permission from several people who hold rights to the shows or movies, a
time–consuming process. YouTube’s vice president for business development was quoted
as saying, “It’s almost like technology has pushed far beyond the business practices and the
law, and now everything needs to kind of catch up.” What do you think he meant by that
statement?
114)
115)
Define the term “property rights.” Explain why the lack of well–defined and enforceable
property rights is detrimental to the smooth functioning of a market system.
115)
Table 2–4
Digital Camera Wheat (bushels)
China 100 hours 5 hours
South Korea 90 hours 3 hours
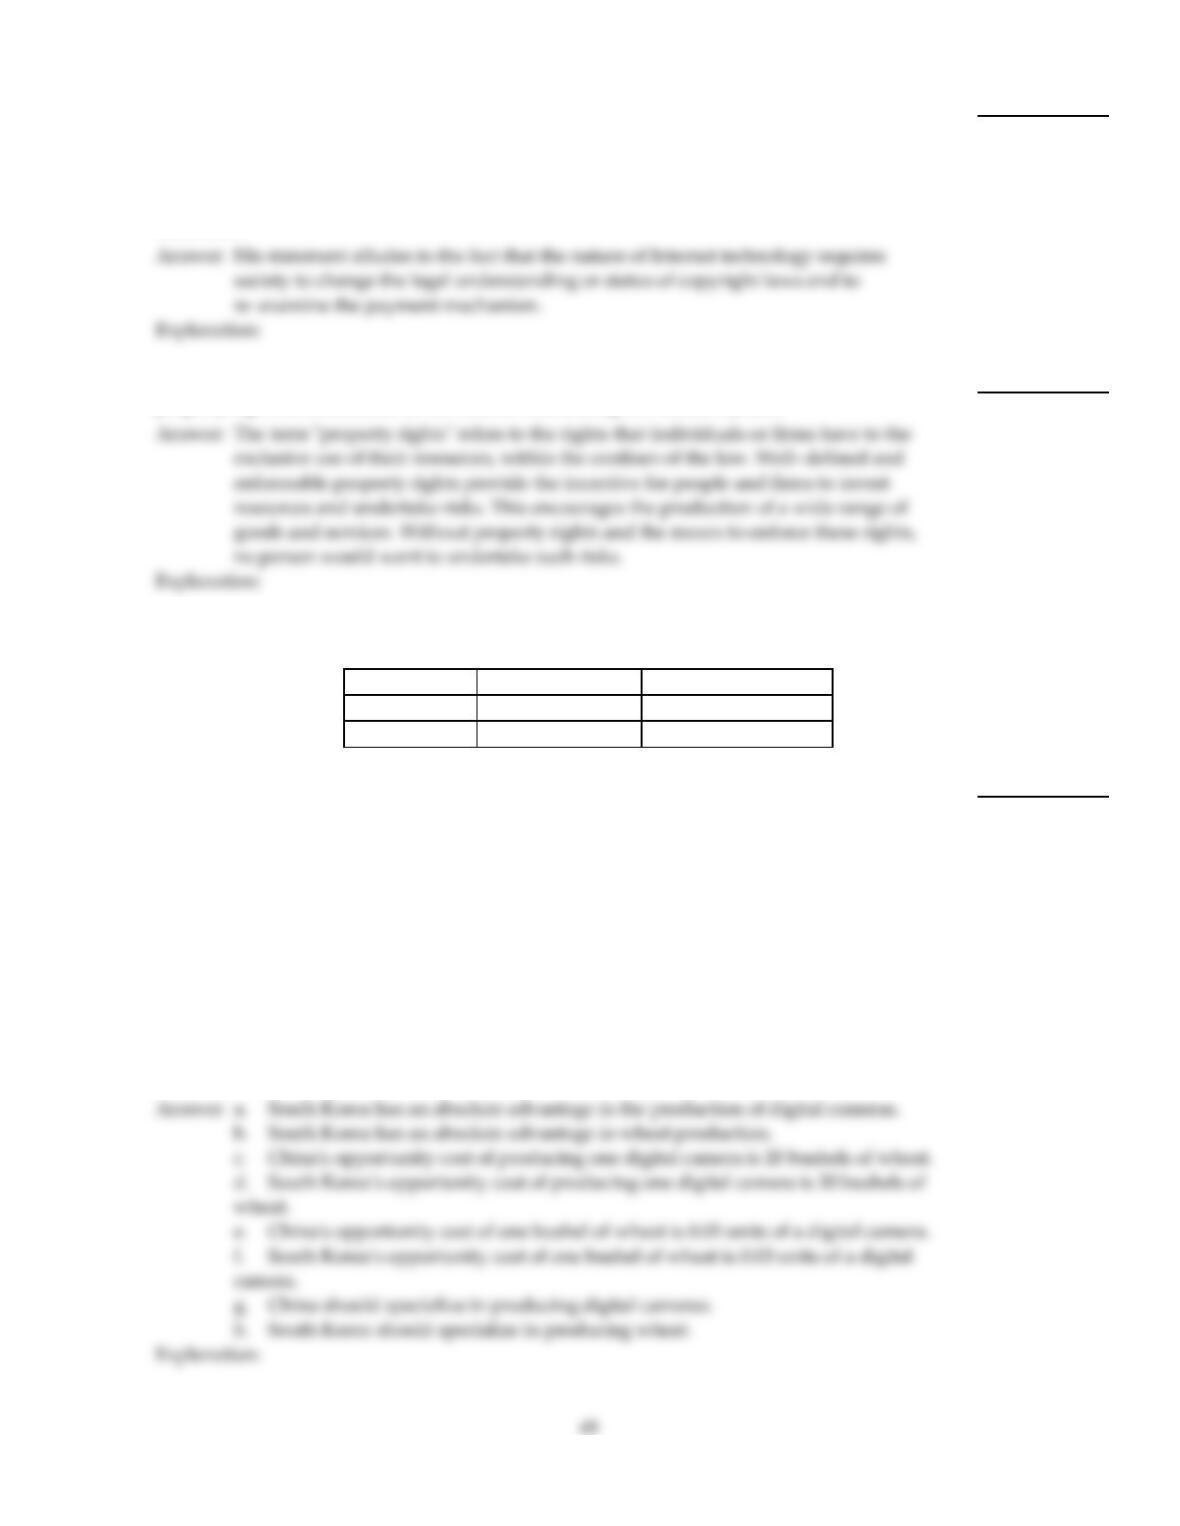
116)
Refer to Table 2–4. This table shows the number of labor hours required to produce a
digital cameras and a bushel of wheat in China and South Korea.
a. Which country has an absolute advantage in the production of digital cameras?
b. Which country has an absolute advantage in the production of wheat?
c. What is China’s opportunity cost of producing one digital camera?
d. What is South Korea’s opportunity cost of producing one digital camera?
e. What is China’s opportunity cost of producing one pound of wheat?
f. What is South Korea’s opportunity cost of producing one pound of what?
g. If each country specializes in the production of the product in which it has a
comparative advantage, who should produce digital cameras?
h. If each country specializes in the production of the product in which it has a
comparative advantage, who should produce wheat?
116)
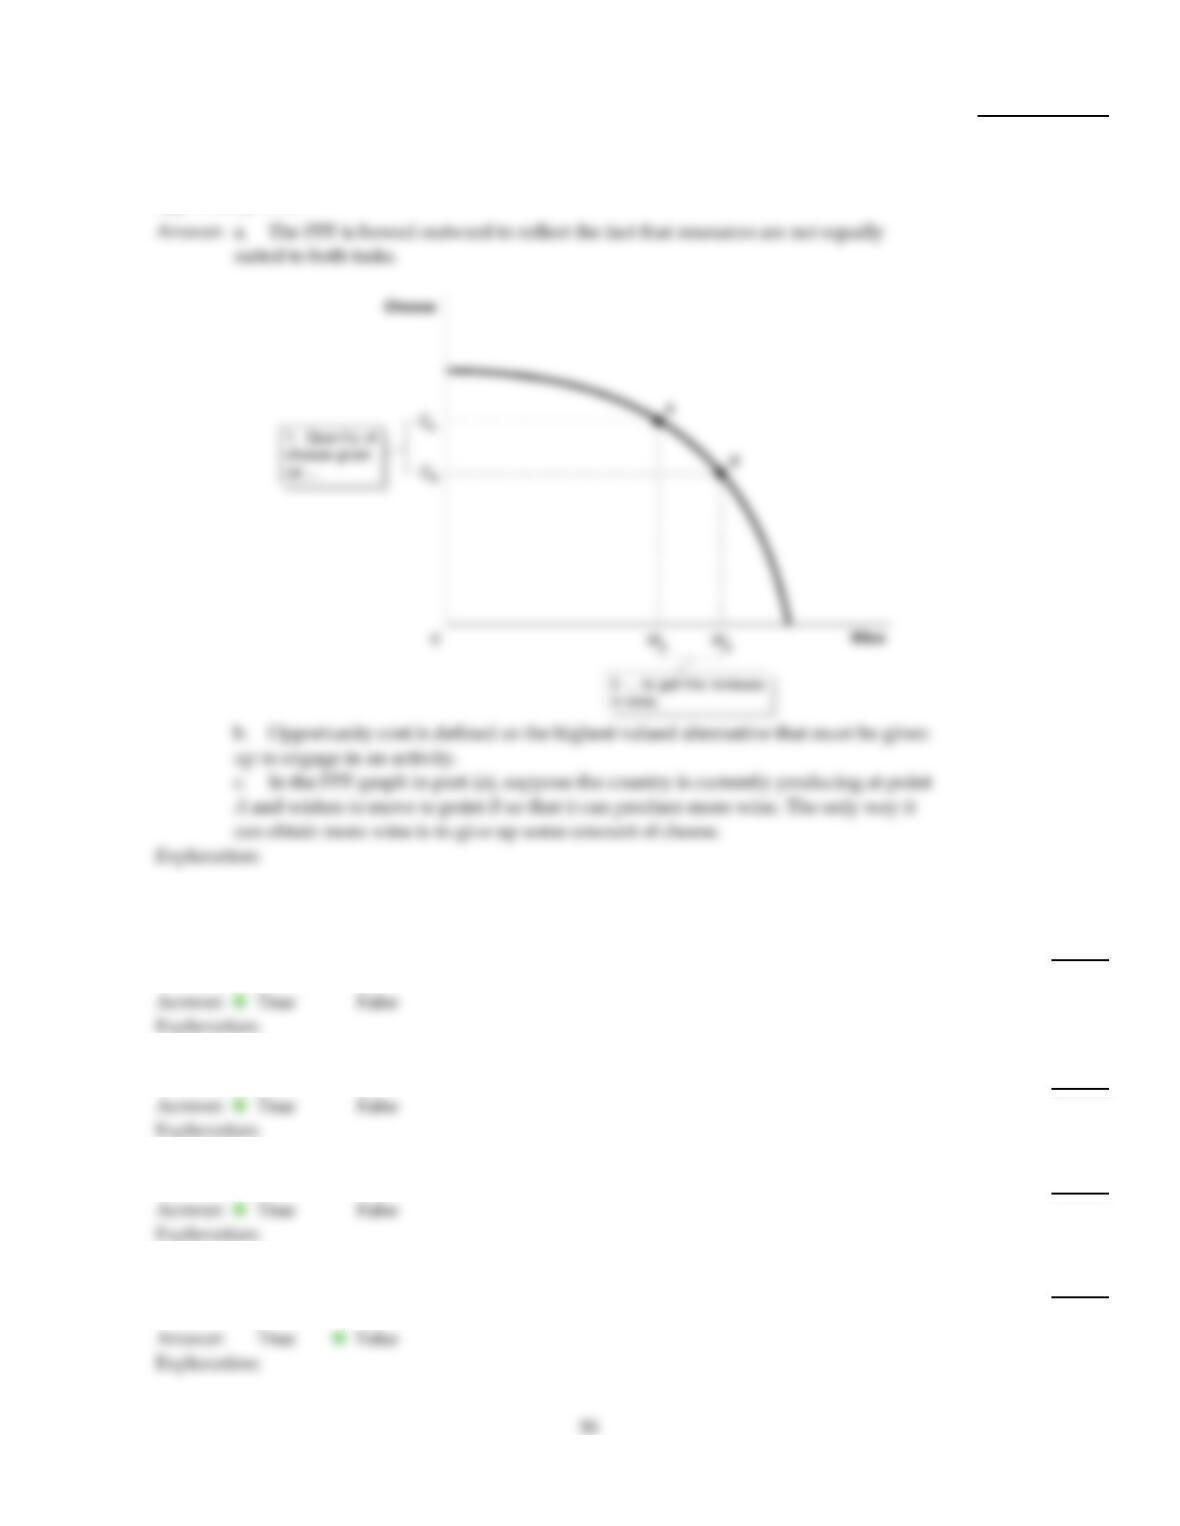
117)
a. Draw a production possibilities frontier for a country that produces two goods, wine
and cheese. Assume that resources are not equally suited to both tasks.
b. Define opportunity costs.
c. Use your production possibilities frontier graph to demonstrate the principle of
opportunity costs.
117)
TRUE/FALSE. Write ‘T’ if the statement is true and ‘F’ if the statement is false.
118)
It is possible to have a comparative advantage in producing a good or service without having an
absolute advantage.
118)
119)
The basis for trade is comparative advantage, not absolute advantage.
119)
120)
In a free market there are few restrictions on how factors of production can be employed.
120)
121)
In economics, the term “free market” refers to a market where no sales tax is imposed on products
sold.
121)
122)
A stand of redwood trees is not an example of a factor of production but the harvested and
processed redwood is a factor of production.
122)
123)
Suppose a country produces only two goods, then it is not possible to have a comparative
advantage in the production of both those goods.
123)
124)
To increase gas mileage automobile manufacturers make cars small and light. Large cars absorb
more of the impact of an accident than small cars but yield lower gas mileage These facts suggest
that there exists a negative relationship between safety and gas mileage.
124)
125)
If the opportunity cost of producing more of one good increases as more of that good is produced,
then the production method is inefficient.
125)
126)
The payment received by suppliers of entrepreneurial skills is called profit.
126)
127)
An increase in population shifts the production possibility frontier inwards over time.
127)
128)
In a two–good, two country world, if one country has an absolute advantage in the production of
both goods, it cannot benefit by trading with the other country.
128)
129)
Consider a country that produces only two goods: pineapples and tractors. If it is possible for this
country to increase its production of pineapples without producing fewer tractors, then its current
output combination is inefficient.
129)
130)
Any output combination inside a production possibility frontier is associated with unused or
underutilized resources.
130)
131)
Each person goes about her daily business seeking to maximize her own self interests. In doing so,
she contributes to the welfare of society at large. This is the idea underlying Adam Smith’s
“invisible hand.”
131)
132)
If additional units of a good could be produced at a constant opportunity cost the production
possibility frontier would be bowed outward.
132)
133)
If Blake can pick more cherries in one hour than Cody, then Blake has a comparative advantage in
cherry picking.
133)
134)
On a diagram of a production possibility frontier, opportunity cost is represented by the slope
of the production possibility frontier
134)
135)
In the circular flow model, households supply factors of production such as labor services in the
factor market.
135)
136)
If a country is producing efficiently and is on the production possibilities frontier, the only way to
produce more of one good is to produce less of the other.
136)
137)
An increase in the unemployment rate may be represented as a movement from a point on the
production possibilities frontier to a point inside the frontier.
137)
ESSAY. Write your answer in the space provided or on a separate sheet of paper.
Table 2–1
Possible Output
Combinations
Apples
(thousands of
pounds)
Pears
(thousands of
pounds)
A70 0
B60 20
C50 36
D40 48
E30 56
F20 60
G10 63
H 0 65
138)
Refer to Table 2–1. The Fruit Farm produces only apples and pears. The table above shows the maximum
possible output combinations of the two fruits using all resources and currently available technology.
a. Graph The Fruit Farm’s production possibilities frontier. Put apples on the horizontal axis and pears on the
vertical axis. Be sure to identify the output combination points on your diagram.
b. Suppose The Fruit Farm is currently producing at point D. What is the opportunity cost of producing an
52
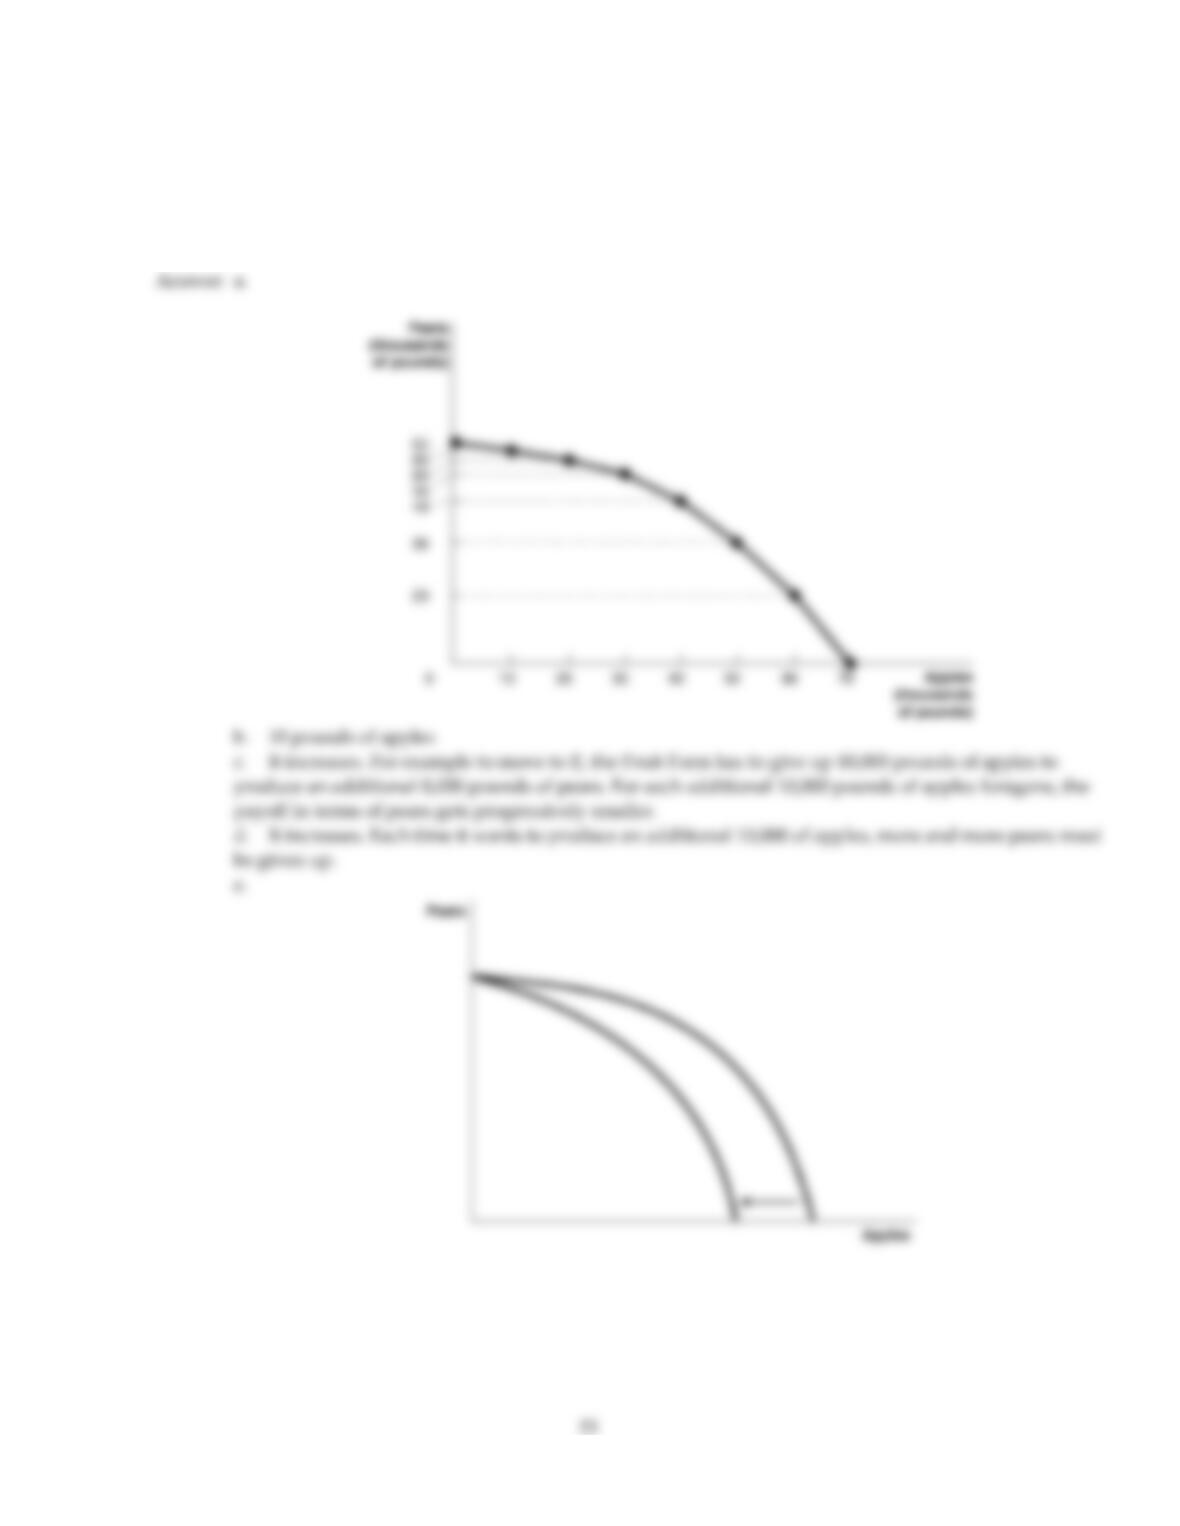
additional 8,000 pounds of pears?
c. Suppose The Fruit Farm is currently producing at point D. What happens to the opportunity cost of
producing more and more pears? Does it increase, decrease or remain constant? Explain your answer.
d. Suppose The Fruit Farm is currently producing at point G. What happens to the opportunity cost of
producing more and more apples? Does it increase, decrease or remain constant? Explain your answer.
e. Suppose The Fruit Farm is plagued by the apple maggot infestation which destroys apple trees but not
pears. Show in a graph what happens to its PPF.

Table 2–5
Digital Camera Wheat
(bushels )
China 100 hours 5 hours
South Korea 90 hours 3 hours
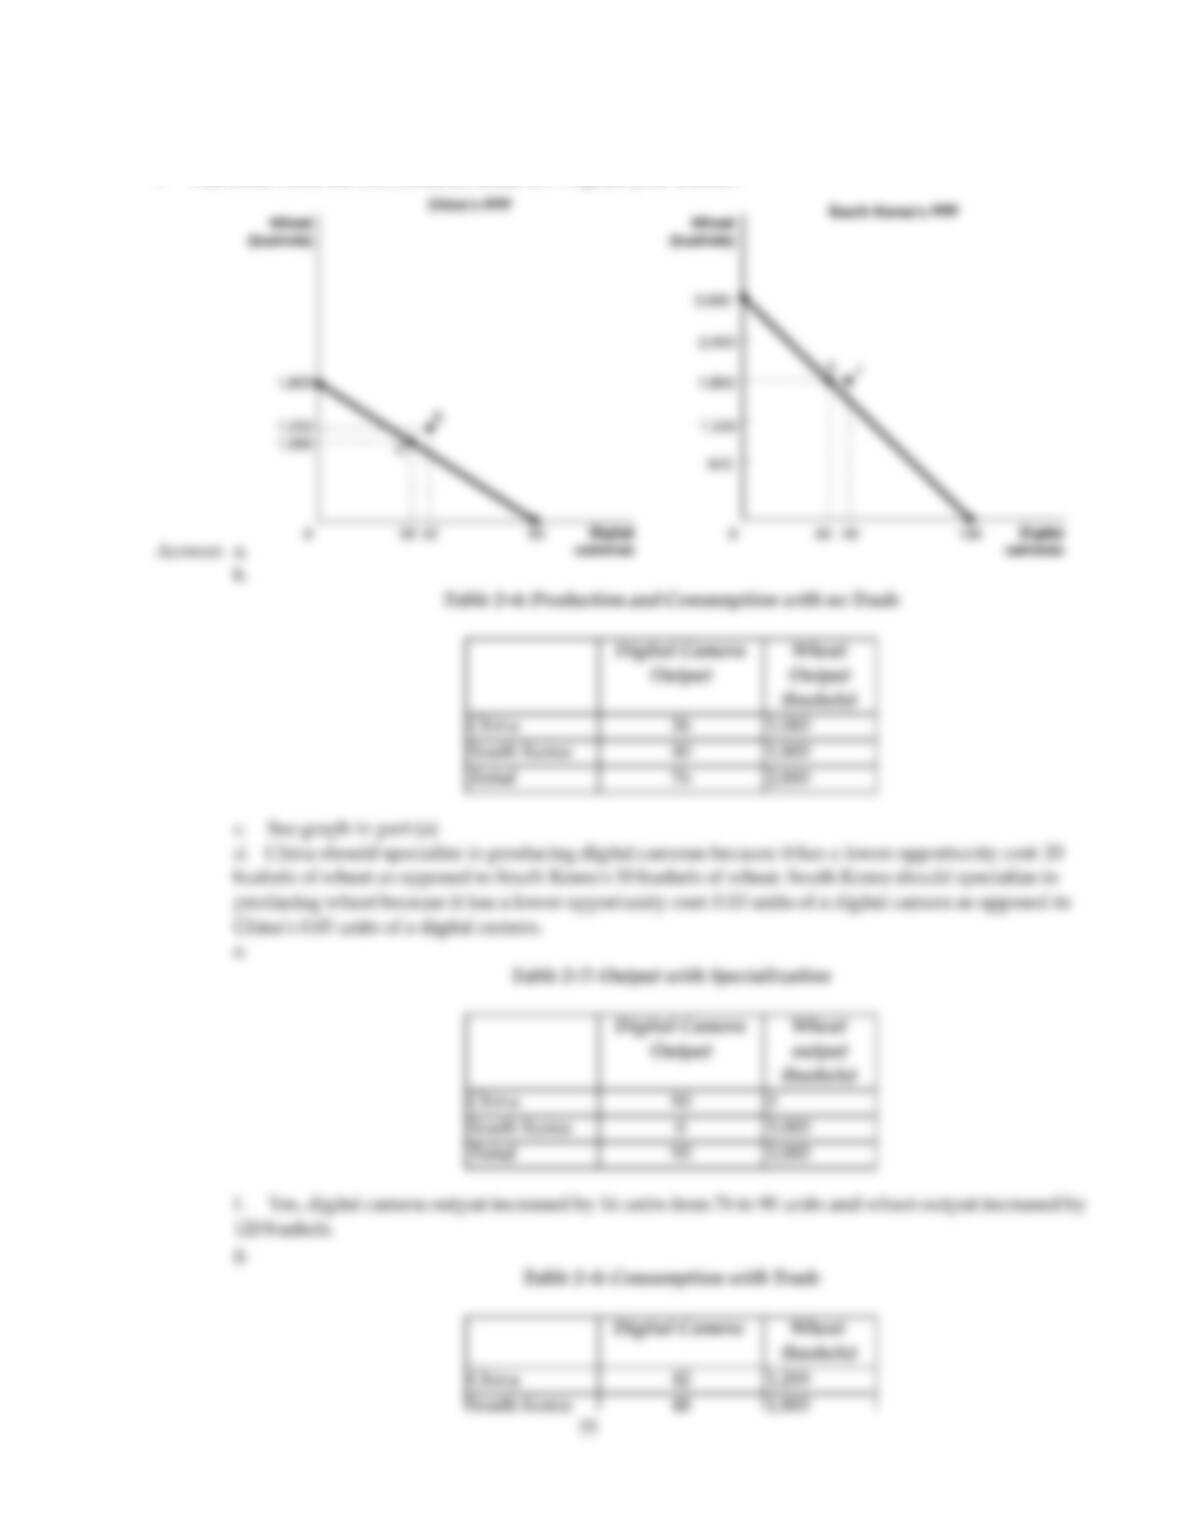
139)
Refer to Table 2–5. This table shows the number of labor hours required to produce a digital camera and a
bushel of wheat in China and South Korea.
a. If each country has a total of 9,000 labor hours to devote to the production of the two goods, draw the
production possibilities frontier for each country. Put “Digital Cameras” on the horizontal axis and “Wheat” on
the vertical axis. Be sure to identify the intercept values on your graphs.
b. Suppose each country allocates 60% of its labor hours to wheat production and 40% to the production of
digital cameras. Complete Table 2–6 below to show each country’s output of the two products.
Table 2–6: Production and Consumption with no Trade
Digital Camera
Output
Wheat
output
(bushels)
China
South Korea
Total
c. If the two countries do not trade and consume whatever they produce, identify the current production and
consumption point for each country on their respective production possibilities frontiers. Label China‘s
consumption point “C” and South Korea’s consumption point, “K“.
d. Suppose the two countries specialize and trade. Who should produce digital cameras and who should
produce wheat? Explain your answer.
e. Complete Table 2–7 below to show each country’s output with specialization.
Table 2–7: Output with Specialization
Digital Camera
Output
Wheat
Output
(bushels)
China
South Korea
Total
f. Did specialization increase the combined output for the two countries without any increase in resources? If
so, by how much?
g. Suppose China and South Korea agree to trade so that in exchange for 1,200 bushels of wheat, the exporter
of wheat receives 48 digital cameras. Complete Table 2.8 below to show each country’s consumption bundle
after trade.
Table 2.8: Consumption with Trade
Digital Camera Wheat
(bushels)
China
South Korea
54
h. Show the consumption points after trade on each country’s production possibilities frontier. Label these
points “B” for China and “J” for Korea.
i. Has trade made the two countries better off? Explain your answer.
SHORT ANSWER. Write the word or phrase that best completes each statement or answers the question.
140)
Suppose in the United States, the opportunity cost of producing a motor engine is 4 auto
bodies. In Canada, the opportunity cost of producing a motor engine is 2 auto bodies.
a. What is the opportunity cost of producing an auto body for the United States?
b. What is the opportunity cost of producing an auto body for Canada?
c. Which country has a comparative advantage in the production of auto bodies?
d. Which country has a comparative advantage in the production of motor engines?
140)