Exhibit 2-6 Production possibilities curve data
A
B
C
D
E
F
Capital goods
150
140
120
90
50
0
Consumer goods
0
20
40
60
80
100
97. In Exhibit 2-6, the concept of increasing opportunity costs is represented by the fact that:
a.
the quantity of capital goods produced must be less than 150.
b.
the quantity of consumer goods is constant for each change in the quantity of capital goods
produced.
c.
greater amounts of capital goods must be sacrificed to produce each additional unit of
consumer goods.
d.
the amount of consumer goods produced must be greater than zero.
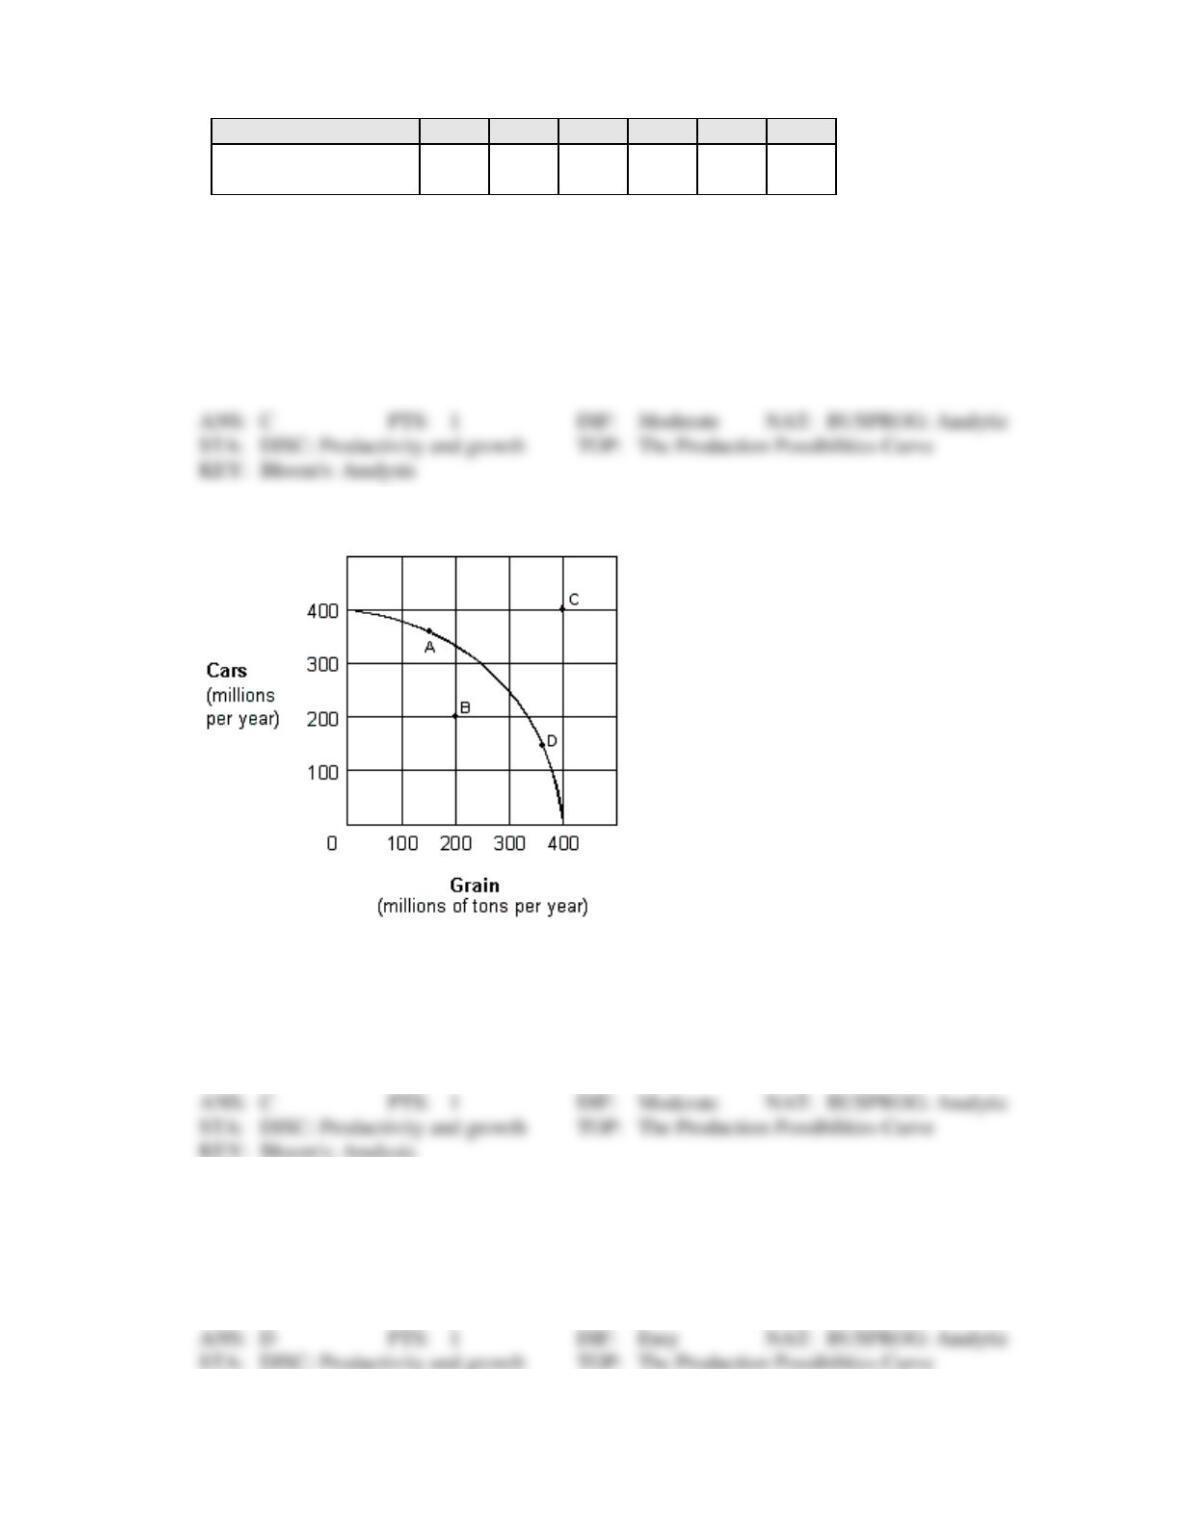
Exhibit 2-7 Production possibilities curve
98. For the economy shown in Exhibit 2-7, which of the following is true when the economy is at point A?
a.
More cars are being produced than are needed.
b.
There must be resources that are not being used fully.
c.
Some car production must be forgone in order to produce more grain in the same period.
d.
Increased grain production would be impossible.
99. For the economy shown in Exhibit 2-7 to operate at point C, it must:
a.
be willing to lower the price of grain.
b.
use its given resources more efficiently than it would at point A.
c.
experience resource unemployment.
d.
experience an increase in its resources and/or an improvement in its technology.
KEY: Bloom’s: Comprehension
Exhibit 2-8 Production possibilities curve data
A
B
C
D
E
F
Capital goods
15
14
12
9
5
0
Consumer goods
0
2
4
6
8
10
100. As shown in Exhibit 2-8, the concept of increasing opportunity costs is reflected in the fact that:
a.
the quantity of consumer goods produced can never be zero.
b.
the labor force in the economy is homogeneous.
c.
greater amounts of capital goods must be sacrificed to produce an additional 2 units of
consumer goods.
d.
a graph of the production data is a downward-sloping straight line.
101. As shown in Exhibit 2-8, a total output of 0 units of capital goods and 10 units of consumer goods is:
a.
the maximum rate of output for this economy.
b.
an inefficient way of using the economy’s scarce resources.
c.
the result of maximum use of the economy’s labor force.
d.
unobtainable in this economy.
102. As shown in Exhibit 2-8, a total output of 14 units of consumer goods and 1 unit of capital goods is:
a.
the result of maximum use of the economy’s labor force.
b.
an efficient way of using the economy’s scarce resources.
c.
unobtainable in this economy.
d.
less than the maximum rate of output for this economy.
Exhibit 2-9 Production possibilities curve
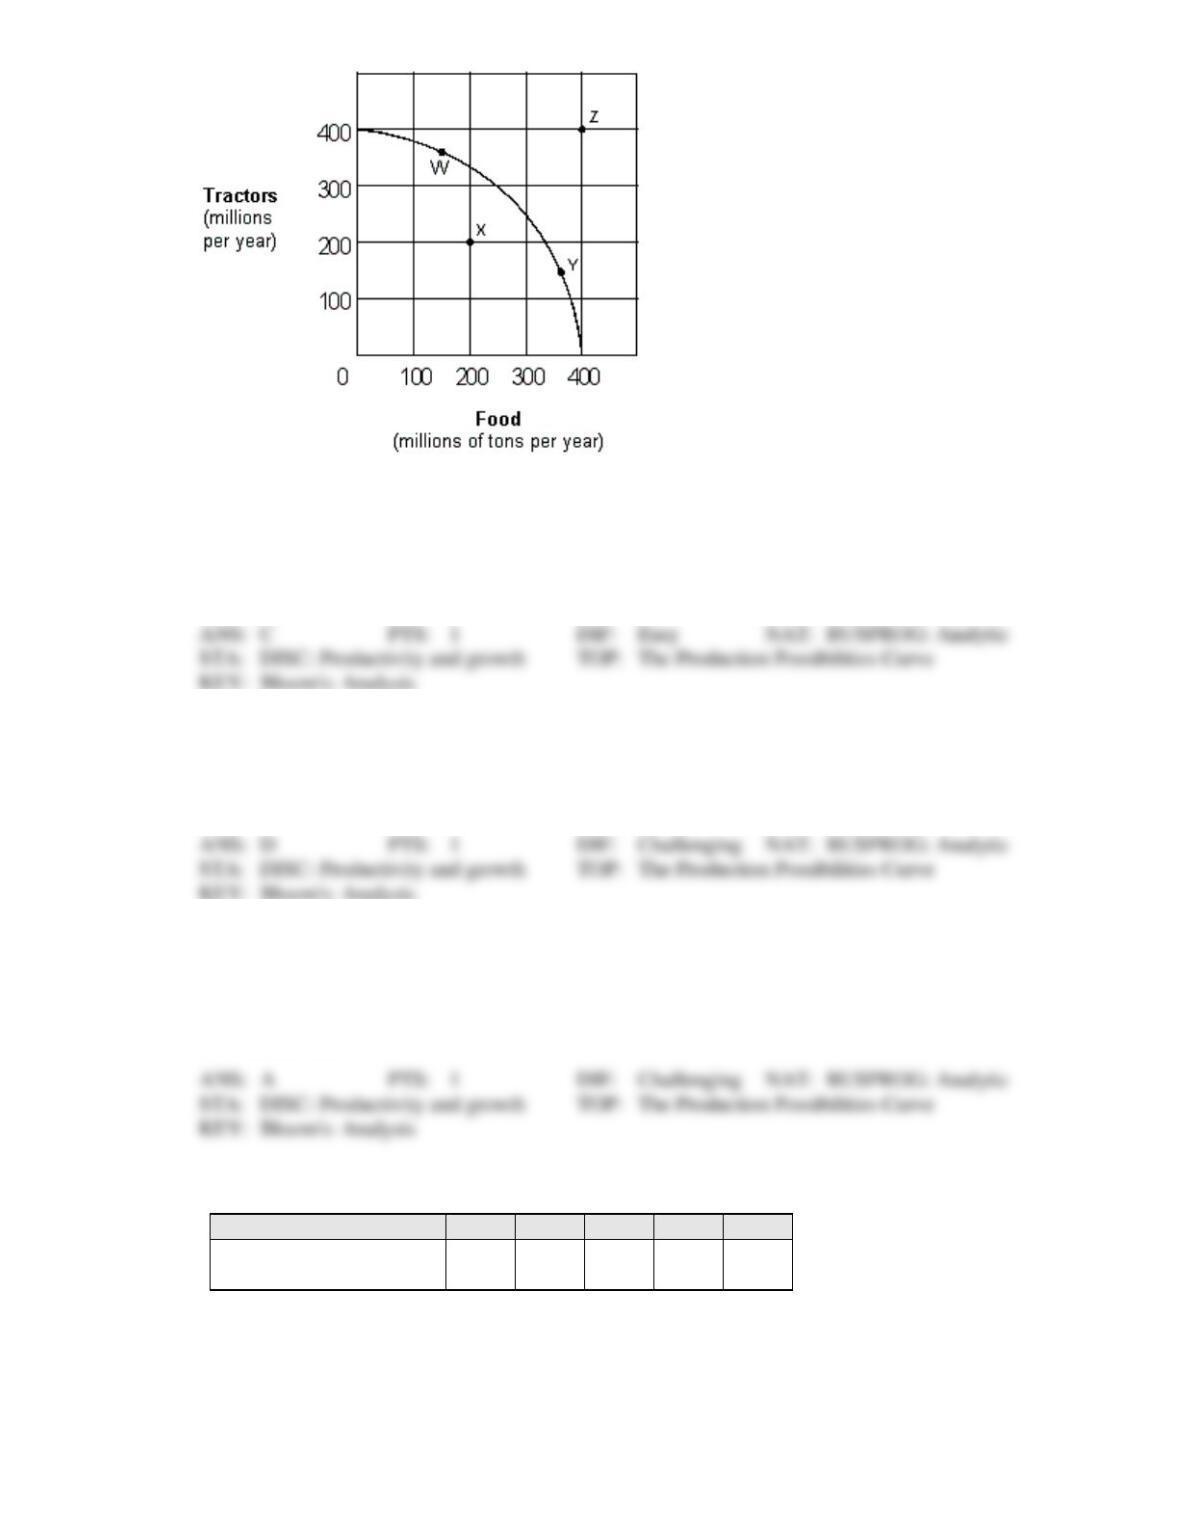
103. If the economy represented in Exhibit 2-9 is operating at Point W:
a.
no tractor product must be forgone to produce more food in the current period.
b.
resources are not fully used.
c.
some tractor production must be forgone to produce more food in the current period.
d.
increased food production would be impossible.
104. Which of the following moves from one point to another in Exhibit 2-9 would represent an increase in
economic efficiency?
a.
Z to W.
c.
W to X.
b.
W to Y.
d.
X to Y.
105. Movement along this production possibilities curve shown in Exhibit 2-9 indicates:
a.
that labor is not equally productive or homogeneous (nonhomogeneous).
b.
decreasing opportunity costs.
c.
all inputs are homogeneous.
d.
all of these.
Exhibit 2-10 Production possibilities curve data
A
B
C
D
E
Capital goods
0
1
2
3
4
Consumption goods
25
23
19
13
0
106. Suppose an economy is faced with the production possibilities table shown in Exhibit 2-10. If this
economy chooses the combination of goods at point A,
a.
only capital goods are being produced.
b.
every resource in the economy is utilized in the production of capital goods.
c.
no capital goods are being used as factors of production.
d.
every resource in the economy is being used in the production of consumption goods.
e.
no consumption goods are being produced.
107. Suppose an economy is faced with the production possibilities table shown in Exhibit 2-10. The first
unit of capital goods will cost the economy ____ units of consumption goods.
a.
25
b.
2
c.
1
d.
23
e.
11
108. Suppose an economy is faced with the production possibilities table shown in Exhibit 2-10. As
additional units of capital goods are being produced, the number of consumption goods produced must
____, because ____.
a.
increase; the production possibility table shows only the maximum efficiency points
b.
increase; of the law of increasing costs
c.
decrease; of the law of increasing costs
d.
decrease; of the finite nature of the resource base
e.
increase; capital goods will assist in the production of consumer goods
109. Suppose an economy is faced with the production possibilities table shown in Exhibit 2-10. The
second unit of capital goods production will cost ____ units of consumption goods, and the third unit
of capital goods production will cost ____ units of consumption goods.
a.
4; 6
b.
25; 23
c.
23; 19
d.
1; 23
e.
2; 19
110. Suppose an economy is faced with the production possibilities table shown in Exhibit 2-10. As
additional units of capital goods are produced, the opportunity cost in terms of sacrificed units of
consumption goods ____ because of ____.
a.
decreases; greater efficiency in production
b.
increases; decreasing opportunity cost
c.
increases; the law of increasing costs
d.
increases; greater efficiency in production
e.
decreases; the law of increasing costs
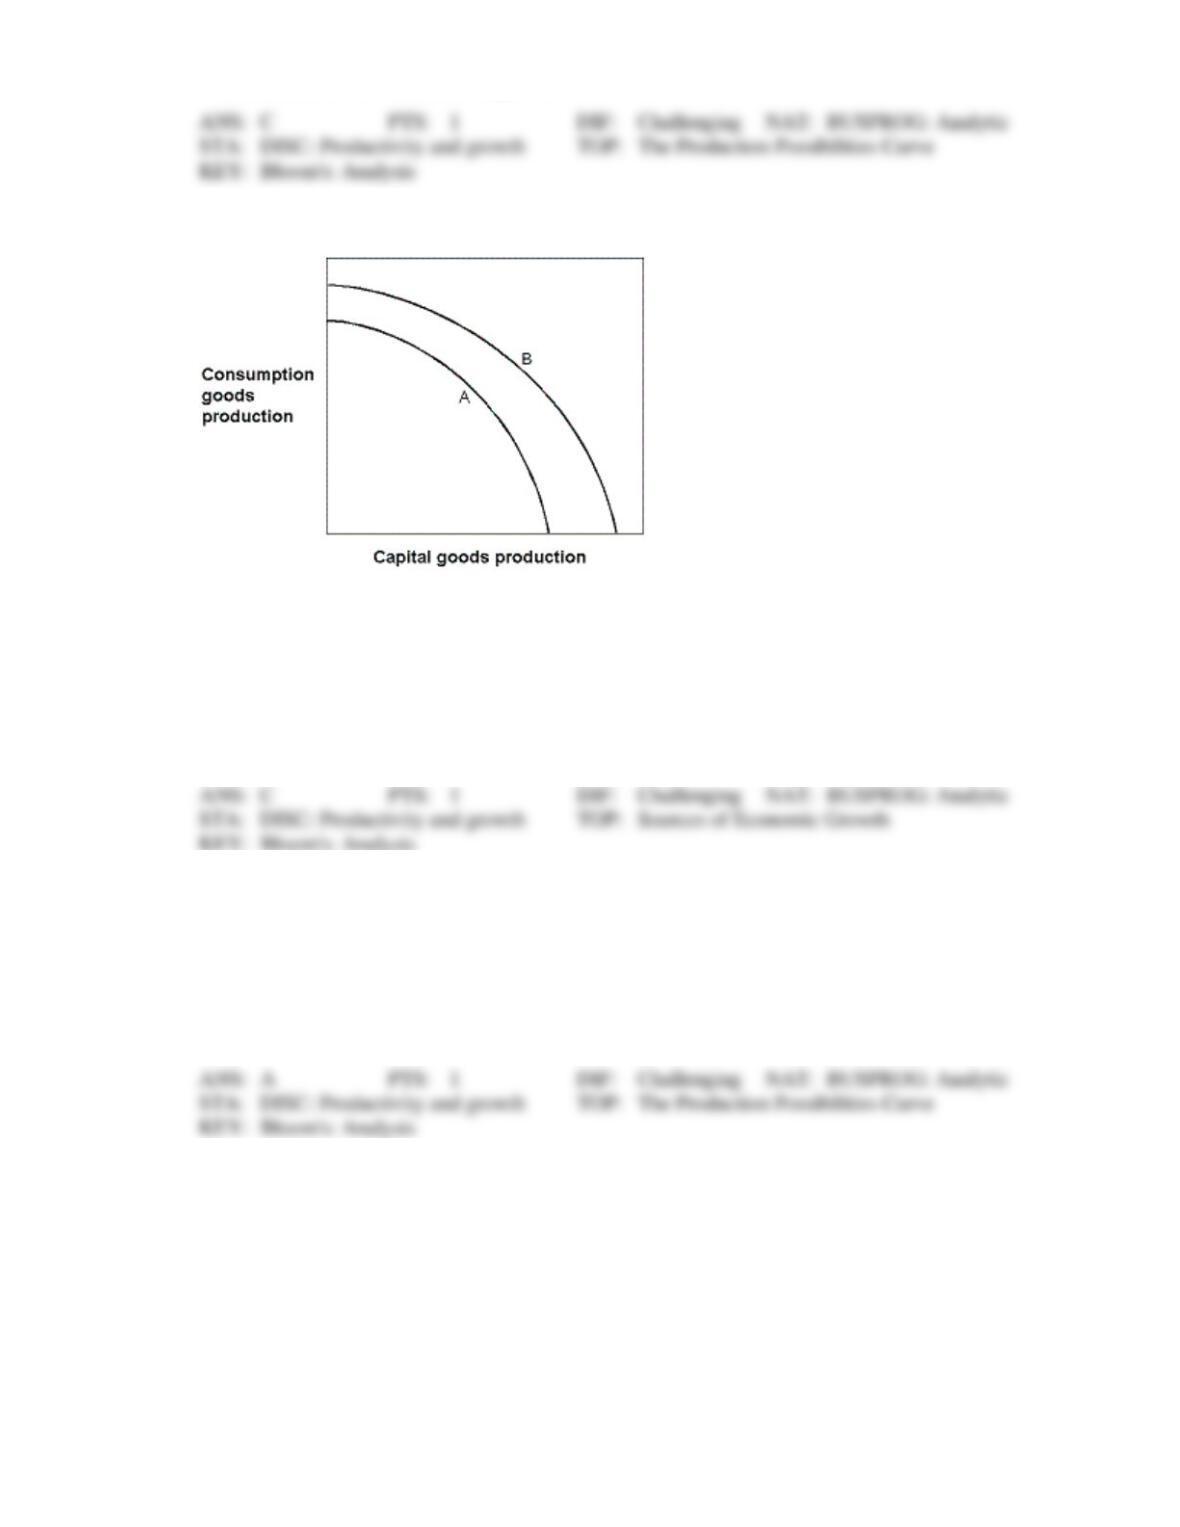
Exhibit 2-11 Production possibilities curves
111. In Exhibit 2-11, which of the following could have caused the production possibilities curve of an
economy to shift from the one labeled A to the one labeled B?
a.
A major natural disaster
b.
An increase in consumption goods production this year
c.
An advance in technology
d.
An increase in unemployment
e.
A decrease in consumption goods production this year
112. In Exhibit 2-11, which of the following could have caused the production possibilities curve to shift
from the one labeled B to the one labeled A?
a.
A major natural disaster.
b.
An increase in resources.
c.
An advance in technology.
d.
A decrease in unemployment.
e.
An improvement in literacy.
Exhibit 2-12 Production possibilities curve
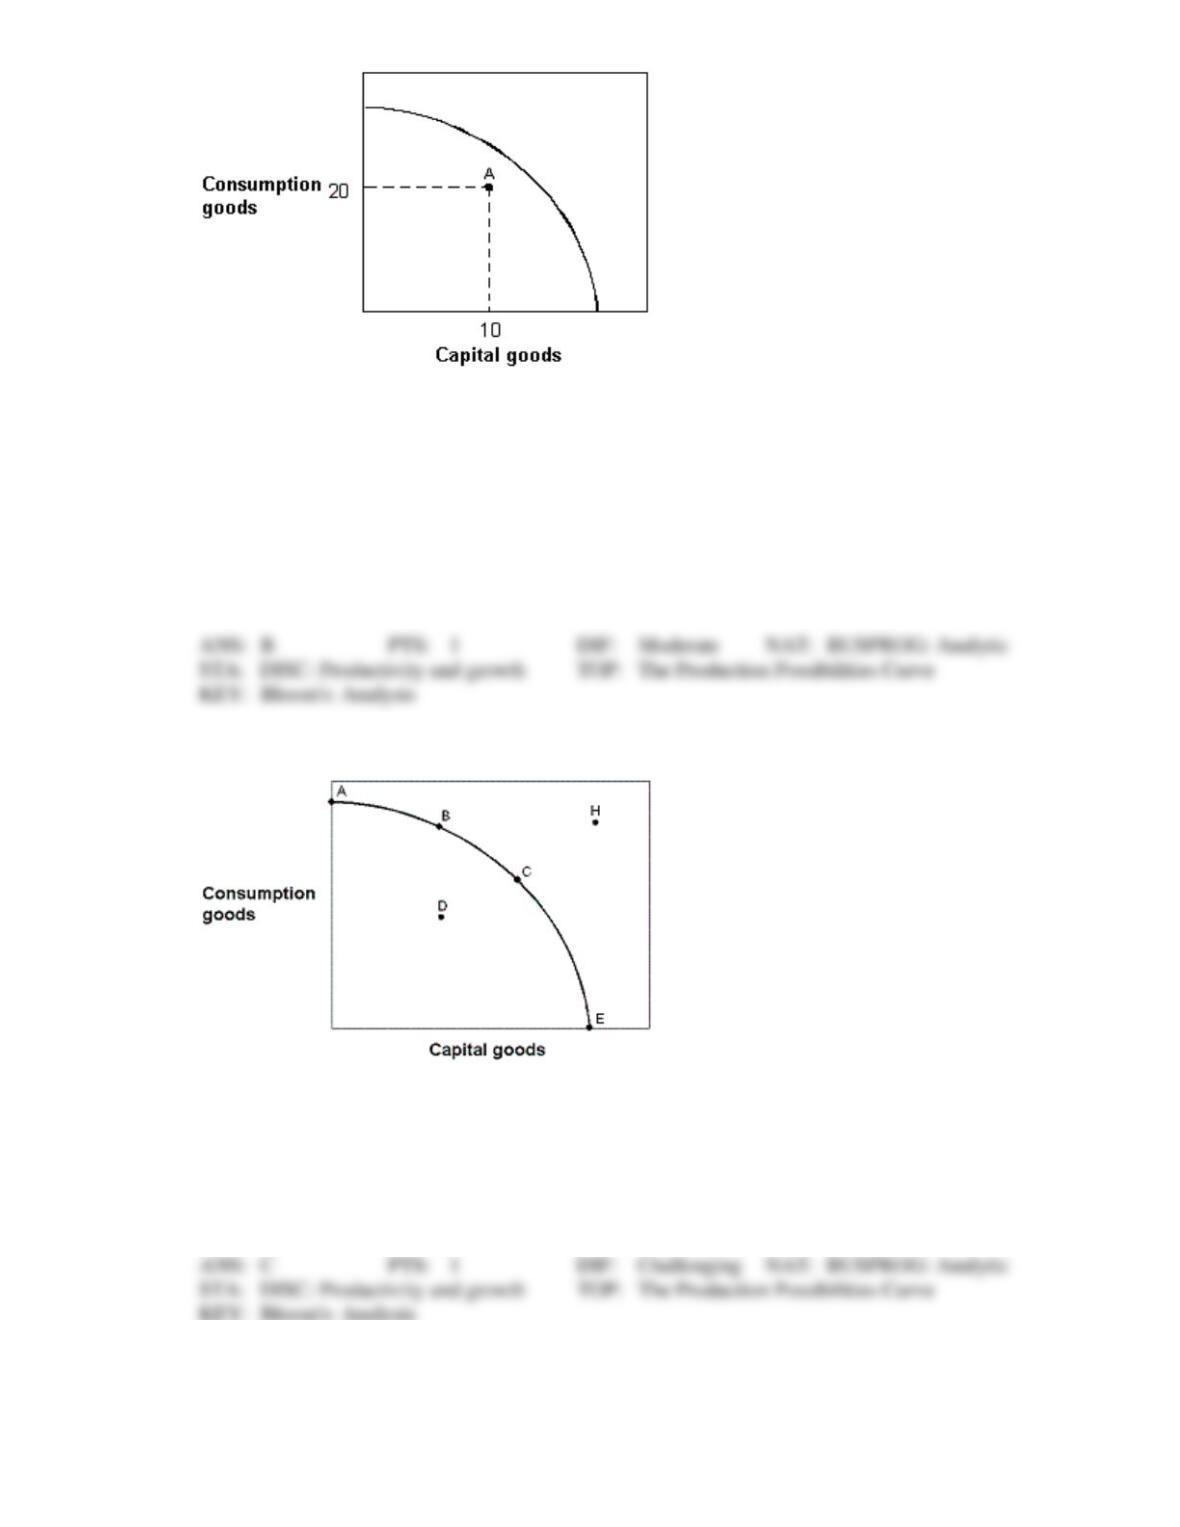
113. In Exhibit 2-12, suppose an economy with the given production possibilities curve is currently located
at point A in the figure. Which of the following statements is false?
a.
This economy could produce more of both capital and consumption goods.
b.
This economy is experiencing full employment.
c.
This economy could produce more capital goods while holding fixed the number of
consumption goods produced.
d.
This economy could produce more consumption goods while holding fixed the number of
capital goods produced.
e.
Not every resource in this economy is being utilized
Exhibit 2-13 Production possibilities curve
114. In Exhibit 2-13, in terms of efficiency:
a.
point A is preferred to point B.
b.
point A is preferred to point E.
c.
point A is preferred to point D.
d.
point B is preferred to point A.
e.
point B is preferred to point C.
115. In Exhibit 2-13, if the economy decides to locate at point E, then:
a.
this is the best choice for this economy.
b.
the maximum number of consumption goods is being produced.
c.
the economy has not achieved full employment.
d.
the economy could not survive because no food is being produced.
e.
the economy has not achieved maximum efficiency.
116. In Exhibit 2-13, the combination of goods given by point H could:
a.
never be achieved by this economy.
b.
be achieved today if the economy achieved full employment.
c.
be achieved today if the economy achieved maximum efficiency.
d.
not be achieved today.
e.
be achieved today with the proper allocation of resources.
117. In Exhibit 2-13, which of the following is not true regarding point H? Point H:
a.
cannot be achieved by this economy today.
b.
could be achieved today if the economy only achieved full employment.
c.
could be achieved in the future by an enlargement of the economy’s resource base.
d.
could be achieved in the future by an advancement in technology.
e.
could be achieved in the future by growth in the economy.
118. In Exhibit 2-13, point H is:
a.
achievable with today’s resource base.
b.
not achievable today because the economy has not achieved full employment.
c.
not achievable today because the economy is not at its maximum point of efficiency.
d.
not achievable today because of waste.
e.
not achievable today because of inadequate production capacity.
119. In Exhibit 2-13, point D:
a.
is preferred to point A.
b.
is a point of maximum production for this economy this year.
c.
is not achievable this year because of limited resources.
d.
could result from some degree of unemployment of inefficiency.
e.
is preferred to point H.
Exhibit 2-14 Production possibilities curve
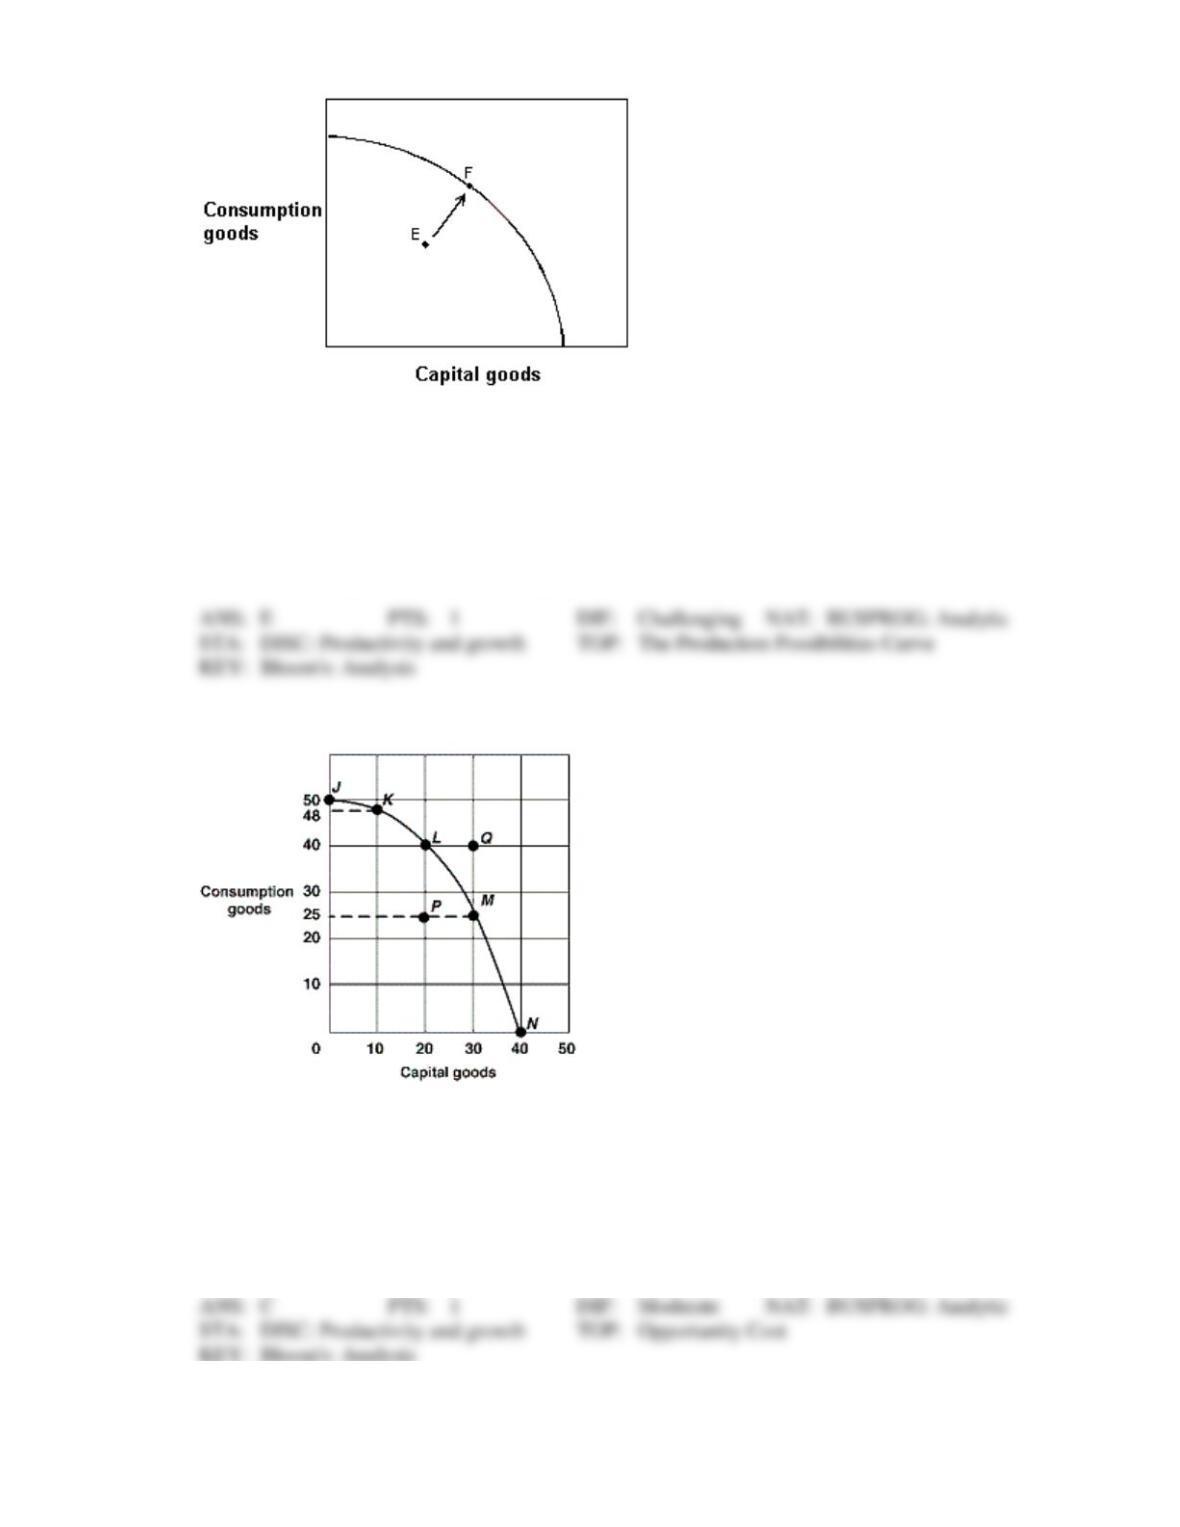
120. In Exhibit 2-14, this economy was located at point E but has now moved to point F.
a.
This would be an impossible move because the economy does not have sufficient
resources.
b.
The rate of unemployment in this economy would have increased.
c.
Consumption goods production has increased, but capital goods production has decreased.
d.
The economy has decreased unemployment, but some degree of unemployment still exists.
e.
This economy has achieved full employment.
Exhibit 2-15 Production possibilities curve
121. In Exhibit 2-15, if the economy moves from point L to point M, the opportunity cost of producing 10
more capital goods is:
a.
40 less consumer goods.
b.
25 less consumer goods.
c.
15 less consumer goods.
d.
15 more consumer goods.
e.
25 more consumer goods.
122. In Exhibit 2-15, if the economy produces no capital goods, what is the maximum number of consumer
goods that can be produced?
a.
50.
b.
48.
c.
40.
d.
25.
e.
0.
123. In Exhibit 2-15, the production possibilities curve demonstrates:
a.
changing prices.
b.
economic growth.
c.
decreases in resources.
d.
the law of increasing opportunity costs.
e.
changing technology.
124. In Exhibit 2-15, the economy will experience the most future economic growth if it chooses what point
now?
a.
J.
b.
K.
c.
M.
d.
N.
e.
P.
125. In Exhibit 2-15, inefficient resource use is shown by which of the following points?
a.
N.
b.
J.
c.
Q.
d.
L.
e.
P.
126. In Exhibit 2-15, what can we conclude about point Q?
a.
It is efficient.
b.
It is inefficient.
c.
It is unattainable.
d.
It gives maximum future growth.
e.
It shows underemployed resources.
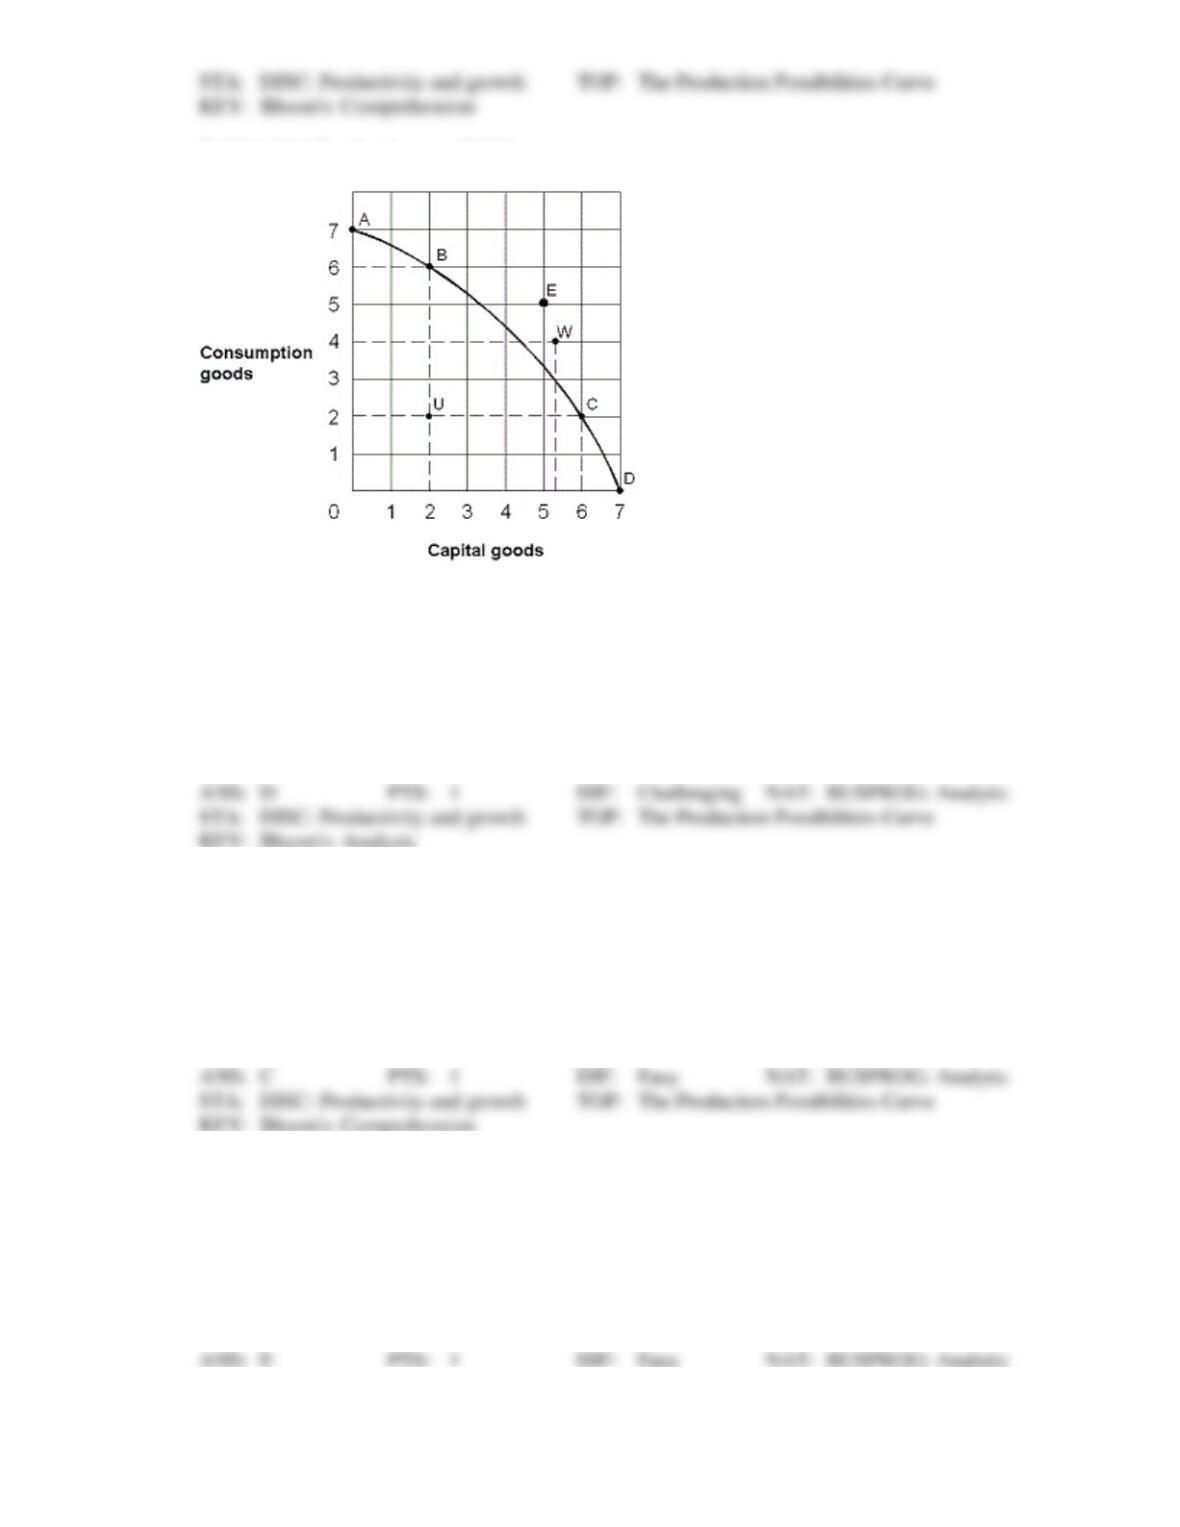
Exhibit 2-16 Production possibilities curve
127. From the information in Exhibit 2-16, which of the following points on the production possibilities
curve are attainable with the resources and technology currently available?
a.
A, B, C, E, U
b.
A, B, C, D, W
c.
E, U, W
d.
B, C, D, U
e.
A, B, C, E
128. In Exhibit 2-16, which of the following points on the production possibilities curve are unattainable
with the resources and technology currently available?
a.
A, B, C, U
b.
A, B, C, D, U
c.
E and W
d.
B, C, D, U
e.
A, B, C, D
129. In Exhibit 2-16, which of the following points on the production possibilities curve are efficient
production points?
a.
A, B, C, U
b.
A, B, C, D, U
c.
E, U, W
d.
B, C, D, U
e.
A, B, C, D
130. In Exhibit 2-16, to move from U to B, the opportunity cost:
a.
would be 4 units of consumption goods.
b.
would be 2 units of capital goods.
c.
would be zero.
d.
would be 5 units of capital goods.
e.
cannot be estimated.
131. In Exhibit 2-16, which of the following points on the production possibilities curve are full–
employment production points?
a.
A, B, C, D
b.
A, B, C, D, U
c.
E, U, W
d.
B, C, D, U
e.
A, B, C, U
132. Suppose that an economy can produce various combinations of fish and bread. If more people with
strong fishing skills became employed in this economy, how would the production possibilities curve
(PPC) change?
a.
The PPC would shift outward on the fish axis, but would not change on the bread axis.
b.
The PPC would shift outward equally along both the fish and the bread axes.
c.
The PPC would shift inward on the bread axis, but would not change on the fish axis.
d.
The PPC would shift inward equally along both the fish and the bread axes.
133. Over time, an increase in a nation’s stock of physical capital will:
a.
shift the production possibilities curve inward.
b.
cause an economy to operate inside its production possibilities curve.
c.
shift the production possibilities curve outward.
d.
eliminate the basic economic problem of scarcity.
134. The ability of an economy to produce greater levels of output in the same period of time is called:
a.
positive economics.
b.
negative economics.
c.
economic growth.
d.
marginal productivity.
135. Which of the following would not lead to a shift in an economy’s production possibilities curve?
a.
Change in technology.
b.
Change in the number of resources.
c.
An earthquake.
d.
Improvement in the education level.
e.
Change in the composition of current output.
136. Adding more resources causes:
a.
downward movement along a production possibilities curve.
b.
the production possibilities curve to shift in.
c.
upward movement along a production possibilities curve.
d.
the production possibilities curve to shift out.
e.
the production possibilities curve to become positively sloped.
137. If an economy keeps increasing its capital stock, then over time its production possibilities curve will:
a.
not move.
b.
shift to the left.
c.
shift to the right.
d.
disappear because scarcity ceases to exist.
e.
demonstrate massive job loss for workers.
138. Compare two economies A and B that start out with identical production possibilities curves. Economy
A chooses an efficient point with 6 consumption goods and 3 capital goods, while economy B also
chooses an efficient point, but with 4 consumption goods and 5 capital goods. In the future we can
predict:
a.
economy A will operate inefficiently.
b.
economy B will operate inefficiently.
c.
economy A and economy B will grow equally fast.
d.
economy A will grow faster than economy B.
e.
economy B will grow faster than economy A.
139. An analysis of production possibilities curves indicates that the reason why underdeveloped nations
have difficulties increasing their economic growth rates is because:
a.
low population growth rates mean fewer workers to produce food and other necessities.
b.
their production possibilities curves shift in when resources are increased.