Managerial Decision Modeling w/ Spreadsheets, 3e (Balakrishnan/Render/Stair)
Chapter 2 Linear Programming Models: Graphical and Computer Methods
2.1 Chapter Questions
1) Consider the following linear programming model:
Max X12 + X2 + 3X3
Subject to:
X1 + X2 ≤ 3
X1 + X2 ≤ 1
X1, X2 ≥ 0
This problem violates which of the following assumptions?
A) certainty
B) proportionality
C) divisibility
D) linearity
E) integrality
2) Consider the following linear programming model:
Min 2X1 + 3X2
Subject to:
X1 + 2X2 ≤ 1
X2 ≤ 1
X1 ≥ 0, X2 ≤ 0
This problem violates which of the following assumptions?
A) additivity
B) divisibility
C) non-negativity
D) proportionality
E) linearity
3) A redundant constraint is eliminated from a linear programming model. What effect will this have on
the optimal solution?
A) feasible region will decrease in size
B) feasible region will increase in size
C) a decrease in objective function value
D) an increase in objective function value
E) no change
4) Consider the following linear programming model:
Max 2X1 + 3X2
Subject to:
X1 ≤ 2
X2 ≤ 3
X1 ≤ 1
X1, X2 ≥ 0
This linear programming model has:
A) alternate optimal solutions
B) unbounded solution
C) redundant constraint
D) infeasible solution
E) non-negative solution
5) A linear programming model generates an optimal solution with fractional values. This solution
satisfies which basic linear programming assumption?
A) certainty
B) divisibility
C) proportionality
D) linearity
E) non-negativity
6) Consider the following linear programming model:
Max X1 + X2
Subject to:
X1 + X2 ≤ 2
X1 ≥ 1
X2 ≥ 3
X1, X2 ≥ 0
This linear programming model has:
A) alternate optimal solution
B) unbounded solution
C) redundant constraint
D) infeasible solution
E) unique solution
7) Consider the following linear programming model
Max 2X1 + 3X2
Subject to:
X1 + X2
X1 ≥ 2
X1, X2 0
This linear programming model has:
A) redundant constraints
B) infeasible solution
C) alternate optimal solution
D) unique solution
E) unbounded solution
4
8) Consider the following linear programming model
Min 2X1 + 3X2
Subject to:
X1 + X2 ≥ 4
X1 ≥ 2
X1, X2 0
This linear programming model has:
A) unique optimal solution
B) unbounded solution
C) infeasible solution
D) alternate optimal solution
E) redundant constraints
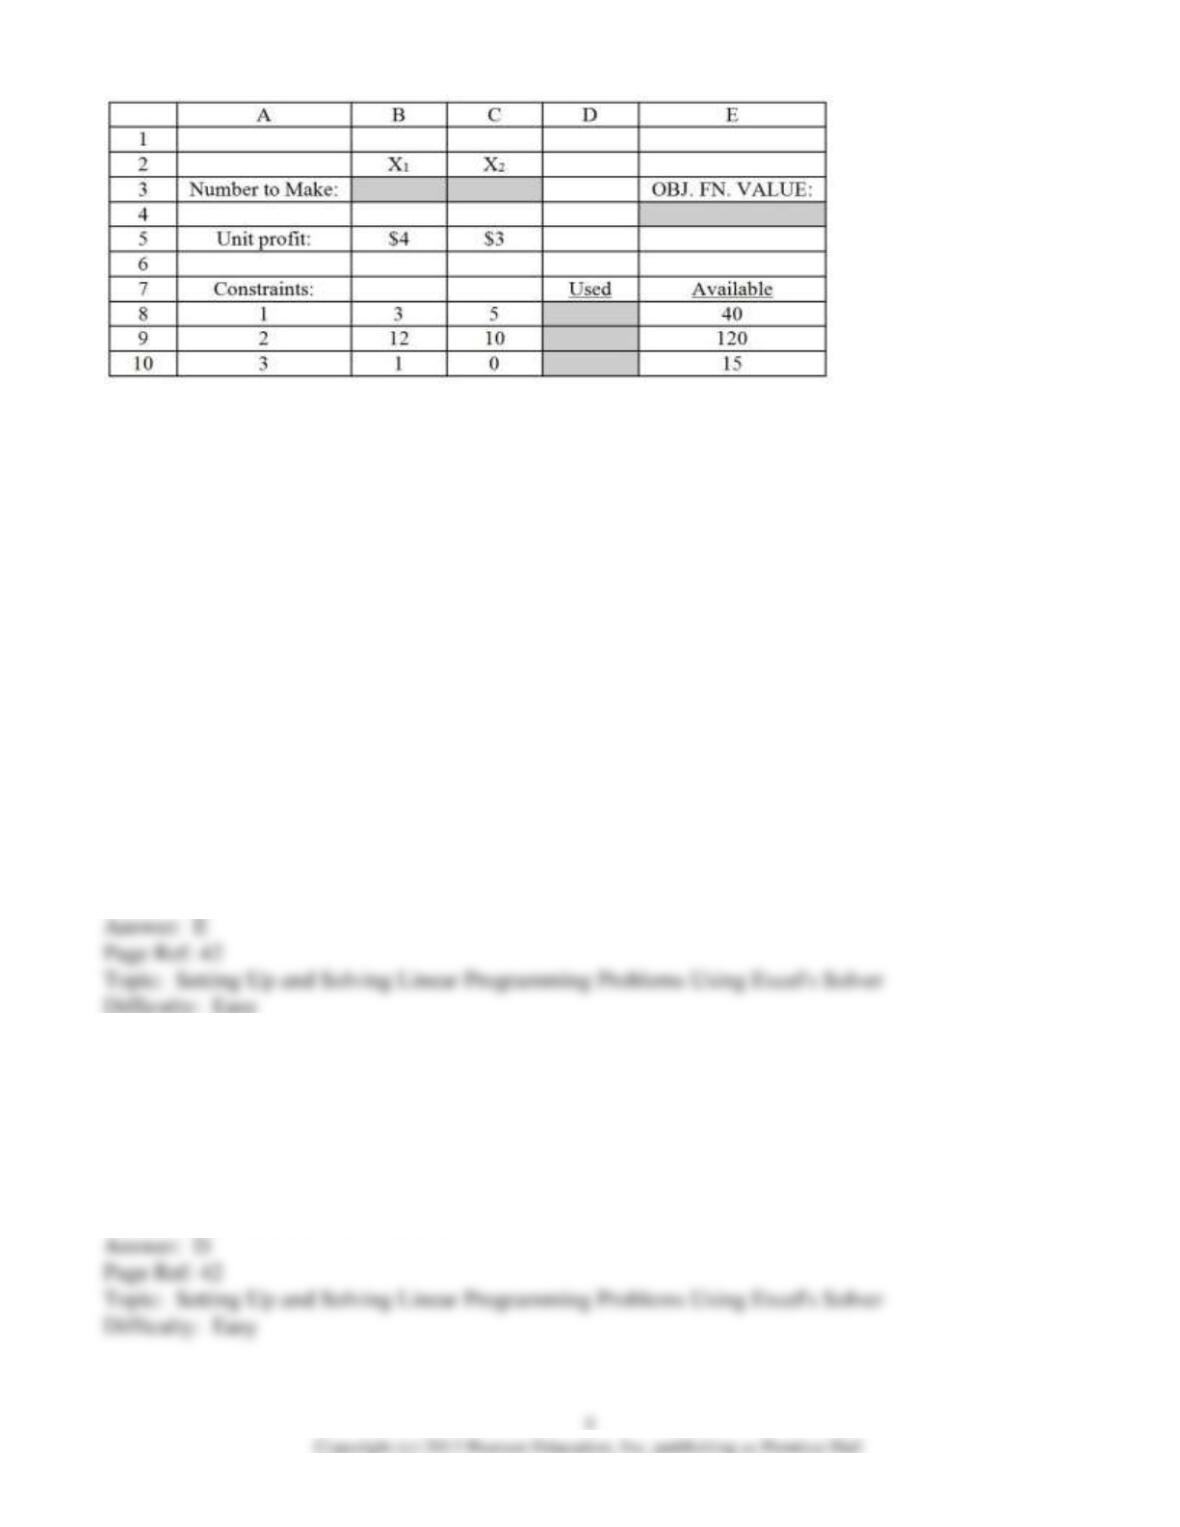
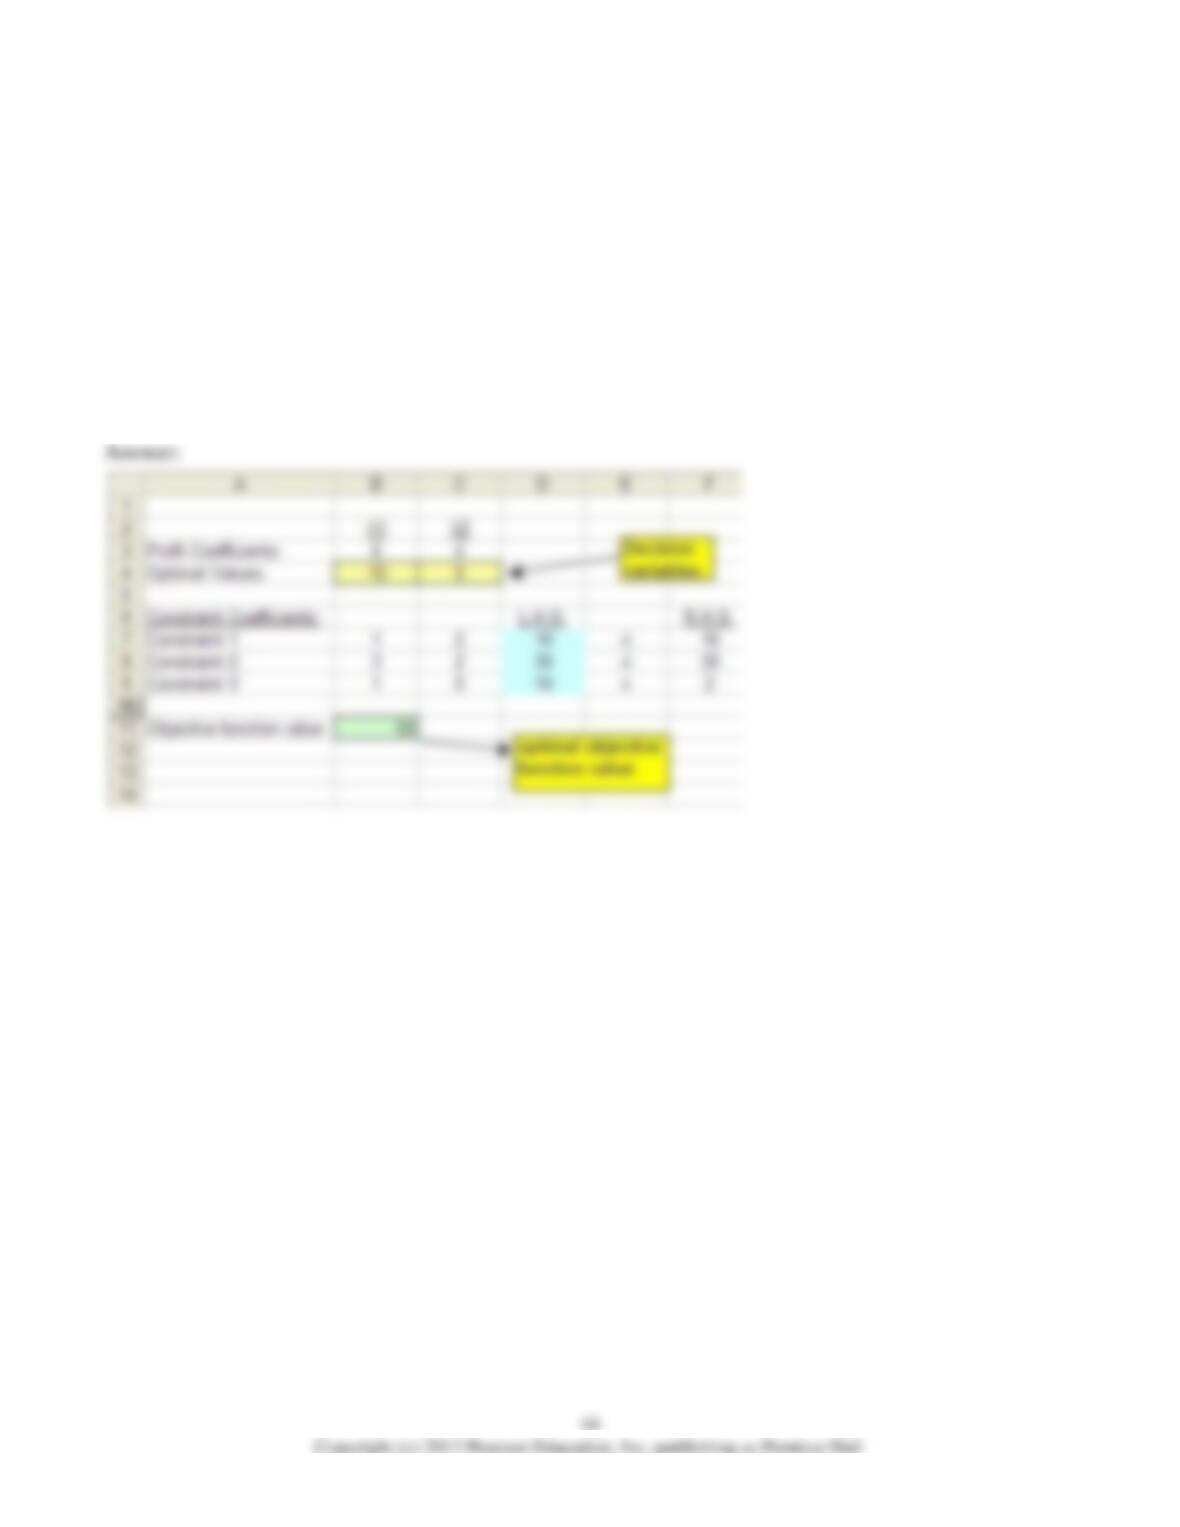
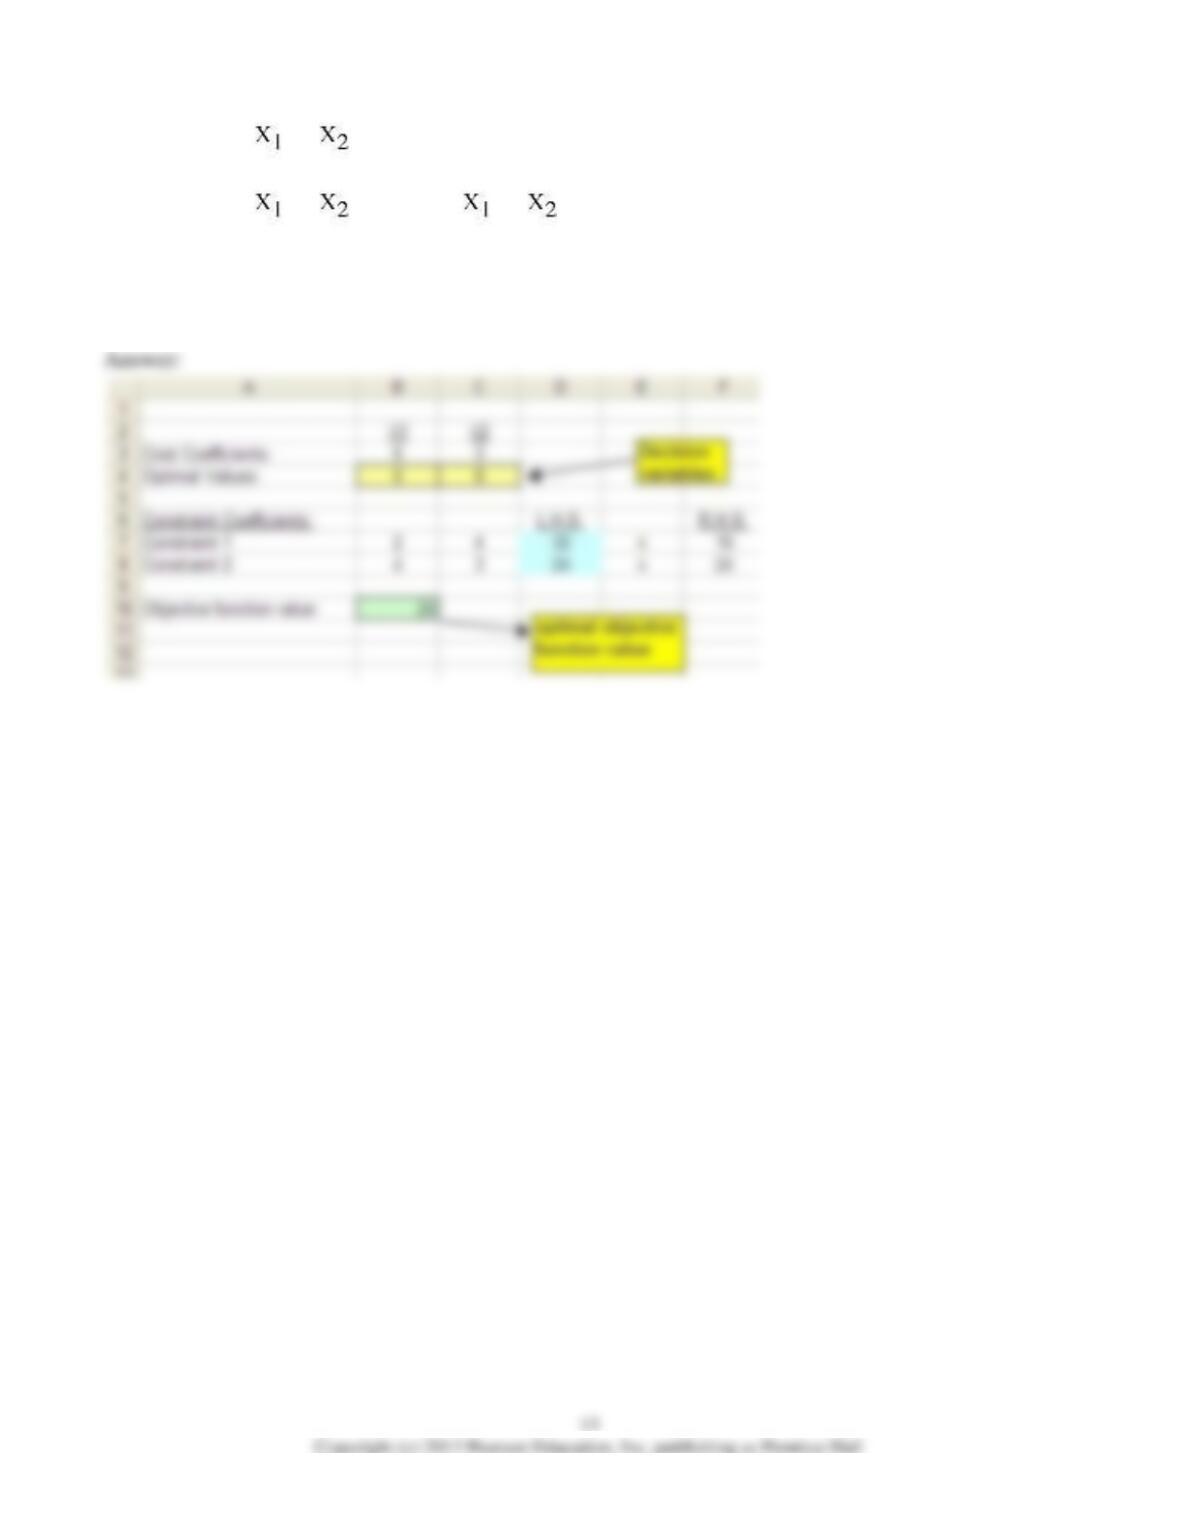
Figure 1:
Figure 1 demonstrates an Excel spreadsheet that is used to model the following linear programming
problem:
Max: 4 X1 + 3 X2
Subject to:
3 X1 +5 X2 ≤ 40
12 X1 + 10 X2 ≤ 120
X1 ≥ 15
X1, X2 ≥ 0
Note: Cells B3 and C3 are the designated cells for the optimal values of X1 and X2, respectively, while
cell E4 is the designated cell for the objective function value. Cells D8:D10 designate the left-hand side
of the constraints.
9) Refer to Figure 1. What formula should be entered in cell E4 to compute total profitability?
A) =SUMPRODUCT(B5:C5,B2:C2)
B) =SUM(B3:C3)
C) =B2*B5 + C2*C5
D) =SUMPRODUCT(B5:C5,E8:E10)
E) =B3*B5 + C3*C5
10) Refer to Figure 1. What formula should be entered in cell D9 to compute the amount of resource 2
that is consumed?
A) =B9*D9 + C9*D9
B) =SUMPRODUCT(B2:C2,B9:C9)
C) =SUM(B9:C9)
D) =SUMPRODUCT(B3:C3,B9:C9)
E) =SUMPRODUCT(B9:C9,B5:C5)
11) Refer to Figure 1. Which cell(s) are the Changing Cells as designated by “Solver”?
A) E4
B) B2:C2
C) B3:C3
D) D8:D10
E) B5:C5
12) Refer to Figure 1. What cell reference designates the Target Cell in “Solver”?
A) E4
B) B3
C) C3
D) D8:D10
E) E8:E10
13) The constraint for a given resource is given by the following equation:
2X1 + 3X2 ≤ 20
If X1 = 5 and X2 = 3, how many units of this resource are unused?
A) 20
B) 19
C) 1
D) 0
E) 17
14) The constraint for a given resource is given by the following equation:
2X1 + 3X2 ≥ 20
If X1 = 5 and X2 = 4 how many units of this resource are unused?
A) 20
B) 2
C) 22
D) 0
E) 9
15) “Solver” typically generates which of the following report(s)?
A) answer report
B) sensitivity analysis report
C) limits report
D) A and B only
E) A, B, and C
16) ________ systematically examines corner points, using algebraic steps, until an optimal solution is
found.
A) The graphical approach
B) The simplex method
C) Karmarkar’s method
D) Trial-and-error
E) none of the above
17) ________ follows a path of points inside the feasible region to find an optimal solution.
A) The graphical approach
B) The simplex method
C) Karmarkar’s method
D) Trial-and-error
E) none of the above
18) If a linear programming problem has alternate optimal solutions, then the objective function value
will vary according to each alternate optimal point.
19) Unbounded linear programming problems typically arise as a result of misformulation.
20) If an isoprofit line can be moved outward such that the objective function value can be made to
reach infinity, then this problem has an unbounded solution.
21) If a redundant constraint is eliminated from a linear programming model, this will have an impact on
the optimal solution.
22) A linear programming model has the following two constraints: X1 ≥ 3 and X1 ≥ 4. This model has
a redundant constraint.
23) A linear programming problem has the following two constraints: X1 ≤ 20 and X1 ≥ 25. This
problem is infeasible.
24) It is possible to solve graphically a linear programming model with 4 decision variables.
25) An isoprofit line represents a line whereby all profits are the same along the line.
26) Linear programming models typically do not have coefficients (i.e., objective function or constraint
coefficients) that assume random values.
9
27) It is possible for a linear programming model to yield an optimal solution that has fractional values.
28) A linear programming model has the following objective function:
Max: X12 + 3X2 + 4X3. This model violates a key linear programming model assumption.
29) In a product mix problem, a decision maker has limited availability of weekly labor hours. Labor
hours would most likely constitute a decision variable rather than a constraint.
30) When using Solver, the parameter Changing Cells is typically associated with the objective function.
31) The simplex method is an algebraic solution procedure for a linear programming problem.
32) Karmarkar’s method is synonymous with the corner point method.
2.2 Excel Problems
1) Consider the following linear programming problem.
Maximize 6X1 + 4X2
Subject to:
X1 + 2X2 ≤ 16
3X1 + 2X2 ≤ 24
X1 ≥ 2
X1, X2 ≥ 0
Use Solver to find the optimal values of X1 and X2.
2) Consider the following linear programming problem.
Maximize 5X1 + 3X2
Subject to: X1 + X2 ≤ 20
X1 ≥ 5
X2 ≤ 10
X1, X2 ≥ 0
Use Solver to find the optimal values of X1 and X2.
3) Consider the following linear programming problem.
Minimize 3X1 + 2X2
Subject to: X1 + X2 ≥ 10
X1 + X2 ≤ 20
X2 ≤ 10
X1 ≤ 18
X1, X2 ≥ 0
Use Solver to find the optimal values of X1 and X2.
4) Consider the following linear programming problem.
Minimize 6 + 3 2
Subject to:
2 + 4 ≥ 16 4 + 3 ≥ 24
X1, X2 ≥ 0
Use Solver to find the optimal values of X1 and X2.