Thinking Like an Economist 383
2.
Which of the following is not an example of a graph of a single variable?
a.
a pie chart
b.
a bar graph
c.
a time-series graph
d.
a scatterplot
3.
Graphs such as bar graphs and pie charts are limited in that they
a.
can only show variables that are positively related.
b.
can only show variables that have a negative correlation.
c.
provide information on only one variable.
d.
provide information on no more than two variables.
4.
Eva wants to create a graph containing the prices of concert tickets and the corresponding quantities
of concert
tickets demanded by customers. She should use a(n)
a.
pie chart.
b.
bar graph.
c.
time-series graph
d.
coordinate system.
5.
The use of the coordinate system allows
a.
for the display of the flows of dollars, goods and services, and factors of production in an
economic system.
b.
for the display of how labor and other resources are organized in the production process.
c.
for the display of two variables on a single graph.
d.
for the creation of pie charts and bar graphs.
6.
To display information on two variables, an economist must use
a.
a bar graph.
b.
a pie chart.
c.
the coordinate system.
d.
a time-series graph.
7.
Which of the following allows you to provide information about the relationship between two
variables?
a.
coordinate system.
b.
pie chart
c.
bar graph
d.
time-series graph
8.
An ordered pair is
a.
the process of checking calculations twice before placing them on a graph.
b.
two numbers that can be represented by a single point on a graph.
c.
two numbers that are represented by two points on a graph.
d.
two points on a graph that are of equal distance from the origin.
9.
The x-coordinate is the
a.
first number of an ordered pair and represents the point‘s horizontal location.
b.
second number of an ordered pair and represents the point’s horizontal location.
c.
first number of an ordered pair and represents the point’s vertical location.
d.
second number of an ordered pair and represents the point‘s vertical location.
10.
The x-coordinate of an ordered pair specifies the
a.
diagonal location of the point.
b.
vertical location of the point.
c.
horizontal location of the point.
d.
quadrant location in which the point is located.
11.
The first number in any ordered pair is
a.
the x-coordinate.
b.
the y-coordinate.
c.
the vertical location of the point.
d.
the slope.
12.
The y-coordinate is the
a.
first number of an ordered pair and represents the point’s horizontal location.
b.
second number of an ordered pair and represents the point’s horizontal location.
c.
first number of an ordered pair and represents the point’s vertical location.
d.
second number of an ordered pair and represents the point‘s vertical location.
13.
The y-coordinate of an ordered pair specifies the
a.
diagonal location of the point.
b.
vertical location of the point.
c.
horizontal location of the point.
d.
quadrant location in which the point is located.
14.
The second number in any ordered pair is
a.
the x-coordinate.
b.
the y-coordinate.
c.
the horizontal location of the point.
d.
the slope.
15.
In the ordered pair (20, 30), 20 is the
a.
the x-coordinate.
b.
the horizontal location of the point.
c.
the y-coordinate.
d.
Both a and b are correct.
16.
In the ordered pair (5, 3), 3 is the
a.
horizontal location of the point.
b.
the slope.
c.
the x-coordinate.
d.
the y-coordinate.
17.
The point where both x and y are zero is known as the
a.
origin.
b.
null.
c.
zero coordinate.
d.
center.
18.
The ordered pair that represents the origin on a graph is
a. (1, 1).
b. (0, 0).
c. (-1, -1).
d. (∞, ∞).
19.
When two variables have a positive correlation,
a.
they tend to move in opposite directions.
b.
they tend to move in the same direction.
c.
one variable will move while the other remains constant.
d.
the variables’ values are never negative.
20.
When two variables have a positive correlation,
a.
when the x-variable increases, the y-variable decreases.
b.
when the x-variable decreases, the y-variable increases.
c.
when the x-variable increases, the y-variable increases.
d.
More than one of the above is correct.
21.
When two variables have a negative correlation,
a.
they tend to move in opposite directions.
b.
they tend to move in the same direction.
c.
one variable will move while the other remains constant.
d.
the variables’ values are never positive.
22.
When two variables have a negative correlation,
a.
when the x-variable decreases, the y-variable decreases.
b.
when the x-variable decreases, the y-variable increases.
c.
when the x-variable increases, the y-variable increases.
d.
More than one of the above is correct.
23.
When two variables have a negative correlation and the x-variable decreases,
a.
the y-variable increases.
b.
the y-variable decreases.
c.
the y-variable stays the same.
d.
the x-variable can never be positive.
Figure 2–16
24.
Refer to Figure 2-16. The graph shown is known as a
a.
time-series graph.
b.
bar graph.
c.
scatterplot.
d.
pie chart.
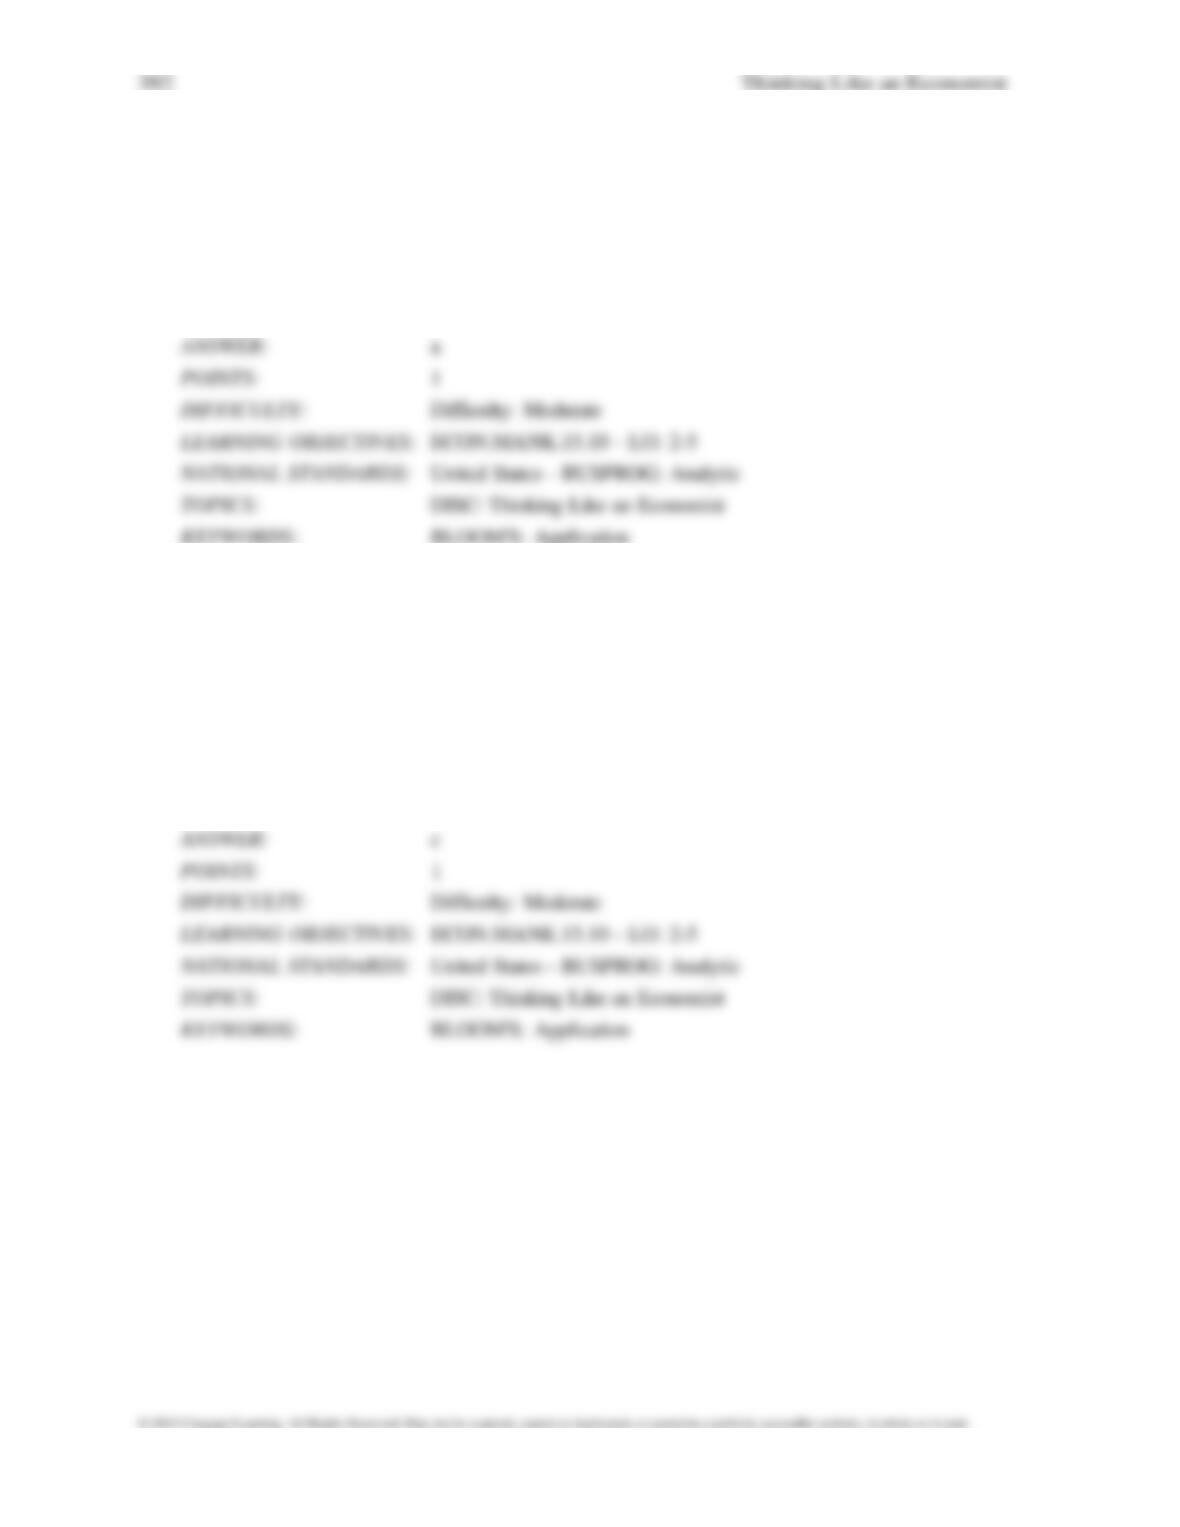
25.
Refer to Figure 2-16. Cups of coffee per day and the hours that someone can go without sleep
appear to have
a.
a positive correlation.
b.
a negative correlation.
c.
a random correlation.
d.
no correlation.
26.
Refer to Figure 2-16. Taking cause and effect into account, which of the following
interpretations would be most
reasonable regarding the relationship between coffee and hours
without sleep?
a.
The less coffee a person drinks per day, the more time he can go without sleep.
b.
There is no relationship between how much coffee per day a person drinks and how long he can
go without
sleep.
c.
The more coffee a person drinks per day, the more time he can go without sleep.
d.
The more coffee a person drinks per day, the less time he can go without sleep.
27.
When two variables move in opposite directions, the curve relating them is
a.
upward sloping, and we say the variables are positively related.
b.
upward sloping, and we say the variables are negatively related.
c.
downward sloping, and we say the variables are positively related.
d.
downward sloping, and we say the variables are negatively related.
28.
When two variables move in the same direction, the curve relating them is
a.
upward sloping, and we say the variables are positively related.
b.
upward sloping, and we say the variables are negatively related.
c.
downward sloping, and we say the variables are positively related.
d.
downward sloping, and we say the variables are negatively related.
29.
When a relevant variable that is not named on either axis changes,
a.
there will be a movement along the curve.
b.
the curve will rotate clockwise.
c.
the curve will be unaffected since only the variables on the axis affect the curve.
d.
the curve will shift.
30.
Suppose price is measured along the vertical axis on a graph. When price changes, there will be a
a.
rotation of the curve.
b.
shift of the curve.
c.
movement along the curve.
d.
change in the slope of the curve.
31.
A demand curve shows the relationship
a.
between income and quantity demanded.
b.
between price and income.
c.
between price and quantity demanded.
d.
among income, price, and quantity demanded.
Thinking Like an Economist 395
32.
A demand curve shows the relationship between price and
a.
income.
b.
quantity demanded.
c.
production.
d.
income and quantity demanded.
33.
A demand curve displaying the relationship between the price of cars and the quantity demanded
of cars should have
a slope that is
a.
less than 0.
b.
between zero and 1.
c.
between one and infinity.
d.
undefined.
34.
Which of the following is not held constant when looking at an individual’s demand curve?
a.
income
b.
price
c.
preferences
d.
the availability of alternative goods
35.
If Martina’s income increases and, as a result, she chooses to buy more lattés per month at each
price, then her demand curve will
a.
shift to the right.
b.
shift to the left.
c.
not shift; instead, Martina will move along her demand curve downward and to the right.
d.
not shift; instead, Martina will move along her demand curve upward and to the left.
Thinking Like an Economist 397
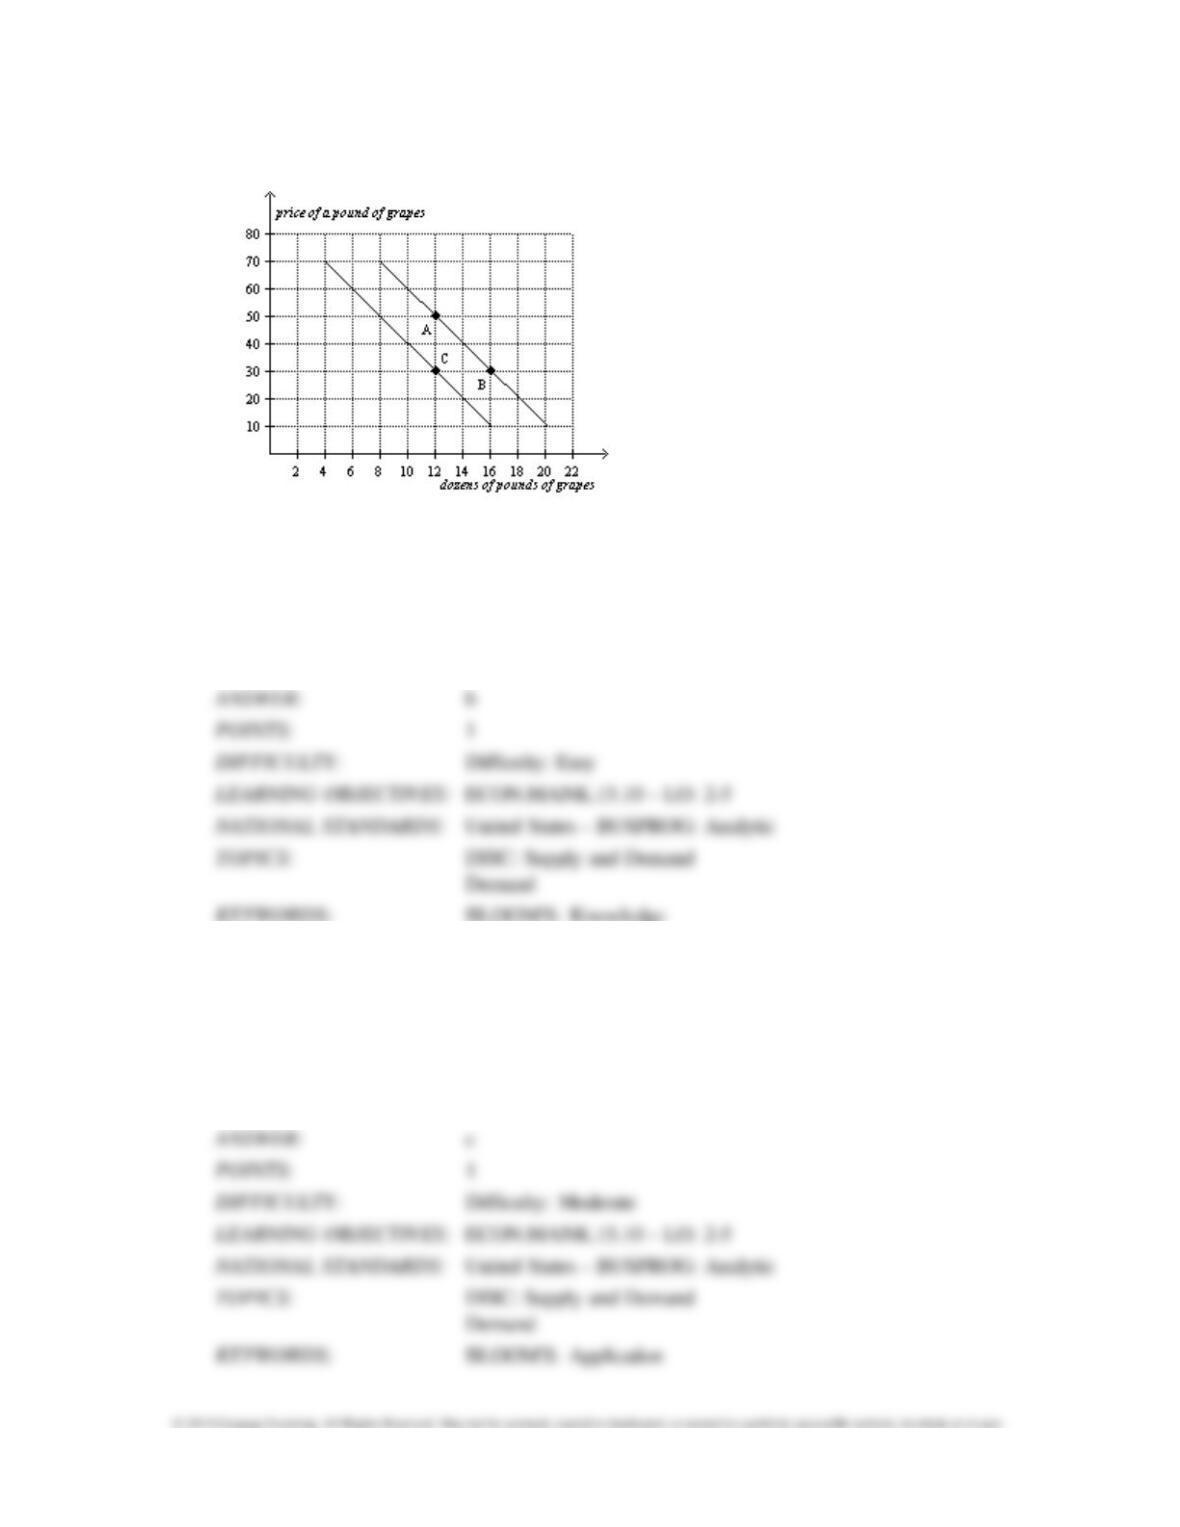
Figure 2–17
36.
Refer to Figure 2-17. The curves shown are
a.
supply curves.
b.
demand curves.
c.
preference curves.
d.
income-consumption curves.
37.
Refer to Figure 2-17. The movement from point A to point B is a(n)
a.
shift of the demand curve.
b.
indication of a change in preferences for grapes.
c.
movement along the demand curve.
d.
indication of an increase in income.
38.
Refer to Figure 2-17. The movement from point B to point C is a(n)
a.
shift of the demand curve.
b.
movement along the demand curve.
c.
indication that the price of grapes has changed.
d.
indication that the costs incurred by firms that produce grapes have changed.
39.
Refer to Figure 2-17. The movement from point B to point C could have been caused by
a.
inflation.
b.
a change in income.
c.
a change in the price of grapes.
d.
a change in the cost of producing grapes.
40.
Refer to Figure 2-17. The slope of the curve between points A and B is
a.
–5
b.
–1/5
c.
1/5
d.
5
41.
The slope of a line is equal to
a.
the change in the value of x divided by the change in the value of y.
b.
the change in the value of y divided by the change in the value of x.
c.
the horizontal distance divided by the vertical distance.
d.
the value of y divided by the value of x.
42.
The slope of a line is equal to
a.
rise divided by run.
b.
run divided by rise.
c.
rise minus run.
d.
rise plus run.
43.
Which of the following is not correct?
a.
The slope of a line will be a small positive number for a fairly flat upward-sloping line.
b.
The slope of a line will be a large positive number for a steep upward-sloping line.
c.
The slope of a line will be a negative number for a downward-sloping line.
d.
The slope of a line will be infinite for a horizontal line.
44.
Which of the following is correct?
a.
A horizontal line has an infinite slope, and a vertical line has a zero slope.
b.
A horizontal line has a slope of 1, and a vertical line has a slope of –1.
c.
A horizontal line has a zero slope, and a vertical line has an infinite slope.
d.
A horizontal line has a slope of -1, and a vertical line has a slope of 1.
45.
The slope of a fairly flat upward-sloping line will be a
a.
small positive number.
b.
large positive number.
c.
small negative number.
d.
large negative number.
46.
The slope of a steep upward-sloping line will be a
a.
small positive number.
b.
large positive number.
c.
small negative number.
d.
large negative number.
47.
The slope of a line that passes through the points (20, 30) and (40, 14) is
a. -5/4.
b. -4/5.
c. 4/5.
d. 5/4.
48.
The slope of a line that passes through the points (5, 8) and (12, 12) is
a. -7/4.
b. -4/7.
c. 4/7.
d. 7/4.
49.
The slope of a line passing through the points (15, 3) and (10, 6) is
a. -3/5.
b. 3/5.
c. -5/3.
d. 5/3.