161)
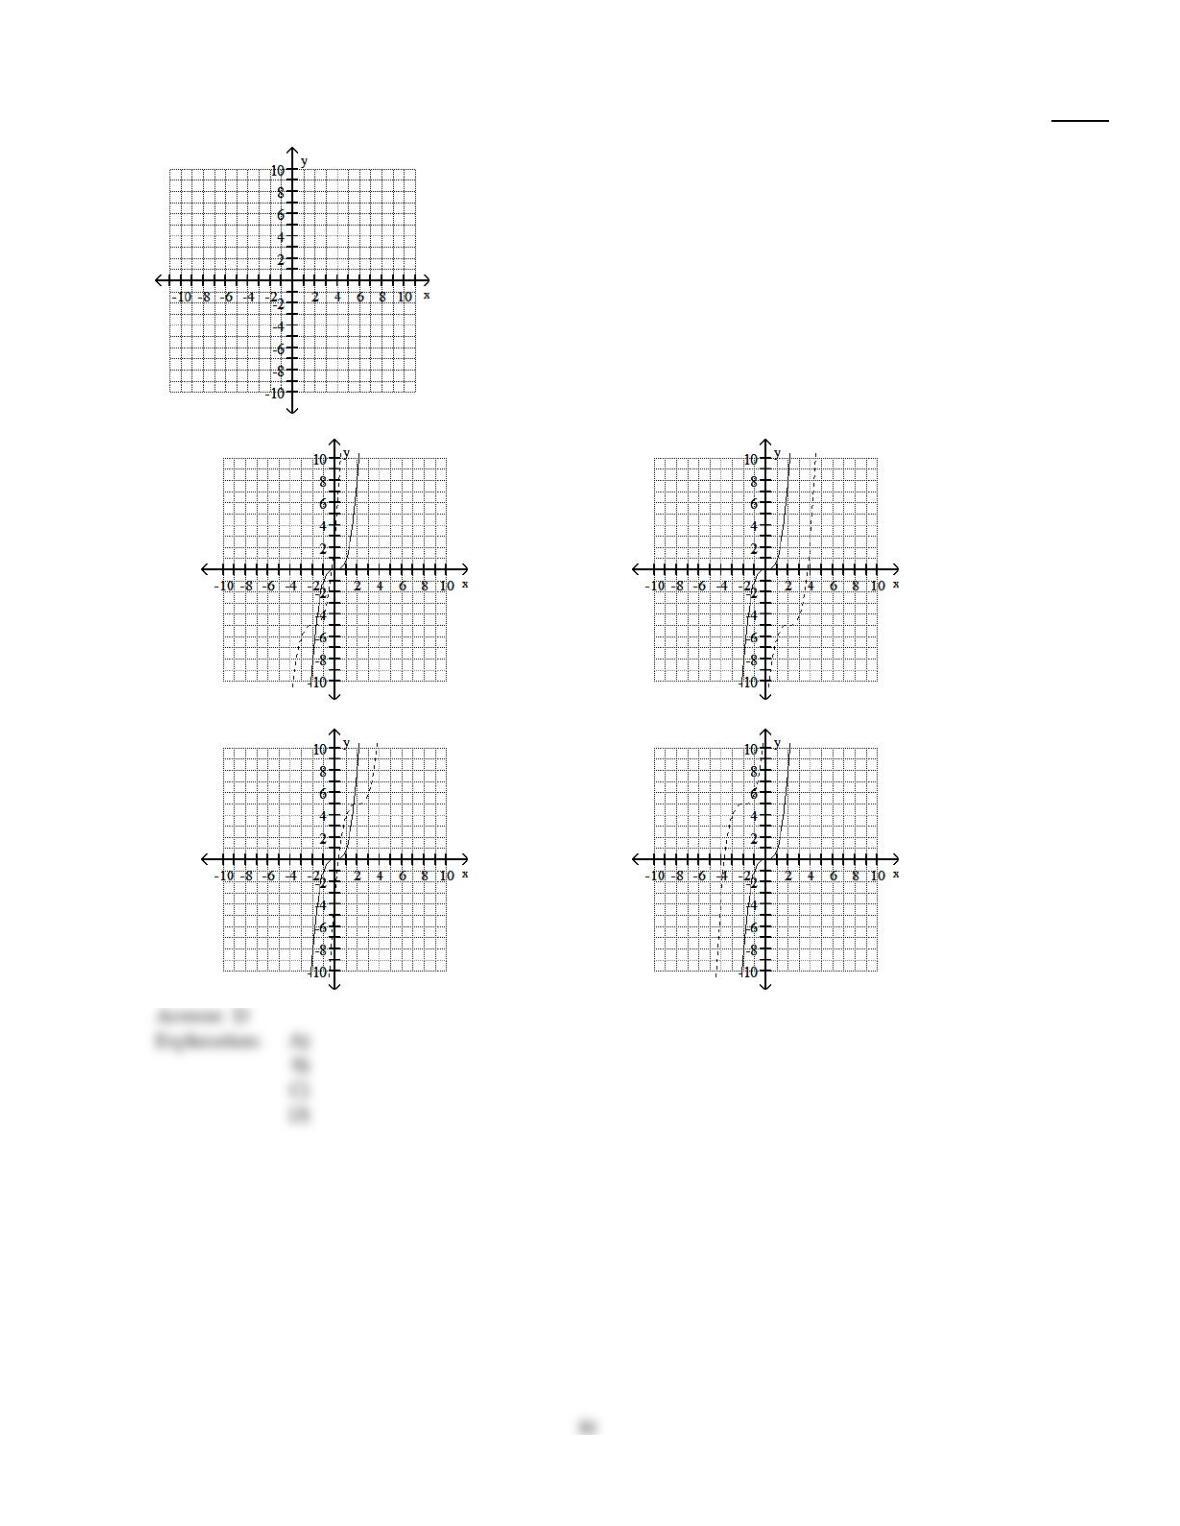
h(x) =(x + 2)3+ 5
161)
A)
B)
C)
D)
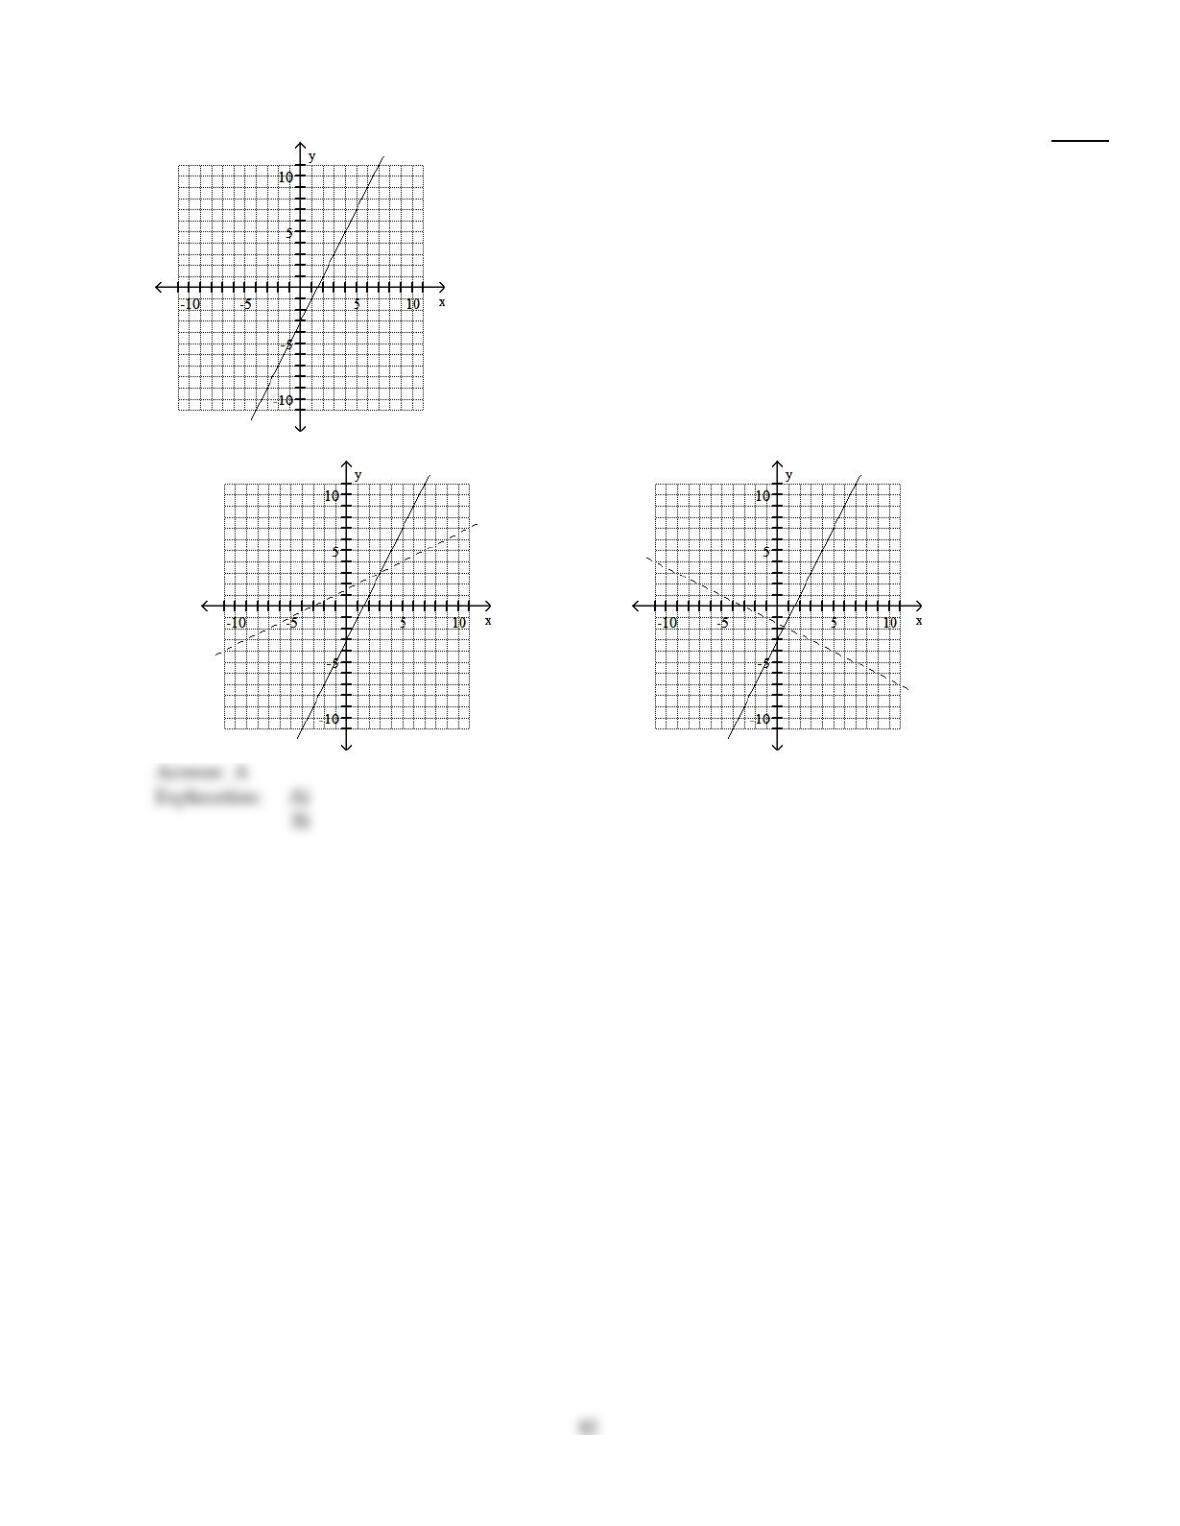
Use the graph of f to draw the graph of its inverse function.
162)
162)
A)
B)
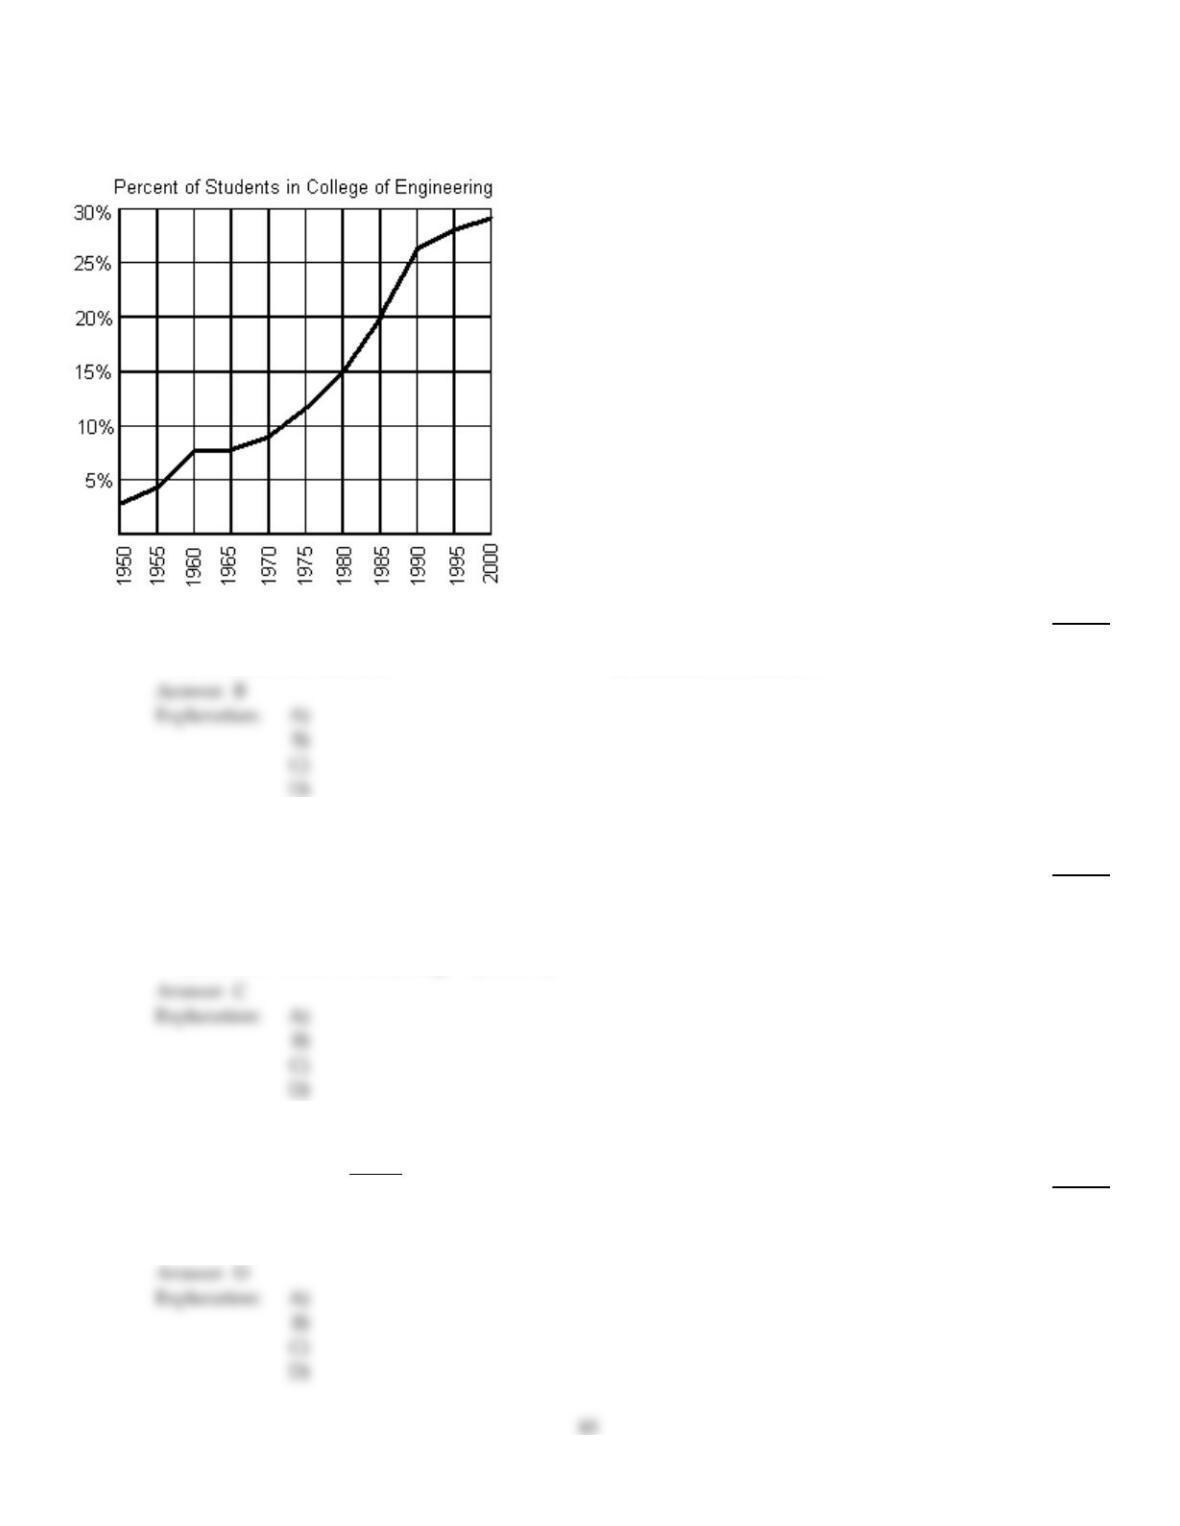
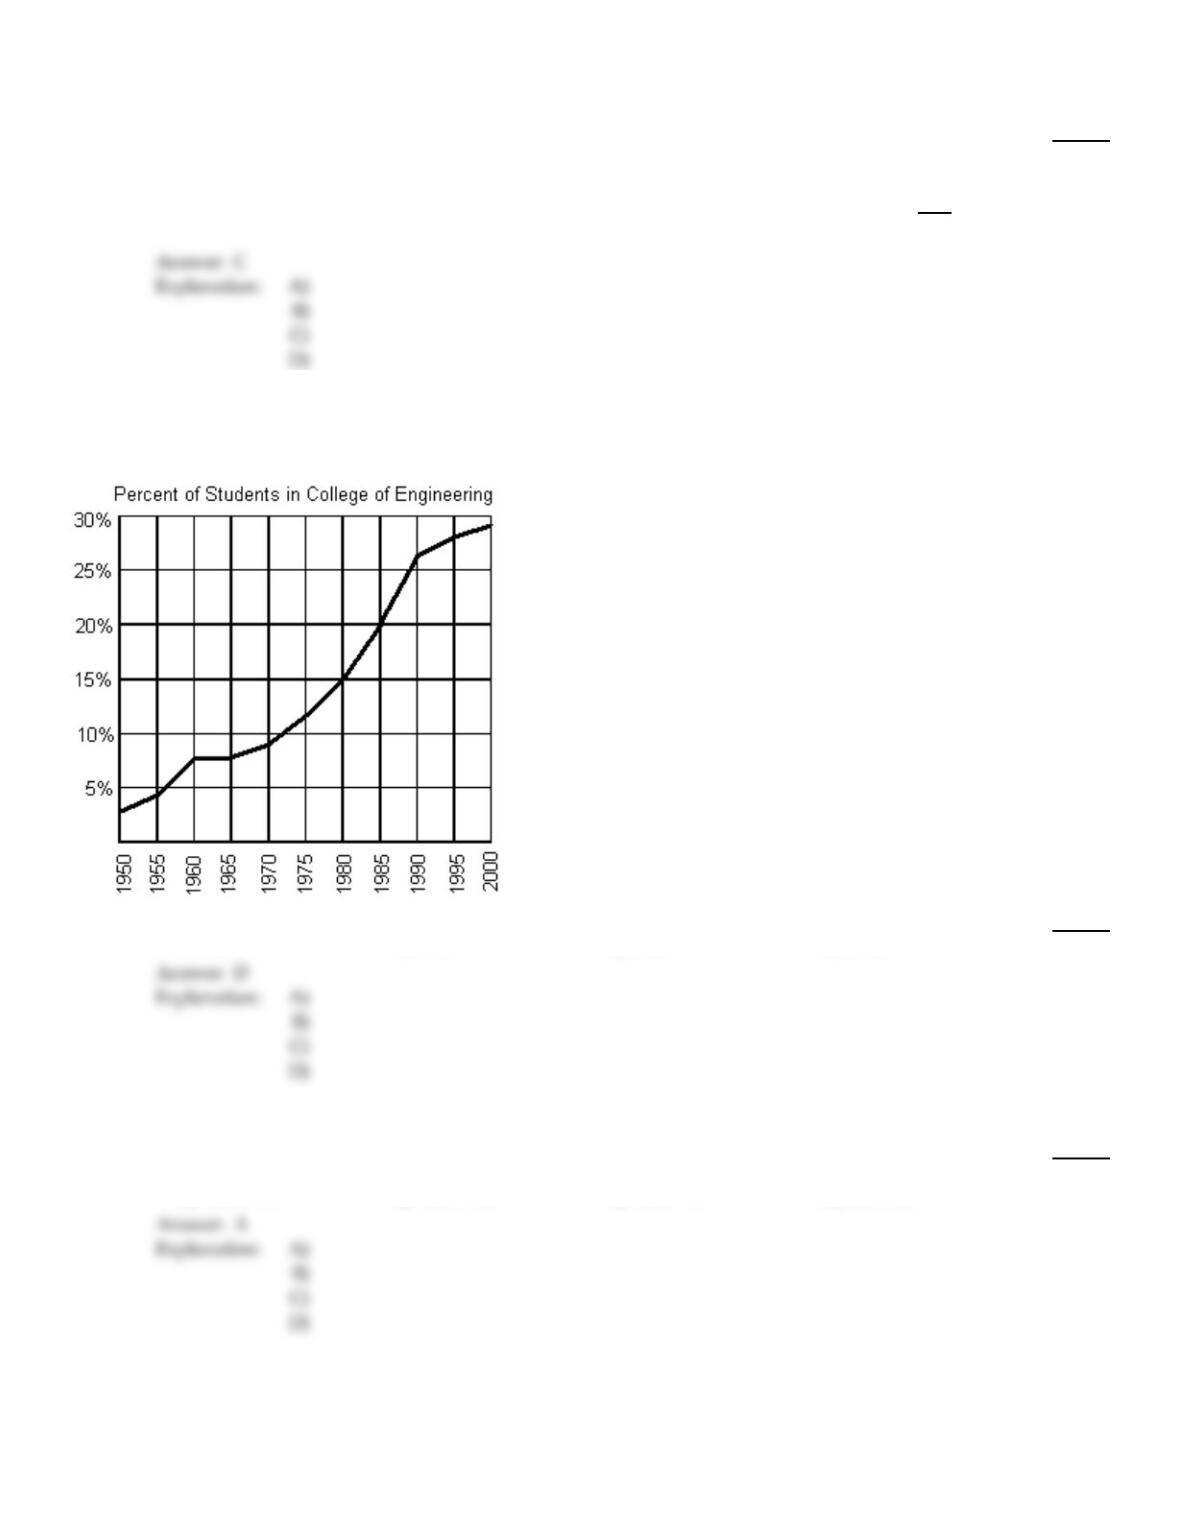
The graph below shows the percentage of students enrolled in the College of Engineering at State University. Use the
graph to answer the question.
163)
Between what two years is the difference in function values equal to 5%?
163)
A)
between 1960 and 1965
B)
between 1980 and 1985
C)
between 1985 and 1990
D)
between 1970 and 1975
Give the domain and range of the relation.
164)
{(–6, –2), (10, –6), (9, –5), (9, 8)}
164)
A)
domain = {10, 9, –6, 19}; range = {–6, –5, –2, 8}
B)
domain = {10, 9, –6, –9}; range = {–6, –5, –2, 8}
C)
domain = {10, 9, –6}; range = {–6, –5, –2, 8}
D)
domain = {–6, –5, –2, 8}; range = {10, 9, –6}
C
Given functions f and g, determine the domain of f +
g.
165)
f(x) =2x – 7,g(x) =3
x –10
165)
A)
(–, )
B)
(0, )
C)
(–, –3) or (–3, )
D)
(–, 10) or (10, )
D
B
Determine whether the relation is a function.
166)
{(3, –9), (3, 3), (4, 9), (7, 4), (10, 7)}
166)
A)
Function
B)
Not a function
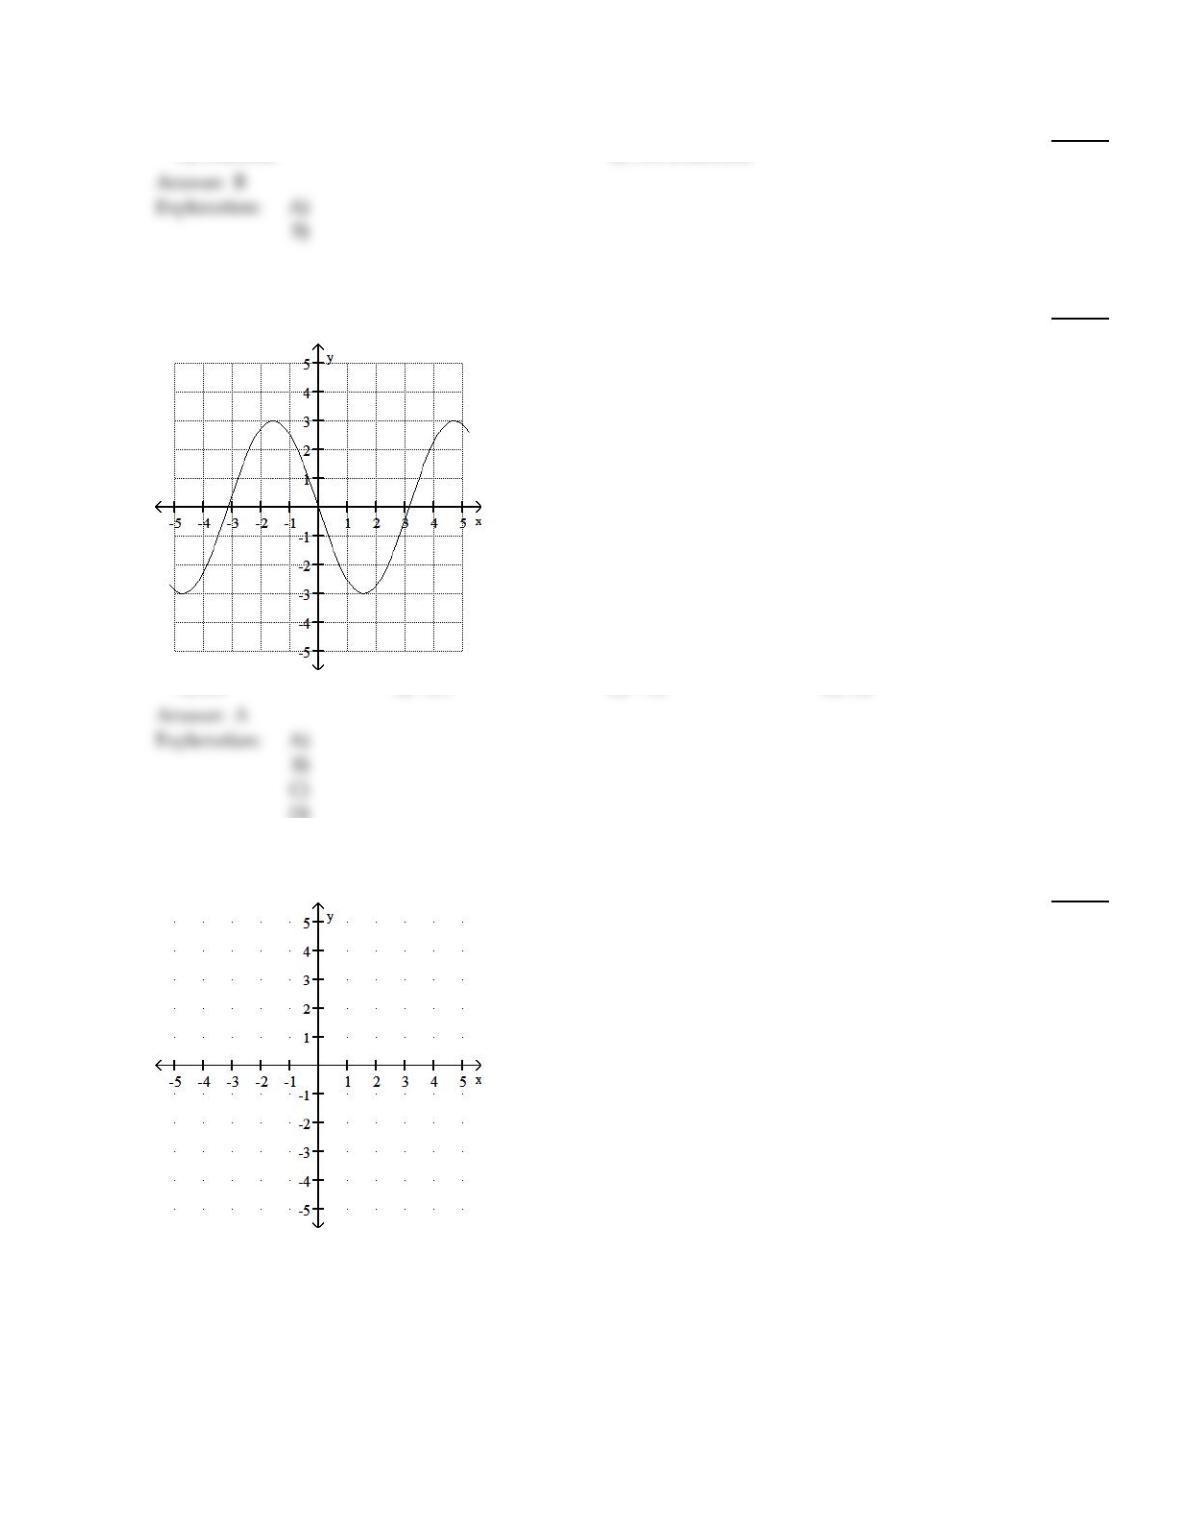
Use the graph to find the indicated function value.
167)
y = f(x). Find f(–3)
167)
A)
0.4
B)
–0.4
C)
–1.6
D)
1.6
D)
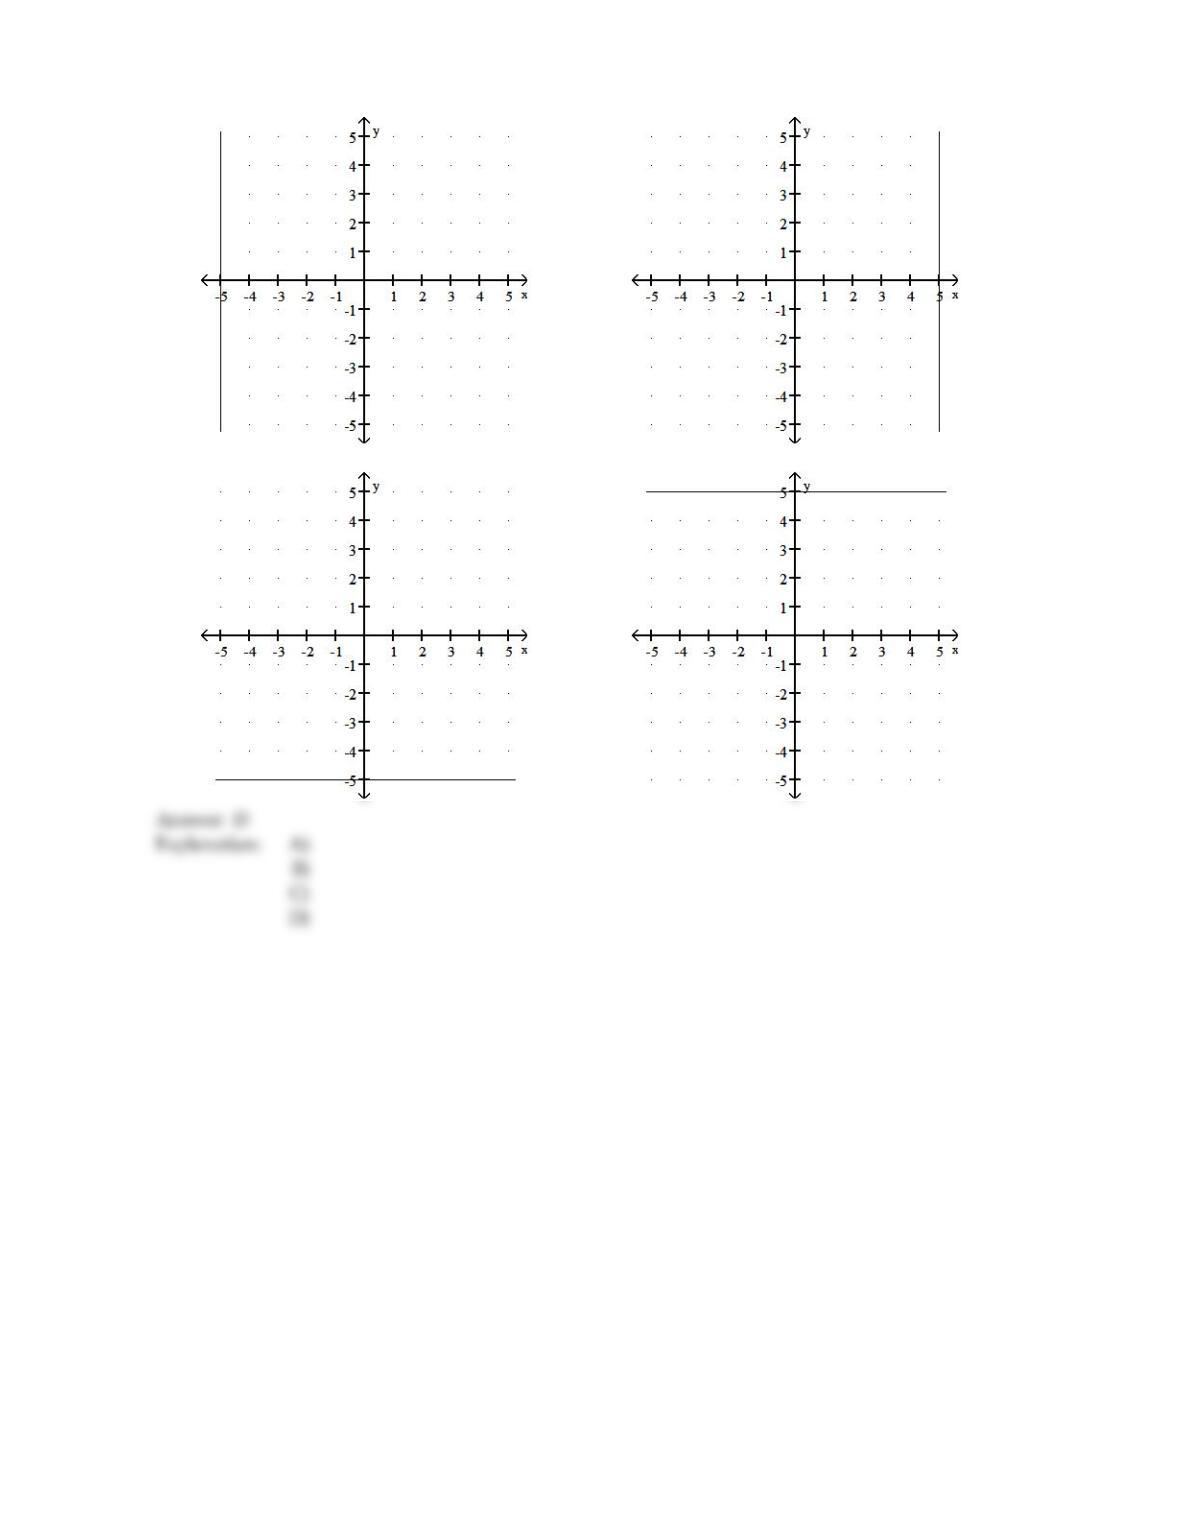
Graph the equation in the rectangular coordinate system.
168)
5y =25
168)
84
A)
B)
C)
D)
85
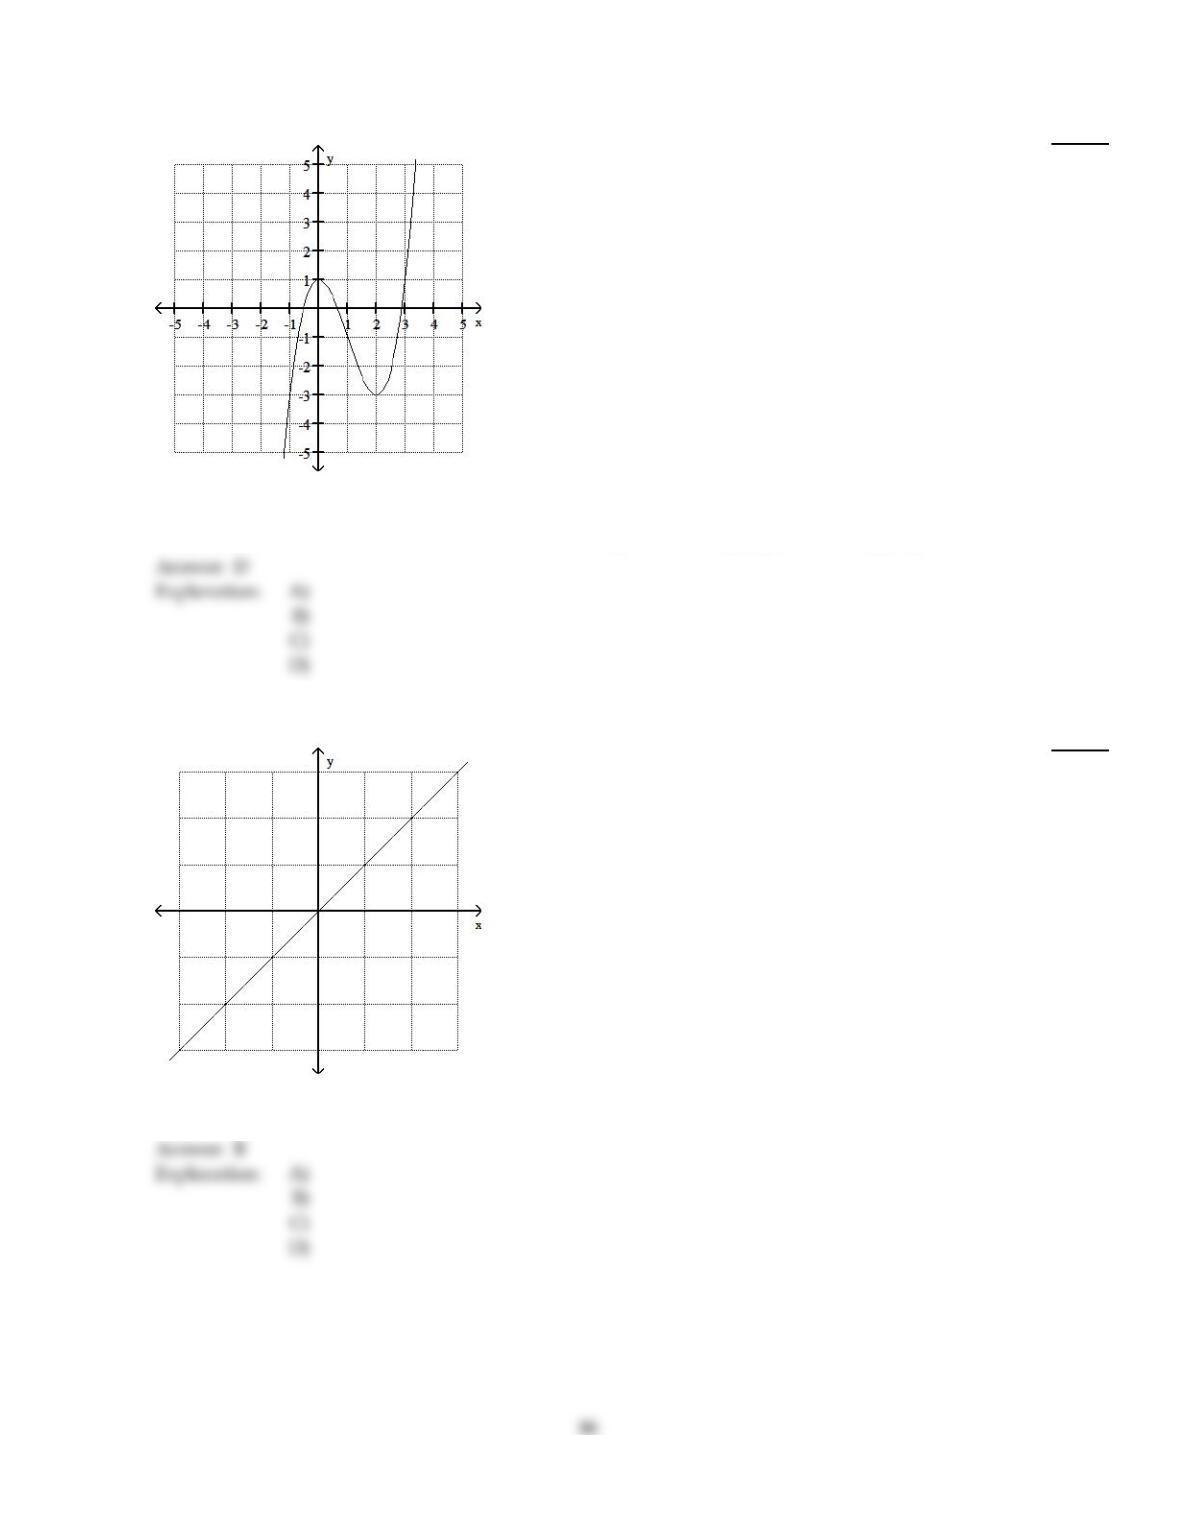
Use the graph of the given function to find any relative maxima and relative minima.
169)
f(x) = x3– 3x2+ 1
169)
A)
maximum: none; minimum: (2, –3)
B)
maximum: (0, 1); minimum: none
C)
no maximum or minimum
D)
maximum: (0, 1); minimum: (2, –3)
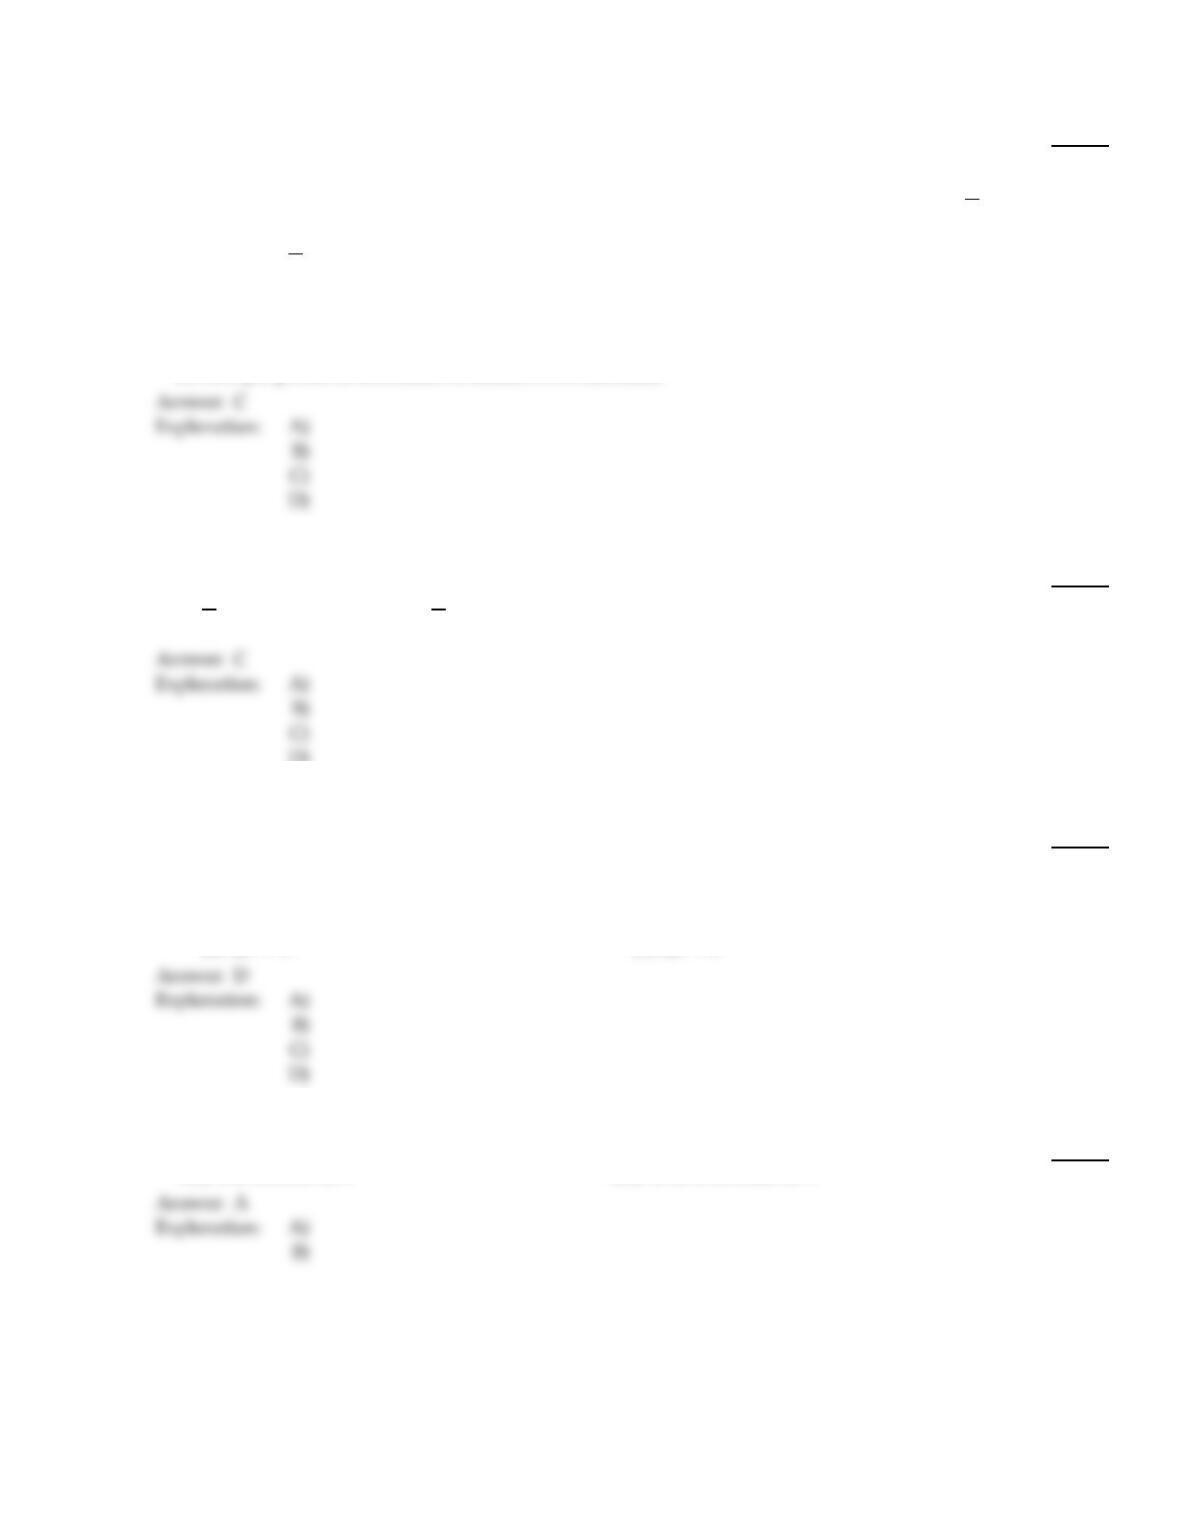
Use the shape of the graph to name the function.
170)
170)
A)
Constant function
B)
Identity function
C)
Absolute value function
D)
Square root function
Solve the problem.
171)
The function f(t) = – 0.15t2+0.49t +30.4 models the U.S. population in millions, ages 65 and older,
where t represents years after 1990. The function g(t) =0.5t2+12.68t +105.2 models the total yearly
cost of Medicare in billions of dollars, where t represents years after 1990. What does the function g
f
represent? Find g
f(15).
171)
A)
Cost per person in thousands of dollars. $0.01 thousand
B)
Cost per person in thousands of dollars. $0.18 thousand
C)
Cost per person in thousands of dollars. $101.98 thousand
D)
Cost per person in thousands of dollars. $7.36 thousand
Find the slope of the line that goes through the given points.
172)
(6, –1), (2, –1)
172)
A)
1
2
B)
–1
4
C)
0
D)
Undefined
C
D)
Complete the square and write the equation in standard form. Then give the center and radius of the circle.
173)
x2+ y2– 2x – 12y + 37 =4
173)
A)
(x – 6)2+(y – 1)2=4
(–6, –1), r =4
B)
(x – 1)2+(y – 6)2=4
(–1, –6), r =4
C)
(x – 6)2+(y – 1)2=4
(6, 1), r =2
D)
(x – 1)2+(y – 6)2=4
(1, 6), r =2
D
D)
Determine whether the equation defines y as a function of x.
174)
2x + 3y =15
174)
A)
y is a function of x
B)
y is not a function of x
A
87
C
D)
Solve.
175)
When making a telephone call using a calling card, a call lasting 3 minutes cost $0.95. A call lasting
11 minutes cost $2.55. Let y be the cost of making a call lasting x minutes using a calling card.
Write a linear equation that models the cost of a making a call lasting x minutes.
175)
A)
y =0.2x – 8.45
B)
y = – 0.2x +1.55
C)
y =0.2x +0.35
D)
y =5x –281
20
The graph below shows the percentage of students enrolled in the College of Engineering at State University. Use the
graph to answer the question.
176)
If f(x) =15%, what year is represented by x?
176)
A)
1970
B)
1975
C)
1985
D)
1980
For the given functions f and g , find the indicated composition.
177)
f(x) = – 4x + 2,g(x) =5x + 8
(g
f)(x)
177)
A)
–20x + 18
B)
–20x + 34
C)
–20x – 2
D)
20x + 18
88
Solve the problem.
178)
Suppose a car rental company charges $88 for the first day and $38 for each additional or partial
day. Let S(x) represent the cost of renting a car for x days. Find the value of S(4.5).
178)
A)
$240
B)
$259
C)
$171
D)
$221
Evaluate the function at the given value of the independent variable and simplify.
179)
f(x) =x3+ 3
x2– 5 ;f(5)
179)
A)
25
4
B)
32
5
C)
128
25
D)
7
5
Find the domain of the function.
180)
f(x) =5x + 3
180)
A)
(0, )
B)
(–, 0)
(0, )
C)
(–, )
D)
[–3, )
Determine whether the relation is a function.
181)
{(–8, –9), (–8, 9), (1, 3), (3, 5), (10, –9)}
181)
A)
Function
B)
Not a function
Determine whether the given function is even, odd, or neither.
182)
f(x) =2x2+ x4
182)
A)
Neither
B)
Odd
C)
Even
89
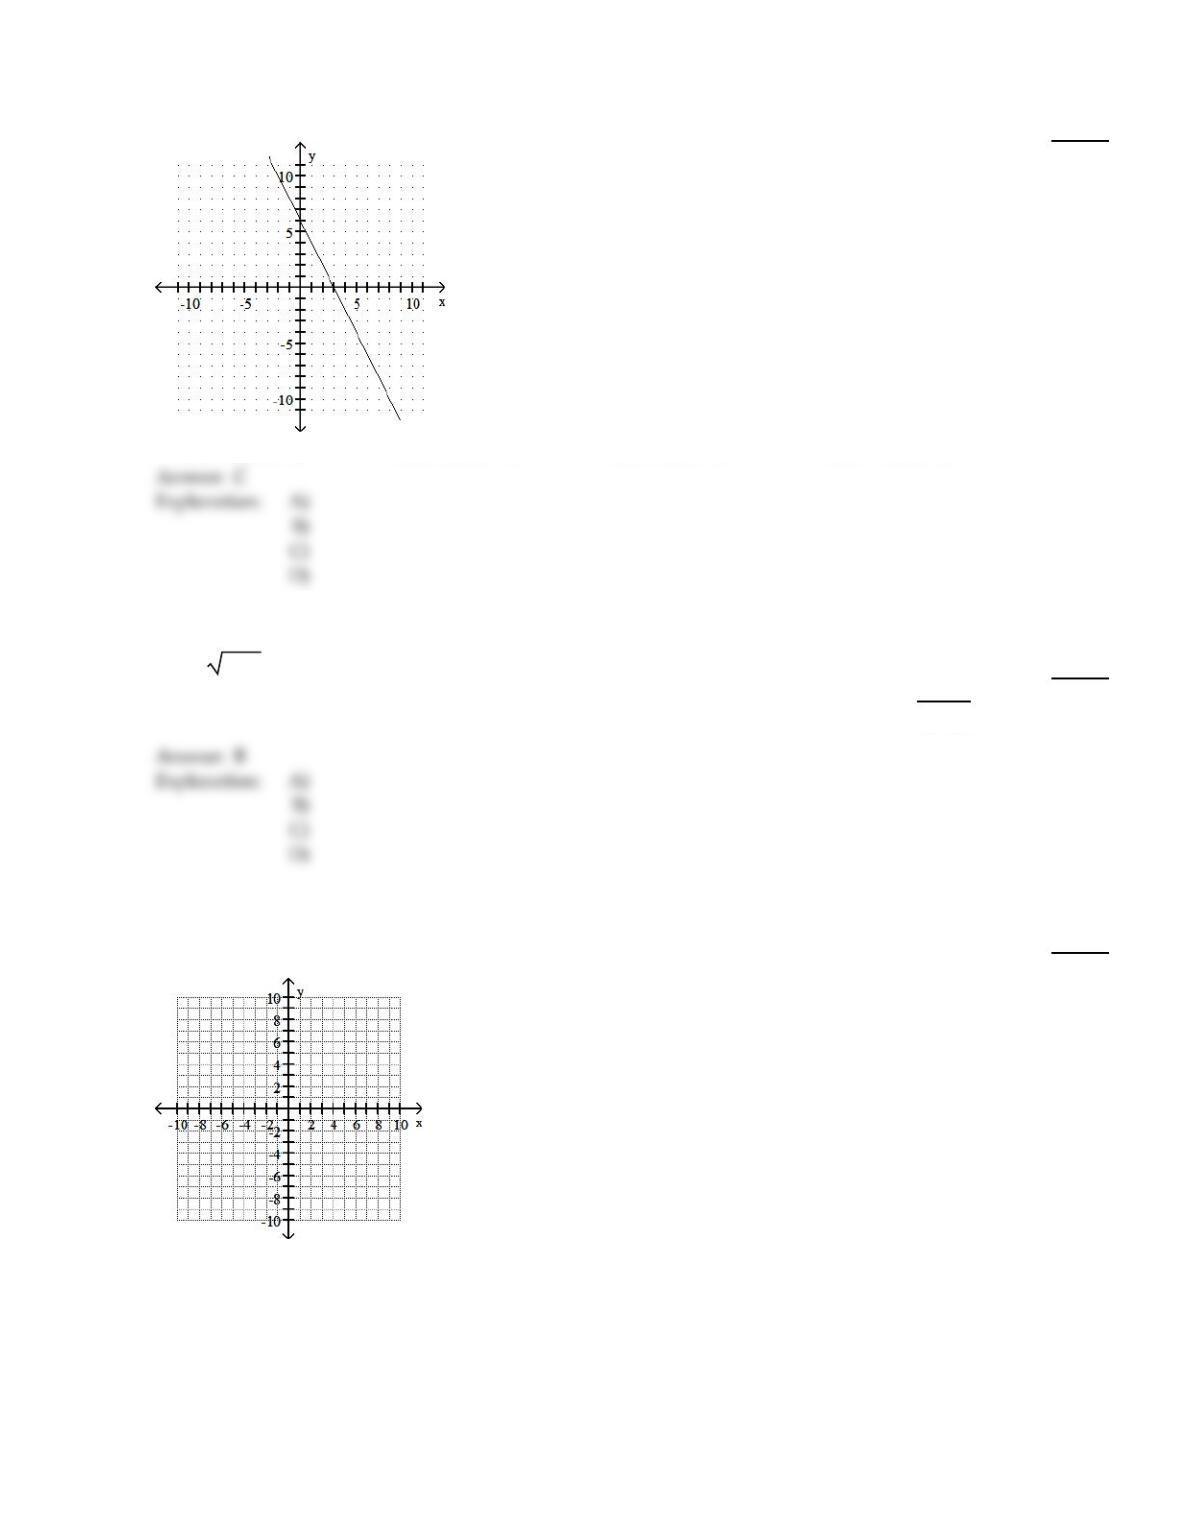
Identify the intercepts.
183)
183)
A)
(–3, 0), (0, 6)
B)
(3, 0), (0, –6)
C)
(3, 0), (0, 6)
D)
(–6, 0), (0, 6)
Find the inverse of the one–to–one function.
184)
f(x) =
3x – 3
184)
A)
f–1(x) = x + 3
B)
f–1(x) =x3+ 3
C)
f–1(x) =x3+9
D)
f–1(x) =1
x3+ 3
Begin by graphing the standard function f(x) =x3 Then use transformations of this graph to graph the given function.
185)
g(x) =x3+ 2
185)
90
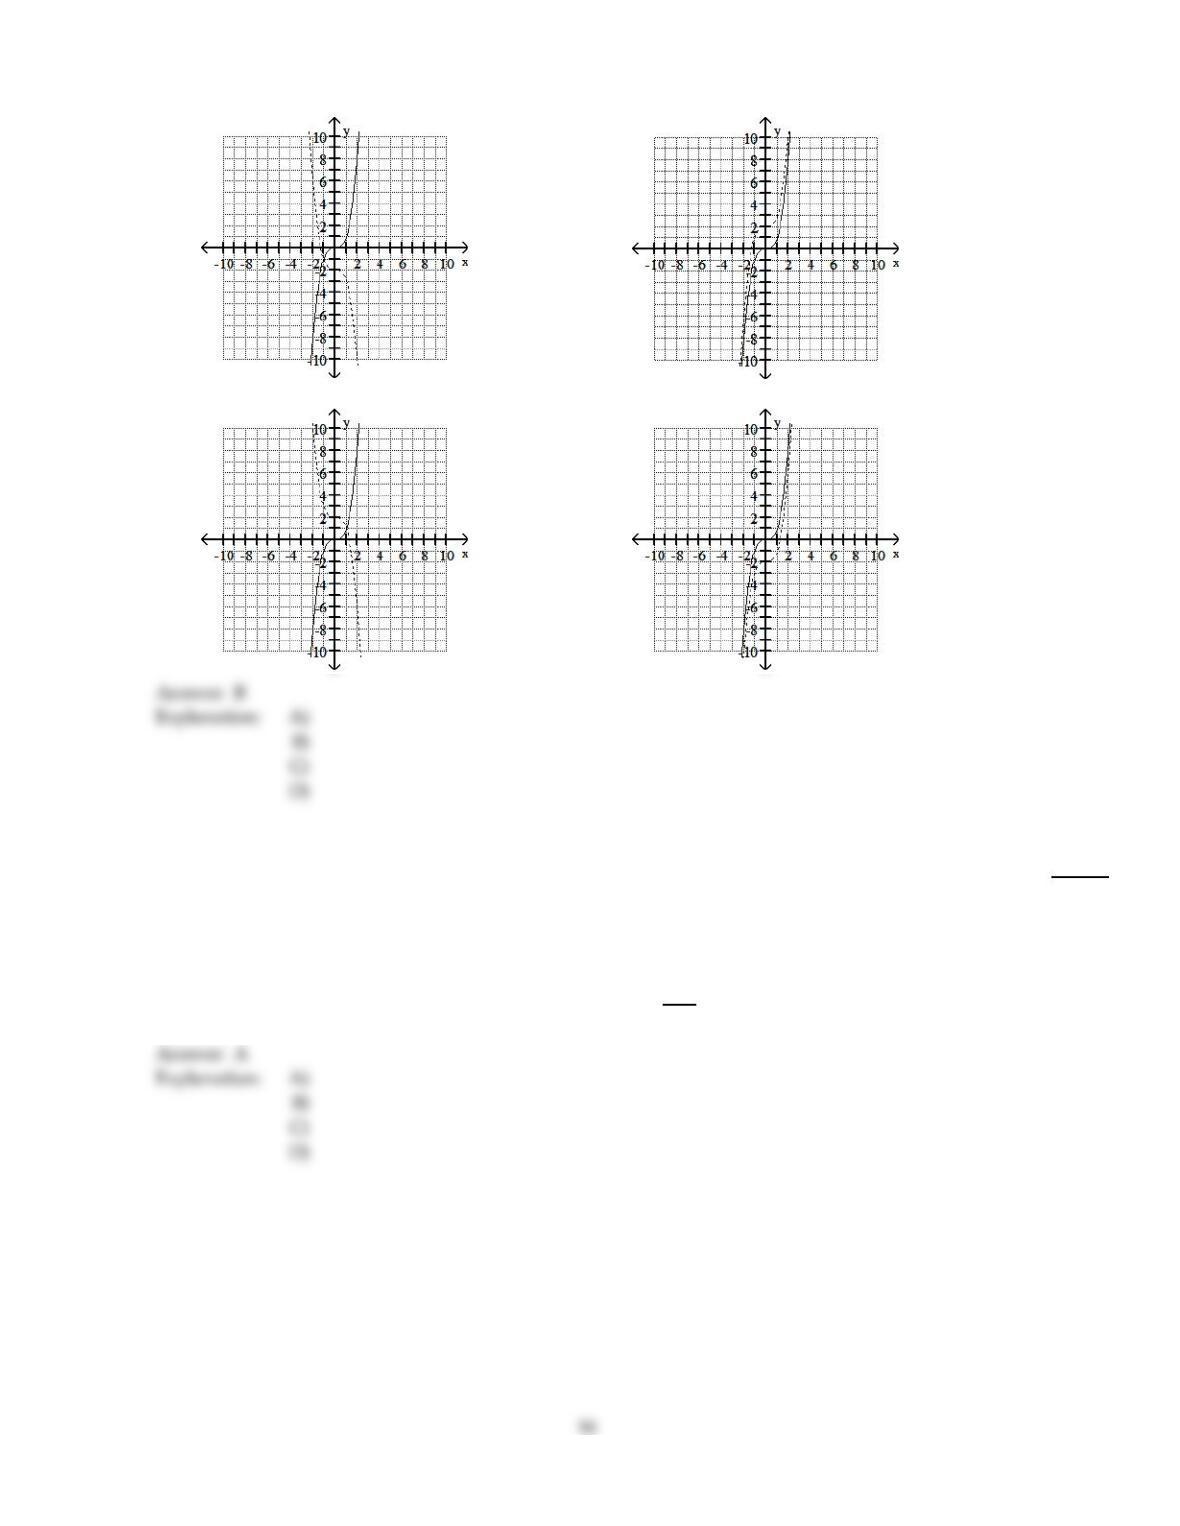
A)
B)
C)
D)
Solve.
186)
An investment is worth $3672 in 1994. By 1998 it has grown to $5512. Let y be the value of the
investment in the year x, where x = 0 represents 1994. Write a linear equation that models the value
of the investment in the year x.
186)
A)
y =460x +3672
B)
y = – 460x +3672
C)
y = – 460x +7352
D)
y =1
460x +3672
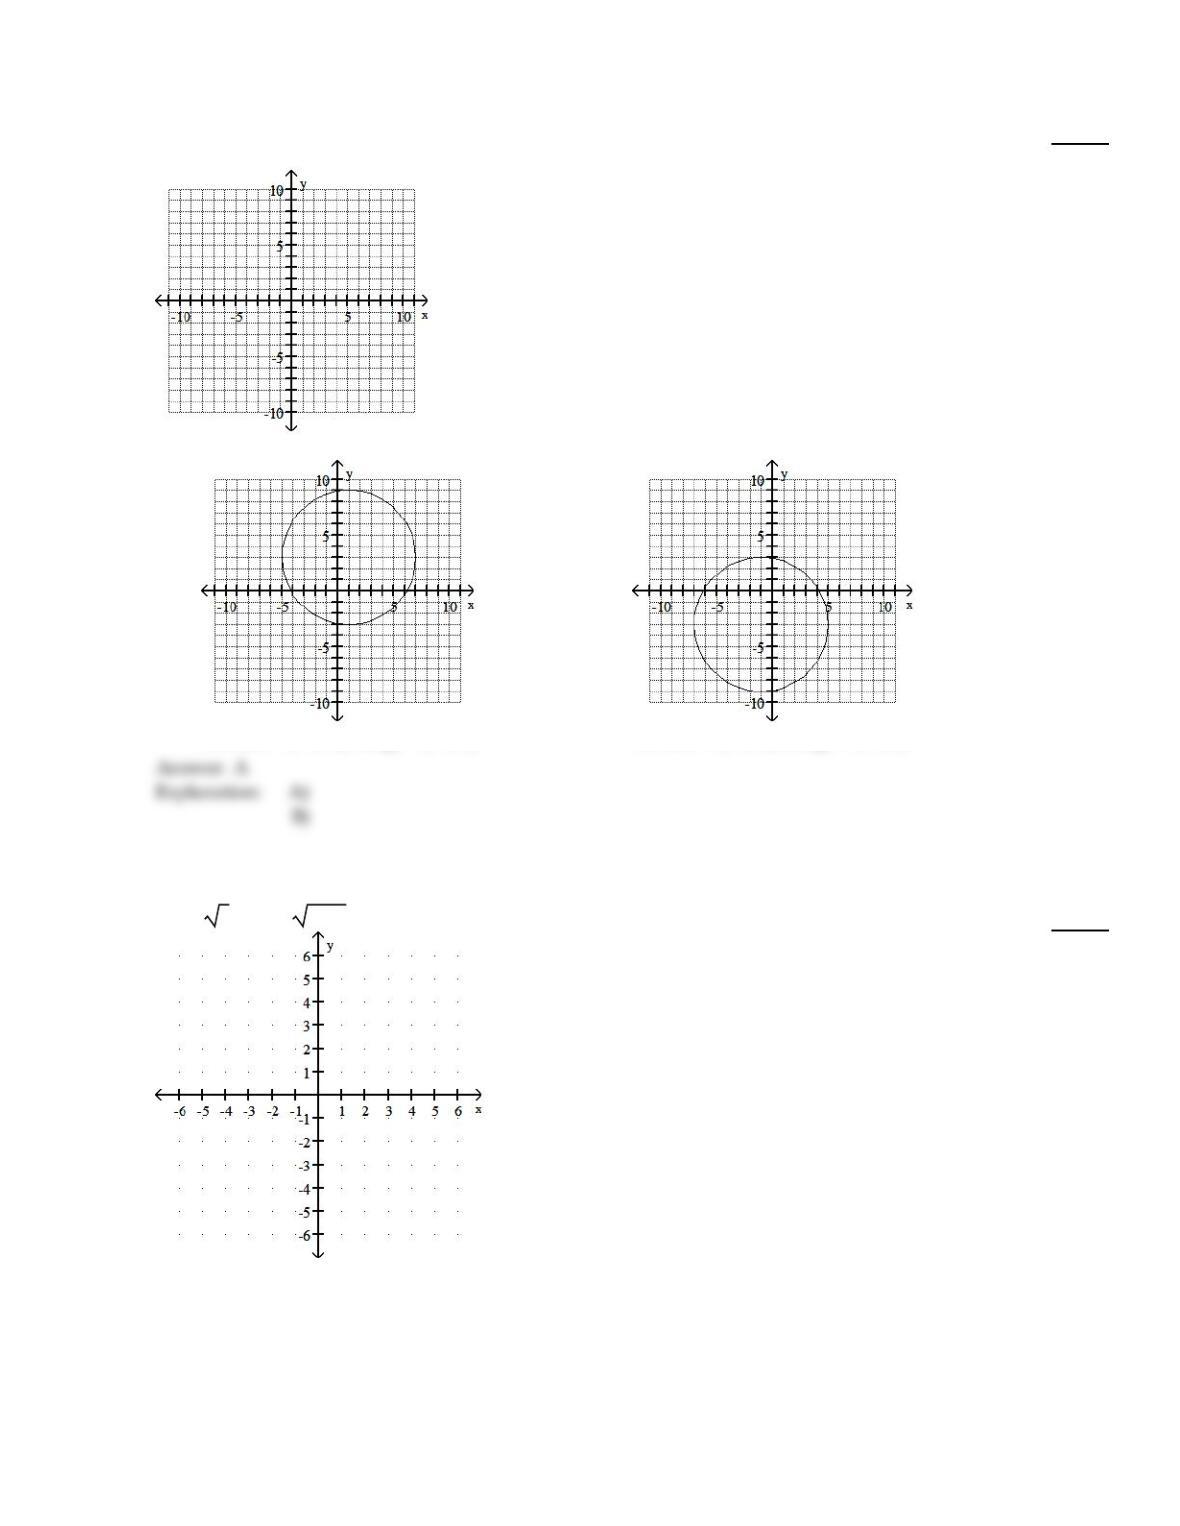
Graph the equation.
187)
(x – 1)2+ (y – 3)2=36
187)
A)
Domain = (–5, 7), Range = (–3, 9)
B)
Domain = (–7, 5), Range = (–9, 3)
Graph the given functions on the same rectangular coordinate system. Describe how the graph of g is related to the graph
of f.
188)
f(x) =x, g(x) =x –4
188)
92
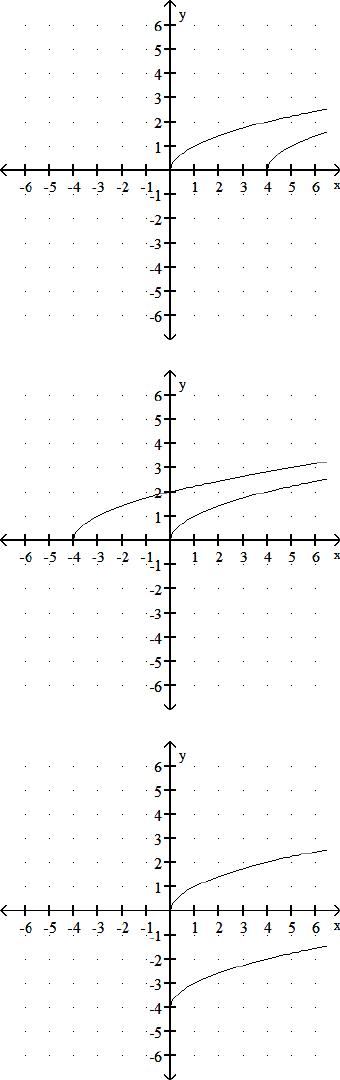
A)
g shifts the graph of f 4units to the right
B)
g shifts the graph of f 4units to the left
C)
g shifts the graph of f vertically down 4units
93
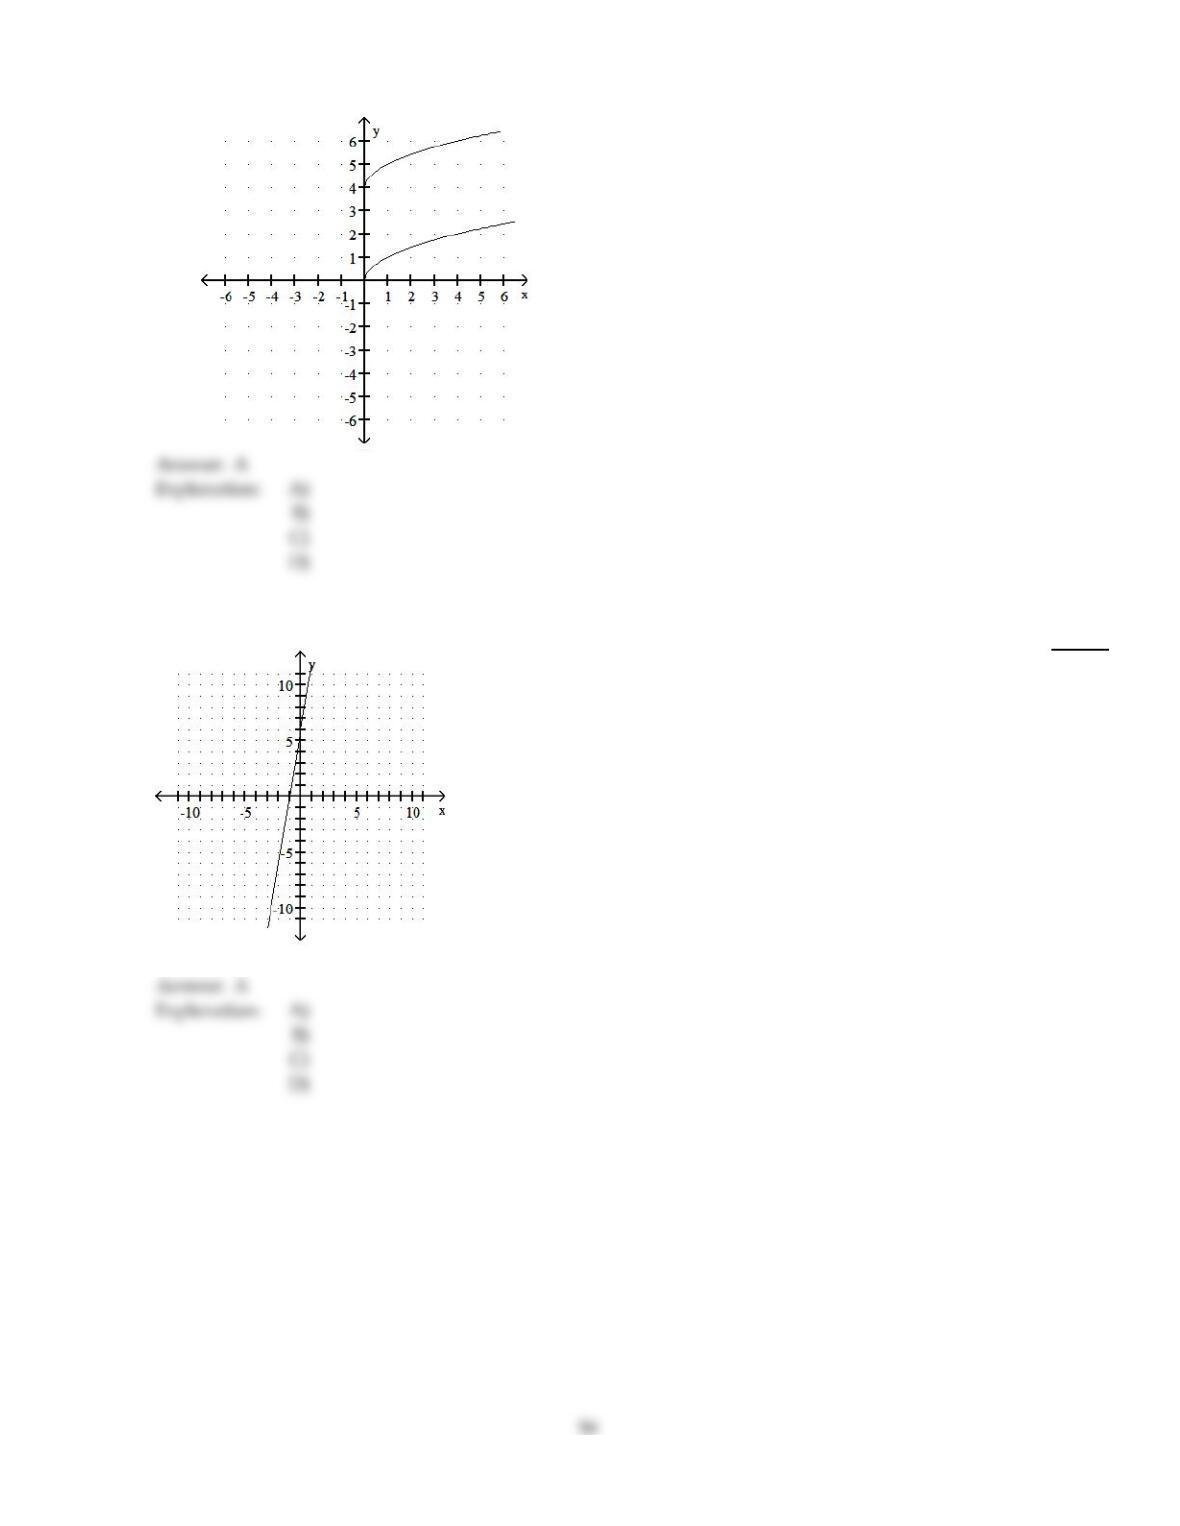
D)
g shifts the graph of f vertically up 4units
Identify the intercepts.
189)
189)
A)
(–1, 0), (0, 6)
B)
(–1, 0), (0, –6)
C)
(–6, 0), (0, 6)
D)
(1, 0), (0, 6)