Find functions f and g so that h(x) = (f
g)(x).
164)
h(x) = 1
x2+ 4
164)
A)
f(x) =1/x2, g(x) =4
B)
f(x) = x + 4, g(x) =1/x2
C)
f(x) = 1/x, g(x) =1/x + 4
D)
f(x) = x, g(x) =1/x + 4
Solve the problem.
165)
The function P(x) =0.35x – 74 models the relationship between the number of pretzels x that a
certain vendor sells and the profit the vendor makes. Find P(1000), the profit the vendor makes
from selling 1000 pretzels.
165)
A)
$276
B)
$926
C)
$424
D)
$350
Determine whether the relation is a function.
166)
{(–6, 1), (–3, –6), (4, –6), (4, –3)}
166)
A)
Function
B)
Not a function
Determine whether the equation defines y as a function of x.
167)
x + y =36
167)
A)
y is a function of x
B)
y is not a function of x
Find the midpoint of the line segment whose end points are given.
168)
(5 3, 9 6) and (8 3, 12 6)
168)
A)
(–3 3
2, –3 6
2)
B)
(13 3, 21 6)
C)
(13 3
2, 21 6
2)
D)
(3 3
2, 3 6
2)
81
Find the distance between the pair of points.
169)
(2, –5) and (6, –3)
169)
A)
2 5
B)
12
C)
12 3
D)
2
Determine which two functions are inverses of each other.
170)
f(x) =x3–11 g(x) =
3x –11 h(x) =x3+11
170)
A)
f(x) and h(x)
B)
g(x) and h(x)
C)
None
D)
f(x) and g(x)
B
Find the distance between the pair of points.
171)
(4, –4) and (–3, –5)
171)
A)
5 2
B)
6
C)
48 3
D)
48
A
Solve.
172)
An investment is worth $3672 in 1994. By 1998 it has grown to $5512. Let y be the value of the
investment in the year x, where x = 0 represents 1994. Write a linear equation that models the value
of the investment in the year x.
172)
A)
y = – 460x +7352
B)
y = – 460x +3672
C)
y =460x +3672
D)
y =1
460x +3672
C
Determine which two functions are inverses of each other.
173)
f(x) =x – 3
2g(x) =2x – 3 h(x) =x + 3
2
173)
A)
f(x) and g(x)
B)
g(x) and h(x)
C)
None
D)
f(x) and h(x)
B
82
A
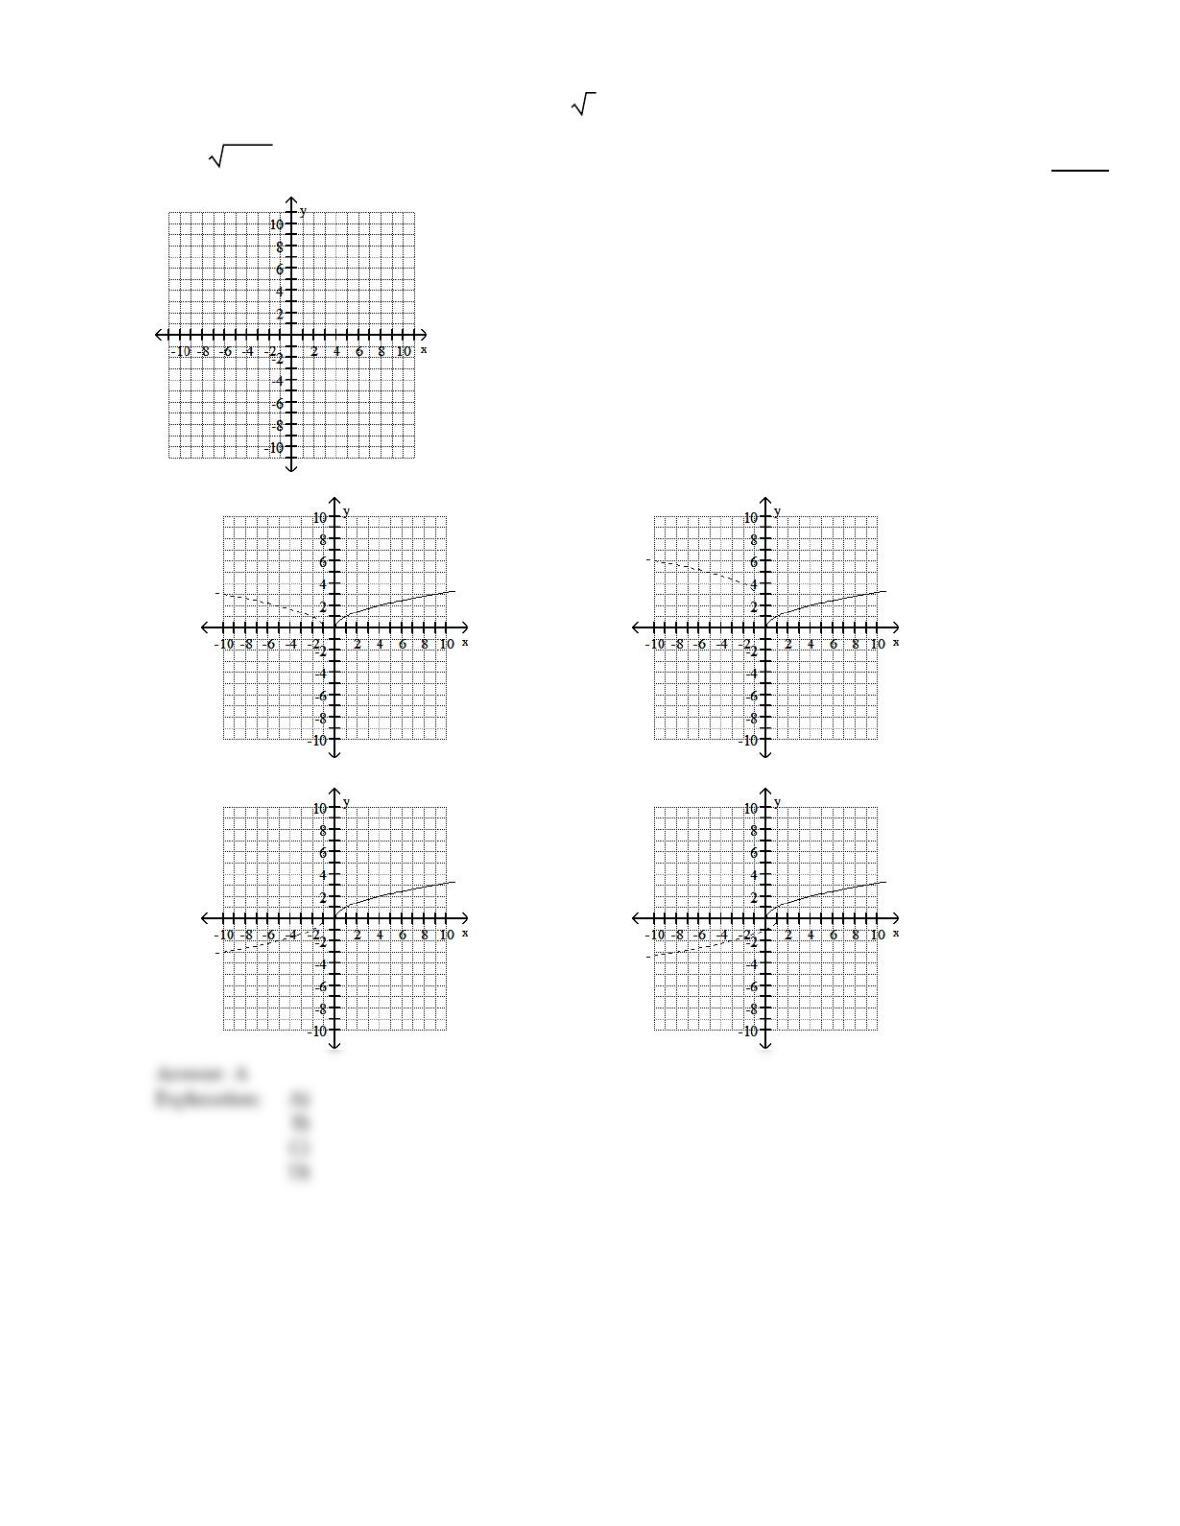
Begin by graphing the standard square root function f(x) =x . Then use transformations of this graph to graph the given
function.
174)
g(x) = – x – 1
174)
A)
B)
C)
D)
Graph the given functions on the same rectangular coordinate system. Describe how the graph of g is related to the graph
of f.
83
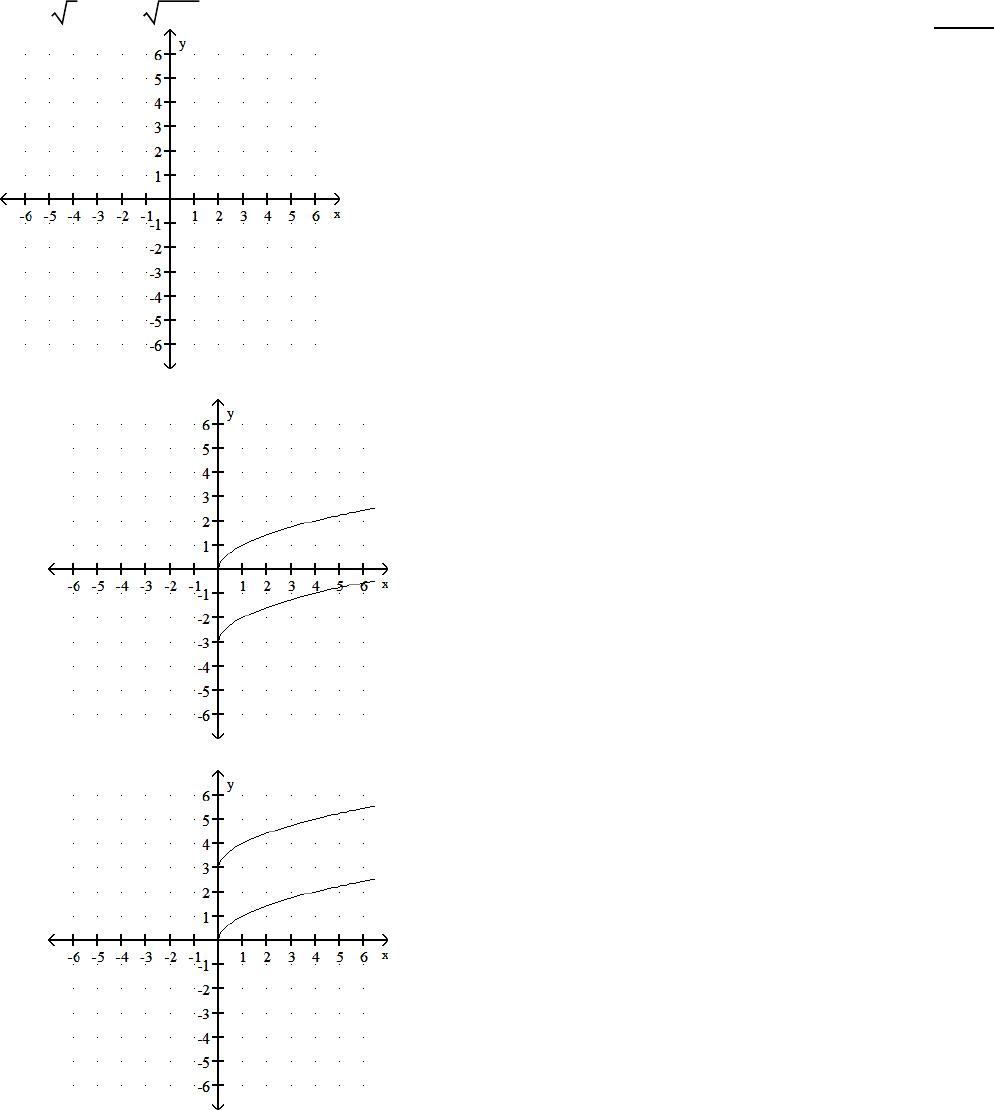
175)
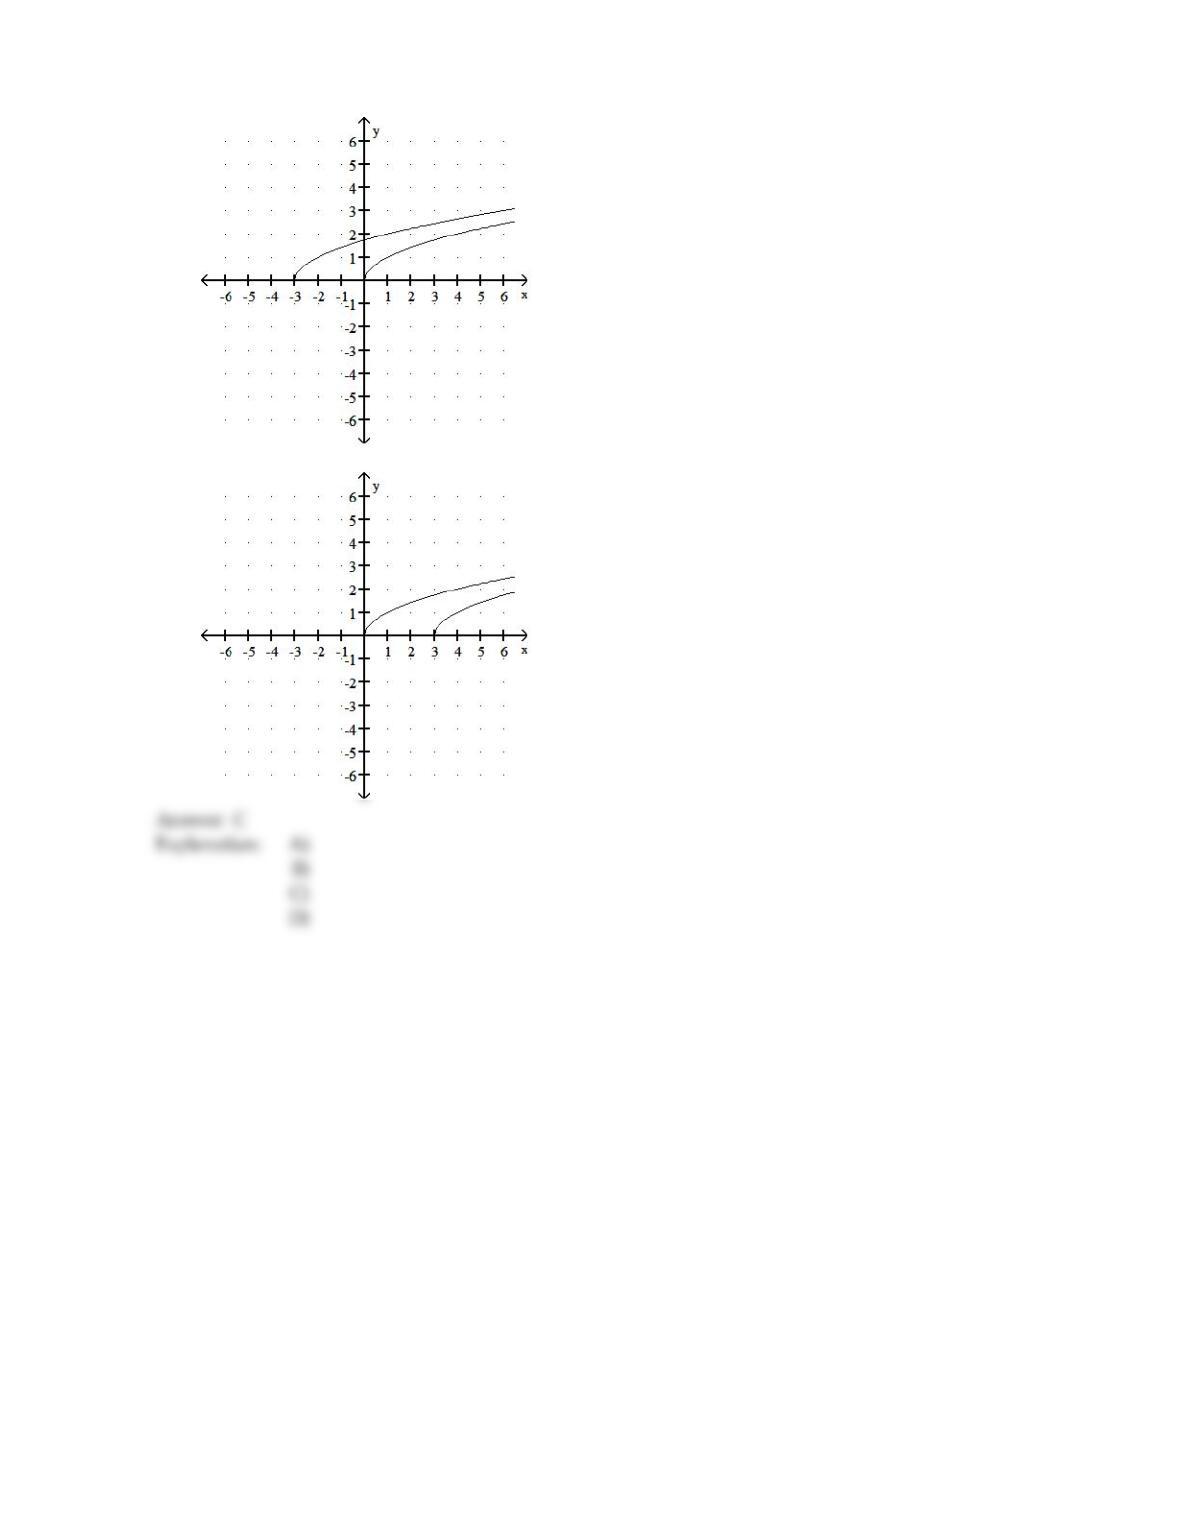
f(x) =x, g(x) =x +3
175)
A)
g shifts the graph of f vertically down 3units
B)
g shifts the graph of f vertically up 3units
84
C)
g shifts the graph of f 3units to the left
D)
g shifts the graph of f 3units to the right
85
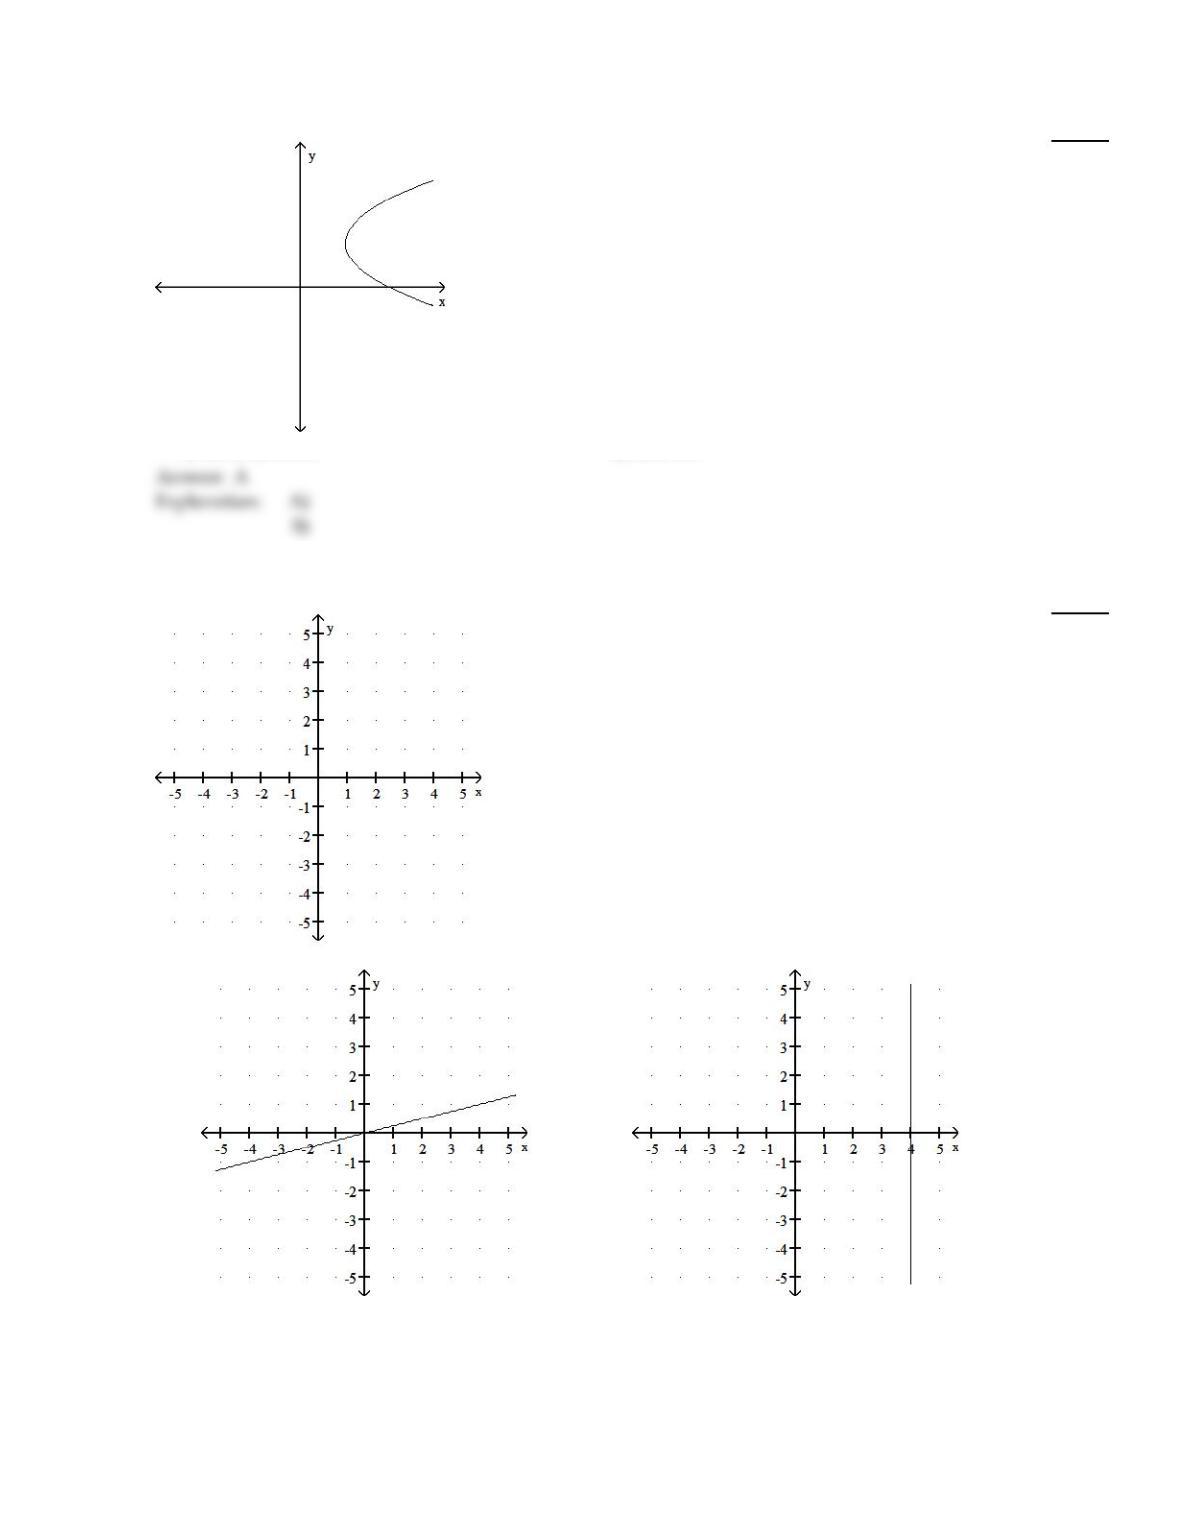
Use the vertical line test to determine whether or not the graph is a graph in which y is a function of x.
176)
176)
A)
not a function
B)
function
Graph the equation in the rectangular coordinate system.
177)
x =4
177)
A)
B)
86
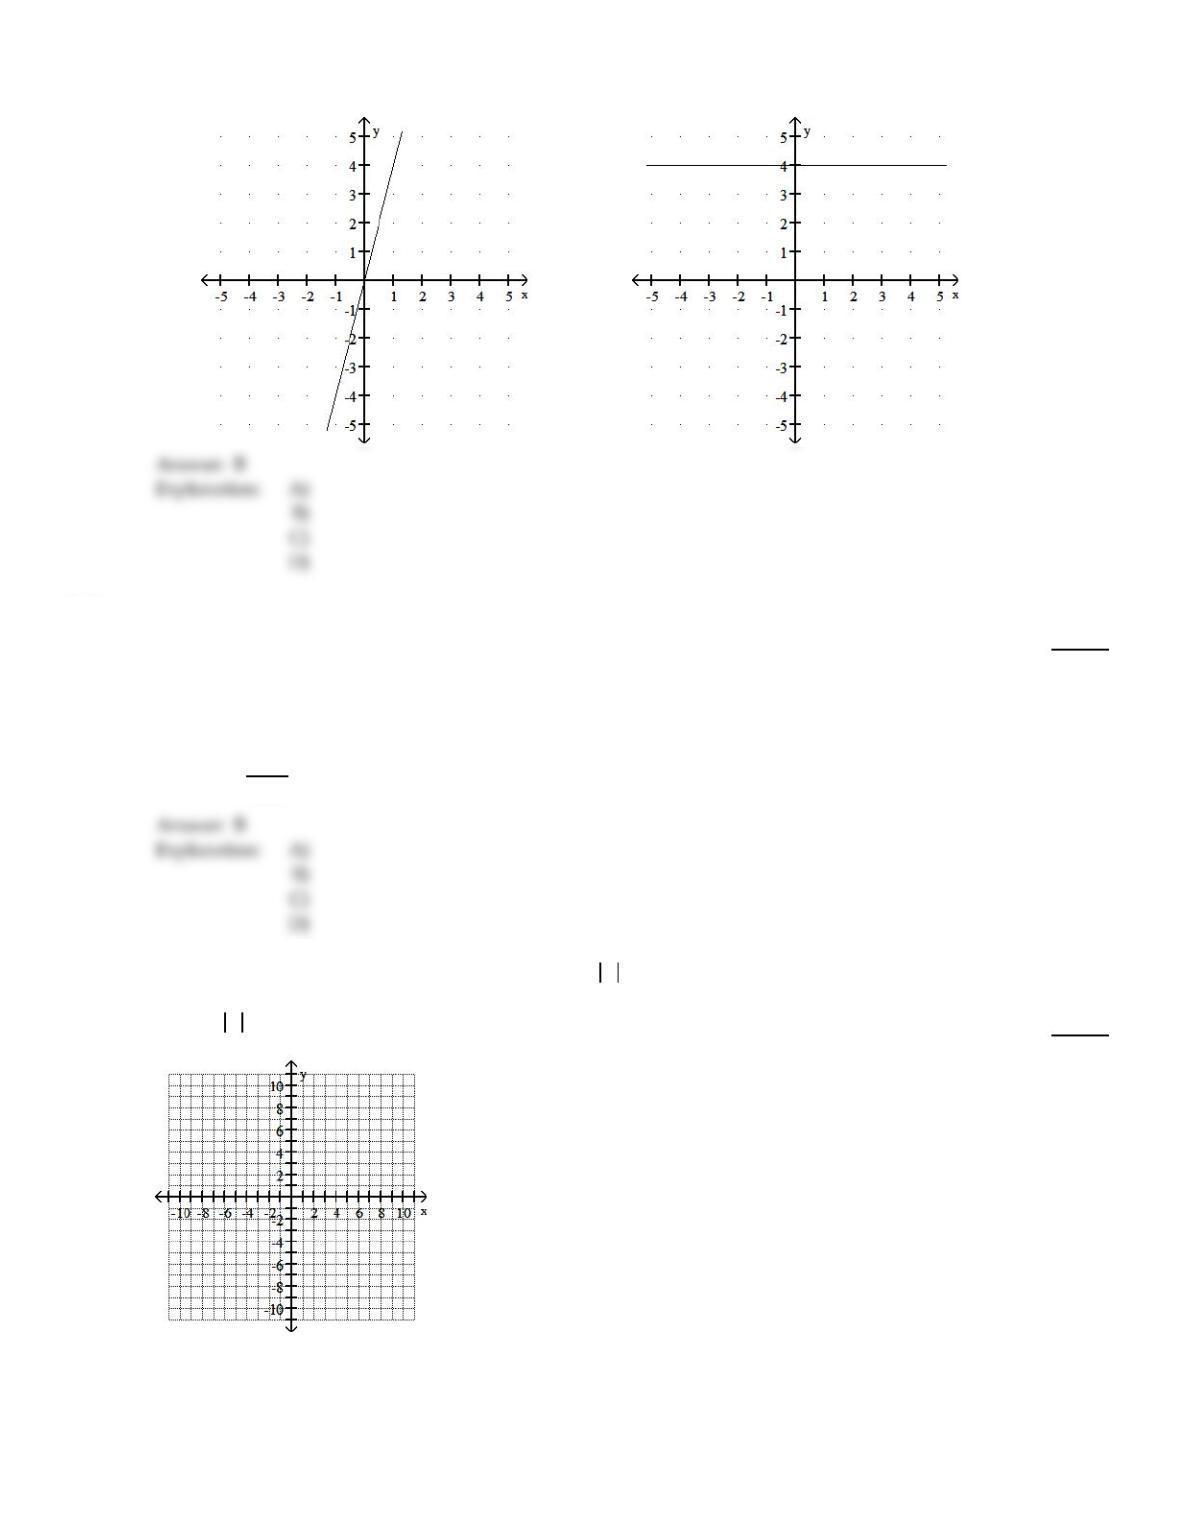
C)
D)
Solve.
178)
The average value of a certain type of automobile was $14,640 in 1994 and depreciated to $6240 in
1997. Let y be the average value of the automobile in the year x, where x = 0 represents 1994. Write
a linear equation that models the value of the automobile in terms of the year x.
178)
A)
y = – 2800x – 2160
B)
y = – 2800x +14,640
C)
y = – 1
2800 x – 6240
D)
y = – 2800x +6240
Begin by graphing the standard absolute value function f(x) =x. Then use transformations of this graph to graph the
given function.
179)
h(x) = 2 x+ 2
179)
87
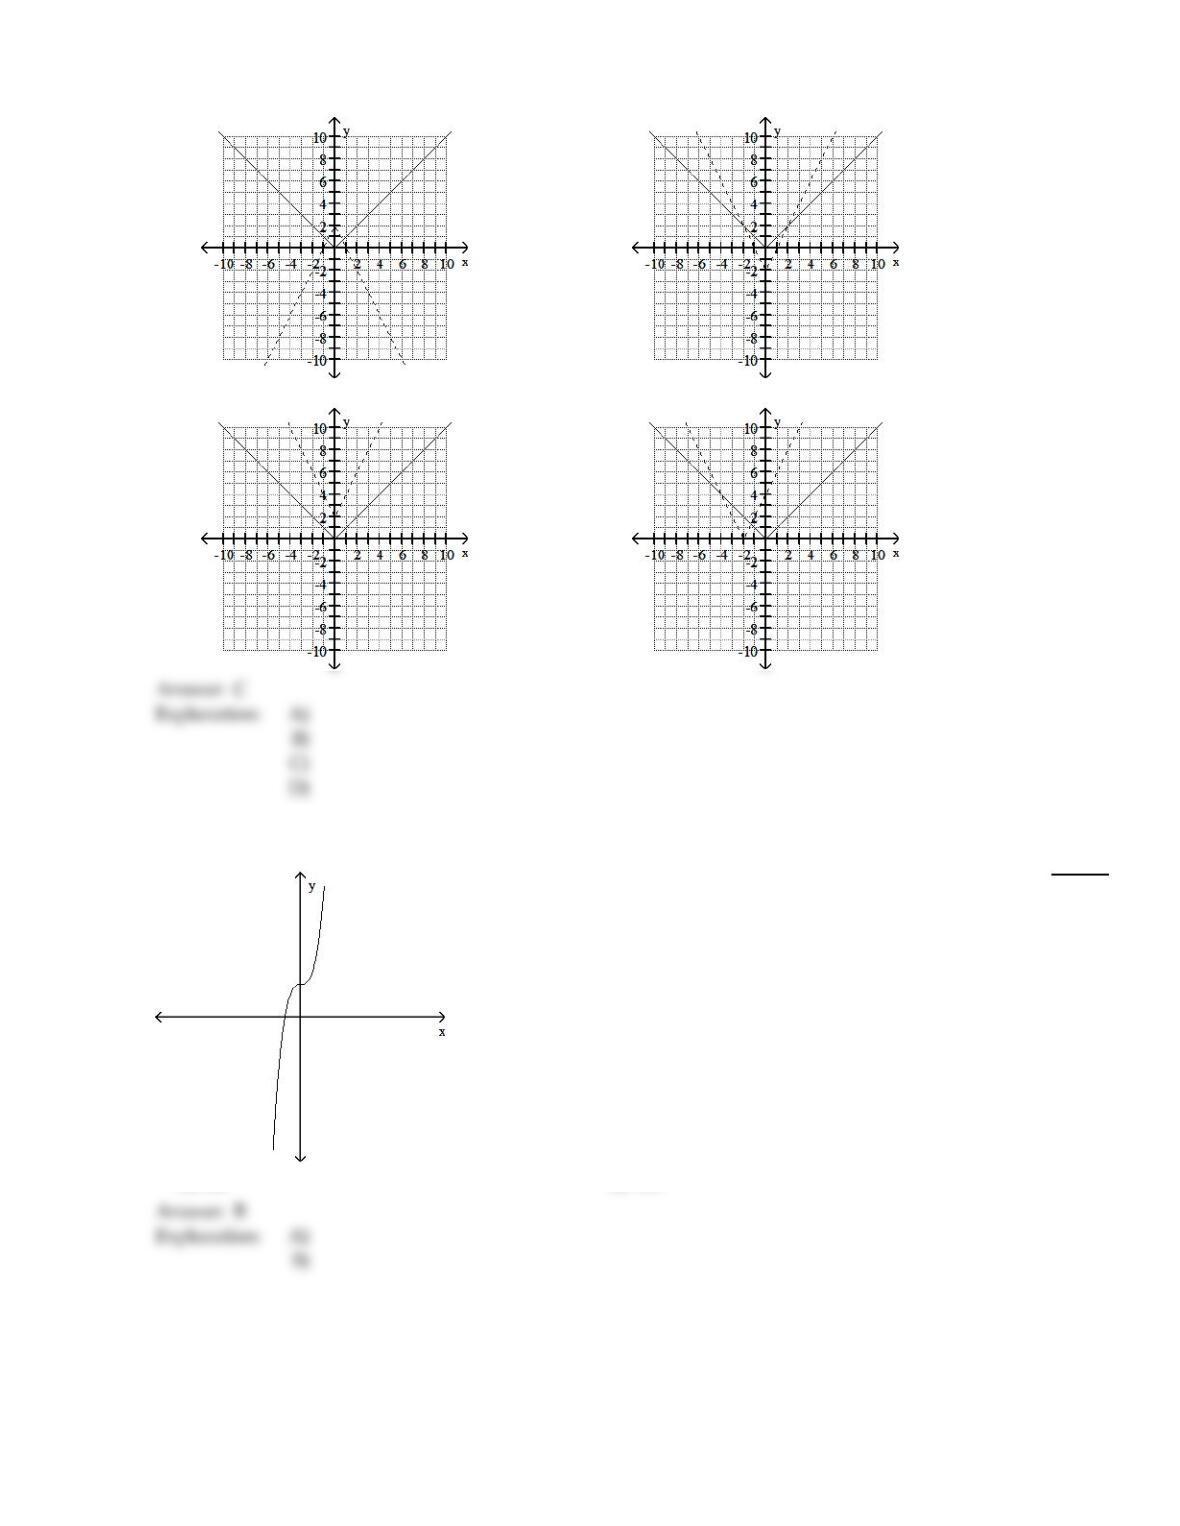
A)
B)
C)
D)
Does the graph represent a function that has an inverse function?
180)
180)
A)
No
B)
Yes
88
Find the inverse of the one–to–one function.
181)
f(x) = – 8x + 8
181)
A)
f–1(x) =
–8x – 8
–8
B)
f–1(x) =y – 8
–8
C)
f–1(x) =x + 8
–8
D)
f–1(x) =x – 8
–8
Graph the equation.
182)
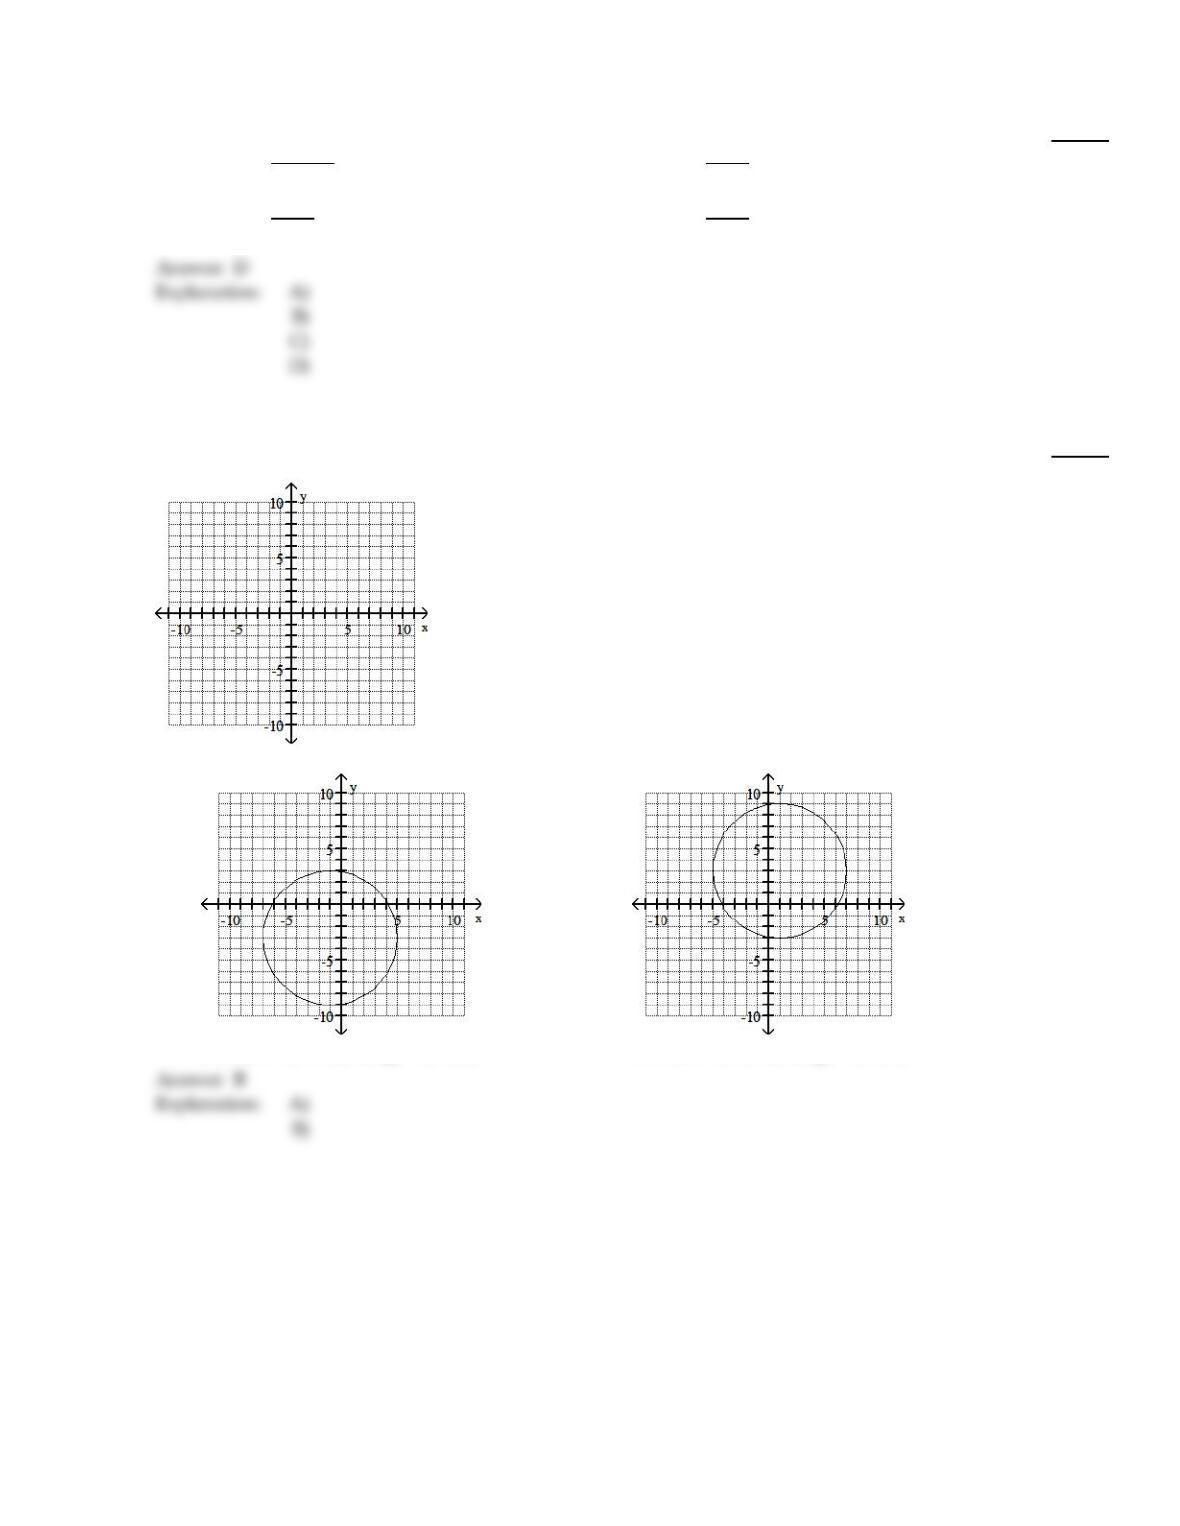
(x – 1)2+ (y – 3)2=36
182)
A)
Domain = (–7, 5), Range = (–9, 3)
B)
Domain = (–5, 7), Range = (–3, 9)
89
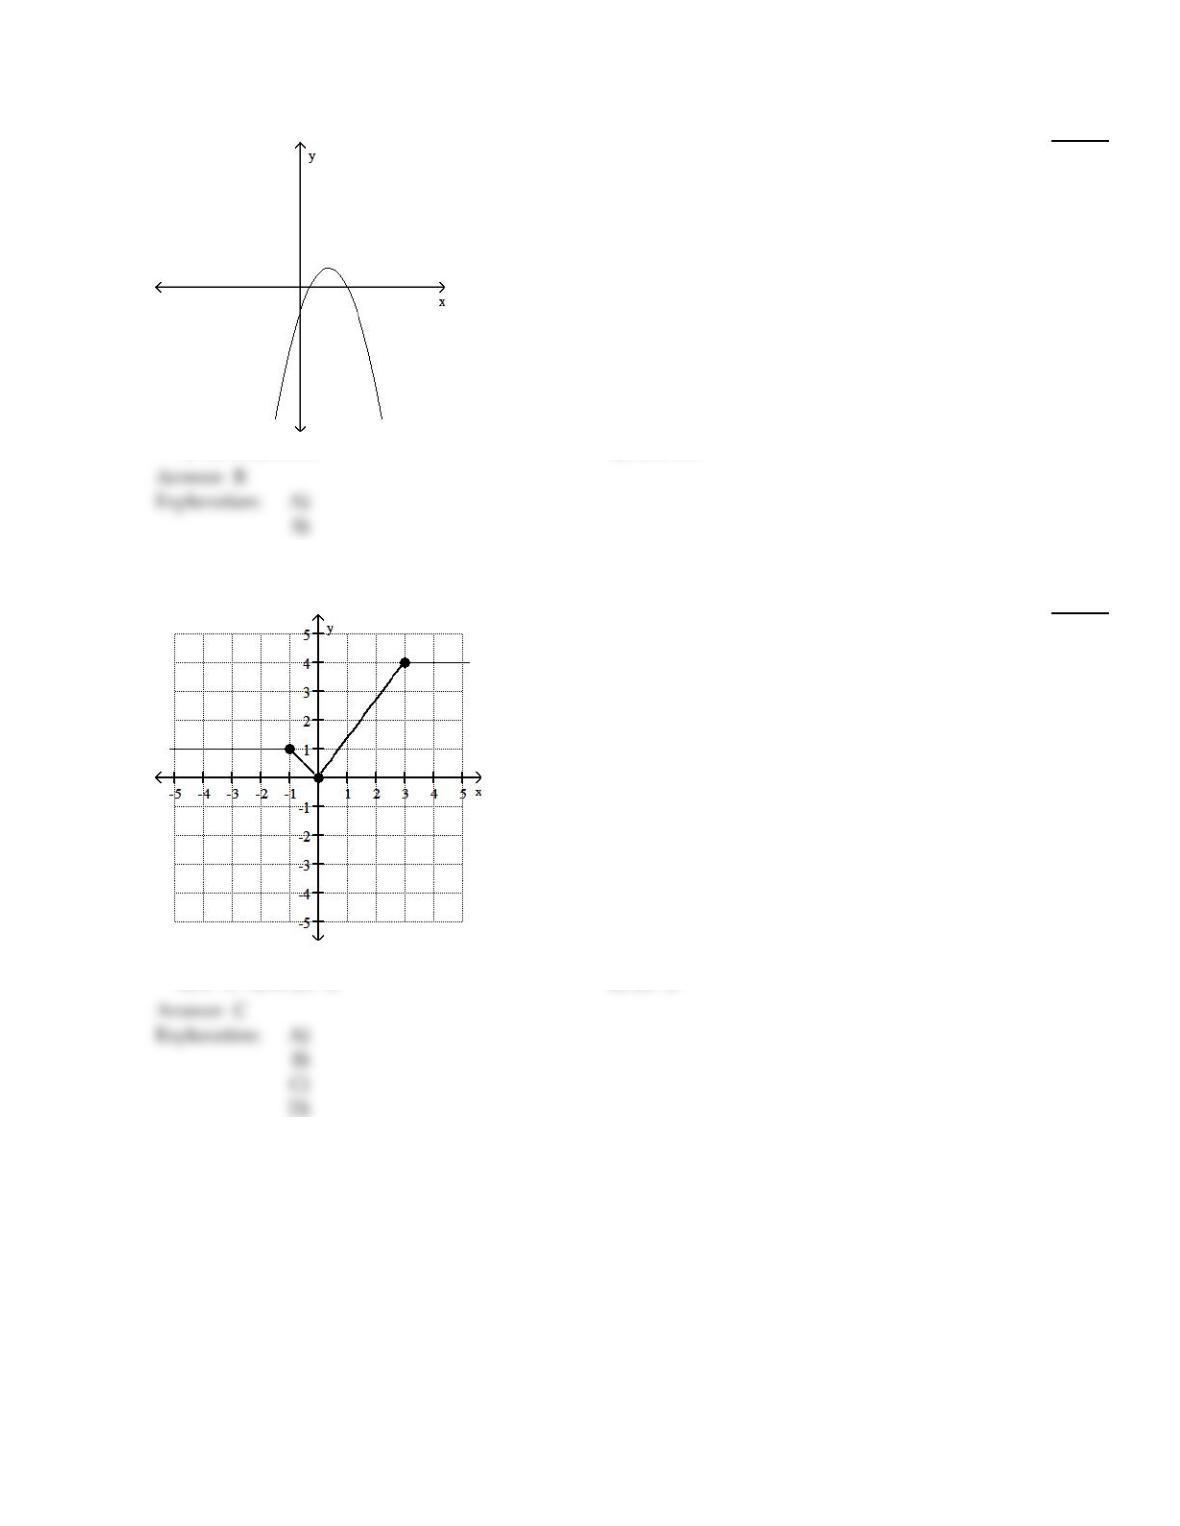
Use the vertical line test to determine whether or not the graph is a graph in which y is a function of x.
183)
183)
A)
not a function
B)
function
Identify the intervals where the function is changing as requested.
184)
Constant
184)
A)
(–, 0)
B)
(–1, 0)
C)
(–, –1) or (3, )
D)
(3, )
C
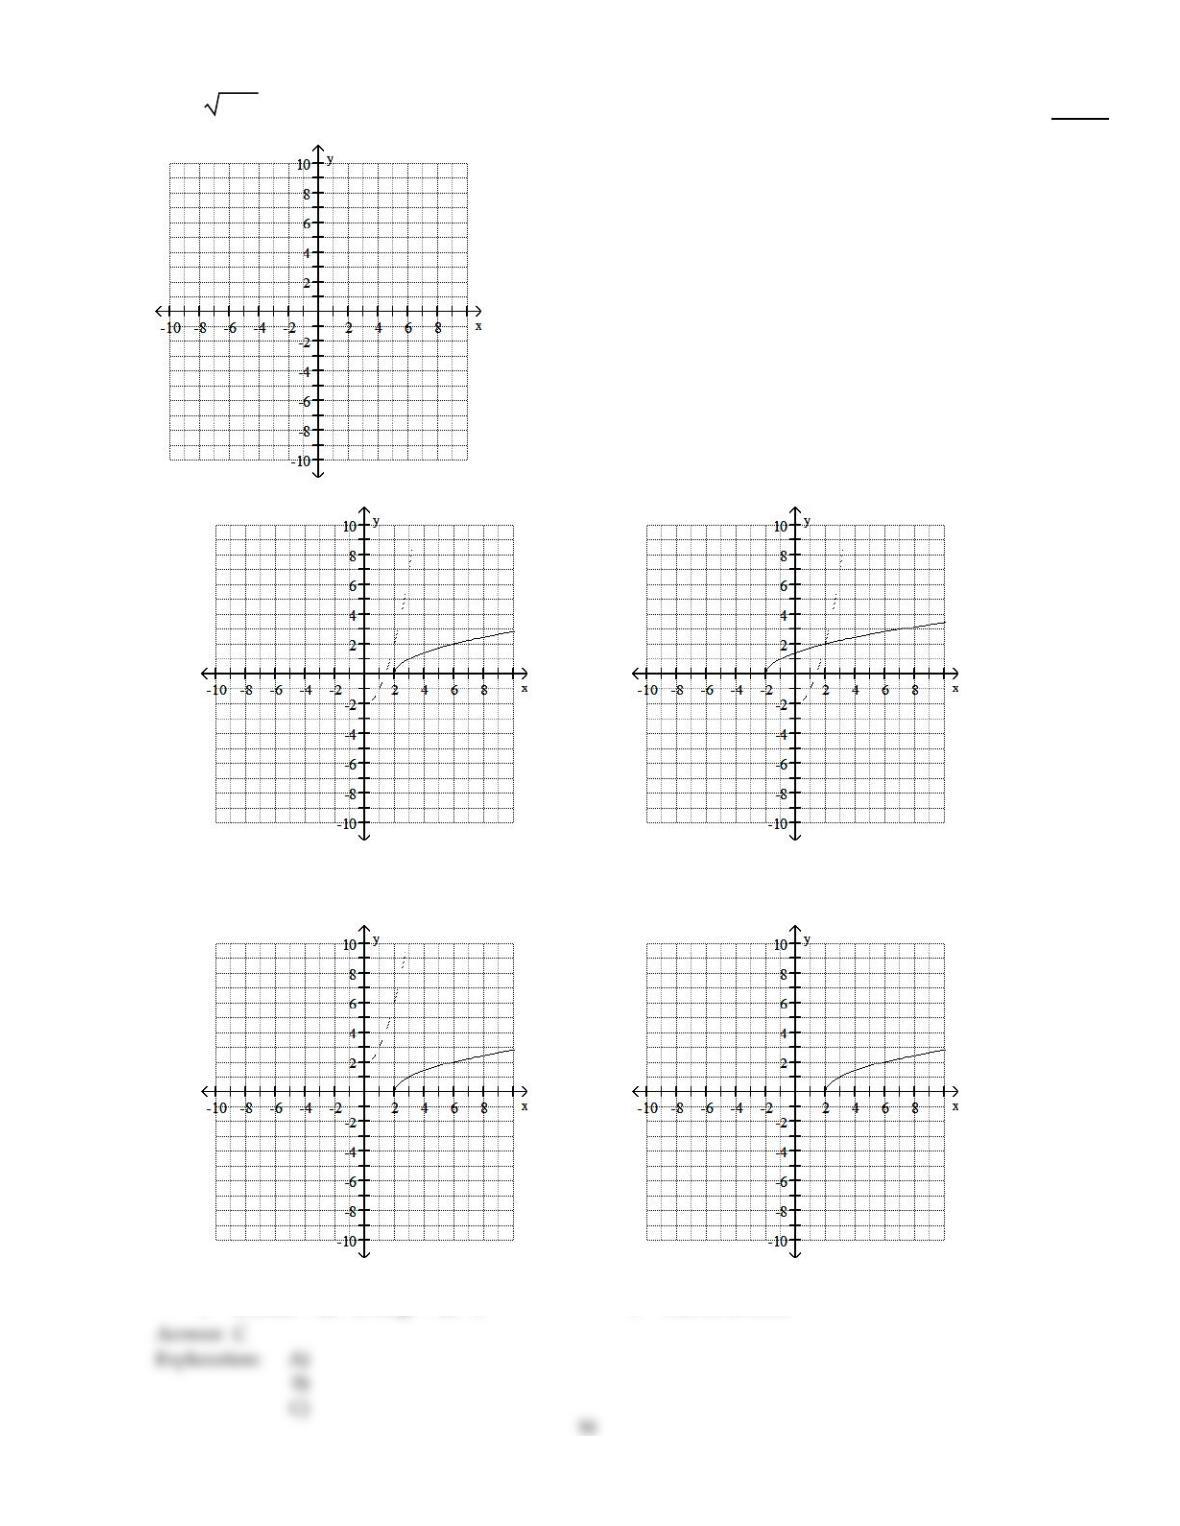
Graph f as a solid line and f–1 as a dashed line in the same rectangular coordinate space. Use interval notation to give the
domain and range of f and f–1.
90
B
185)
f(x) =x –2
185)
A)
f domain = (0, ); range = (2, )
f–1 domain =(–2, ); range = (0, )
B)
f domain = (0, ); range = (–2, )
f–1 domain =(–2, ); range = (0, )
C)
f domain = (0, ); range = (2, )
f–1 domain =(2, ); range = (0, )
D)
f domain = (0, ); range = (2, )
f–1 Has no inverse.
C)
D)
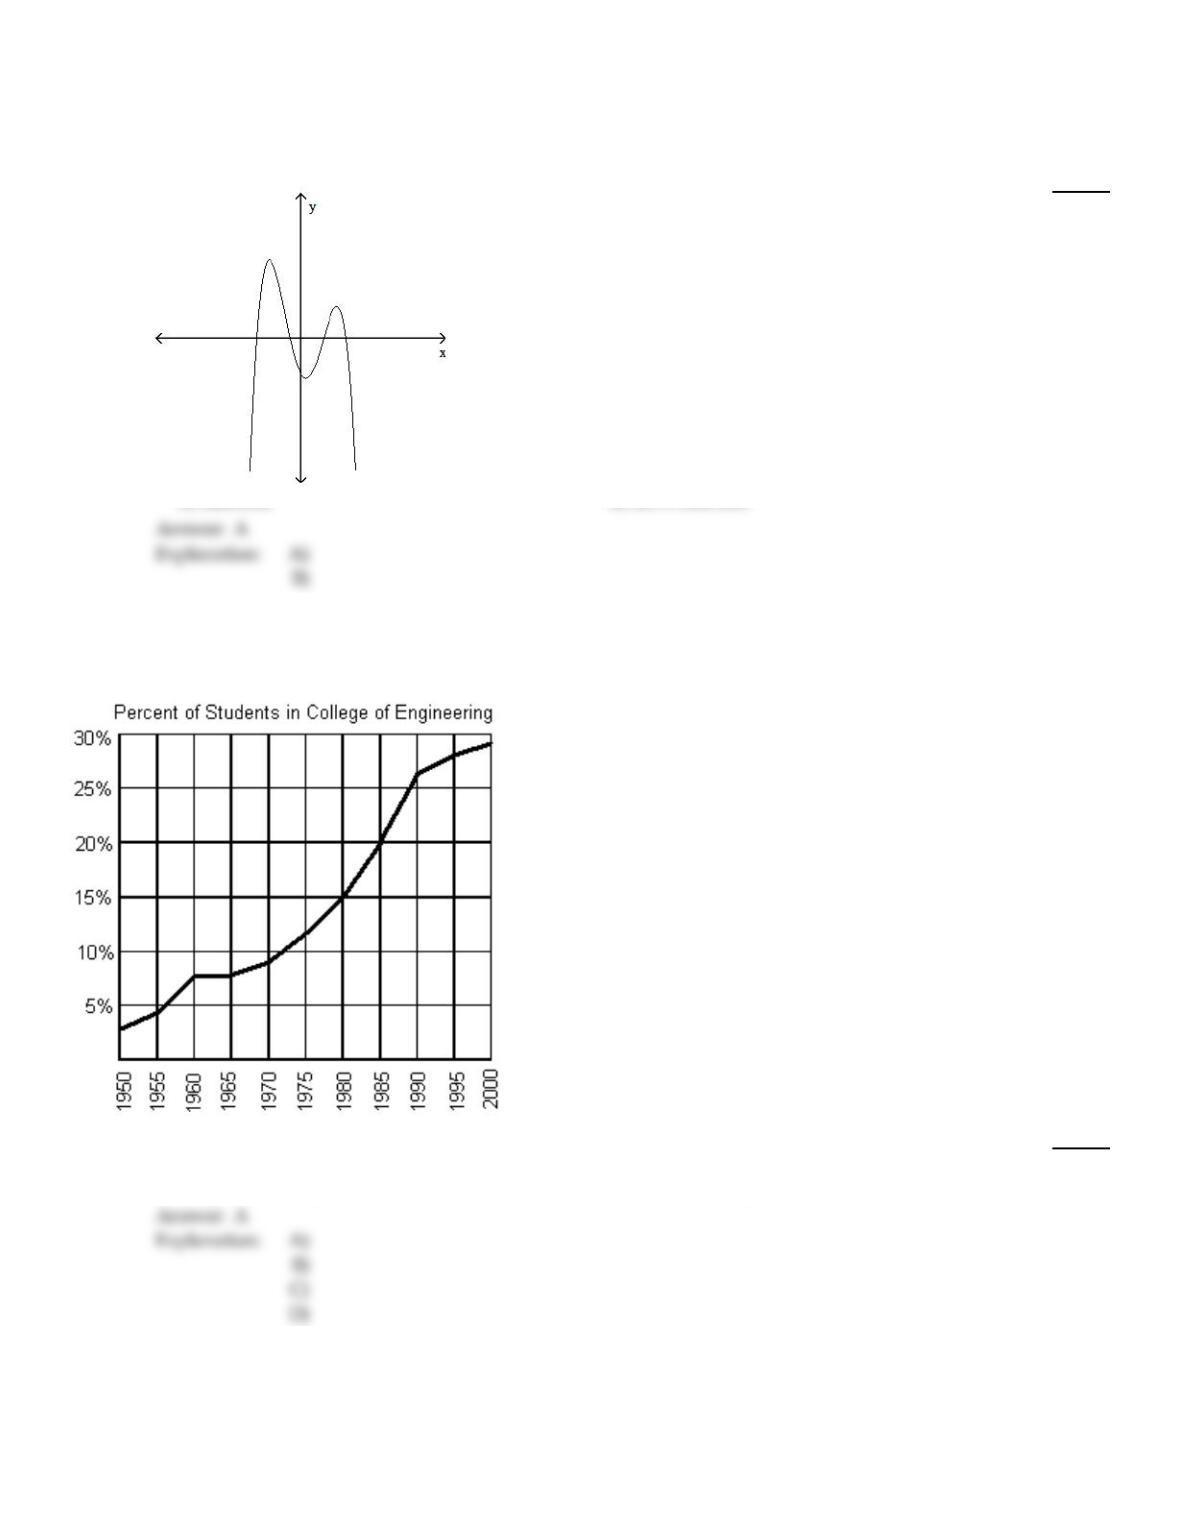
Use the vertical line test to determine whether or not the graph is a graph in which y is a function of x.
186)
186)
A)
function
B)
not a function
The graph below shows the percentage of students enrolled in the College of Engineering at State University. Use the
graph to answer the question.
187)
If f represents the function, find f(1990).
187)
A)
approximately 26%
B)
approximately 22.5%
C)
approximately 28%
D)
approximately 21%
C)
D)
92
Determine whether the equation defines y as a function of x.
188)
xy +9y = 1
188)
A)
y is a function of x
B)
y is not a function of x
Find the slope of the line that goes through the given points.
189)
(–1, 1) and ( 1
2, 4)
189)
A)
2
B)
–1
2
C)
10
3
D)
1
2
A
D)
190)
(7, –6), (–4, –18)
190)
A)
– 8
B)
12
11
C)
11
12
D)
–12
11
B
D)
Begin by graphing the standard function f(x) =x3 Then use transformations of this graph to graph the given function.
191)
h(x) =1
2(–2x)3
191)
93
A