205)
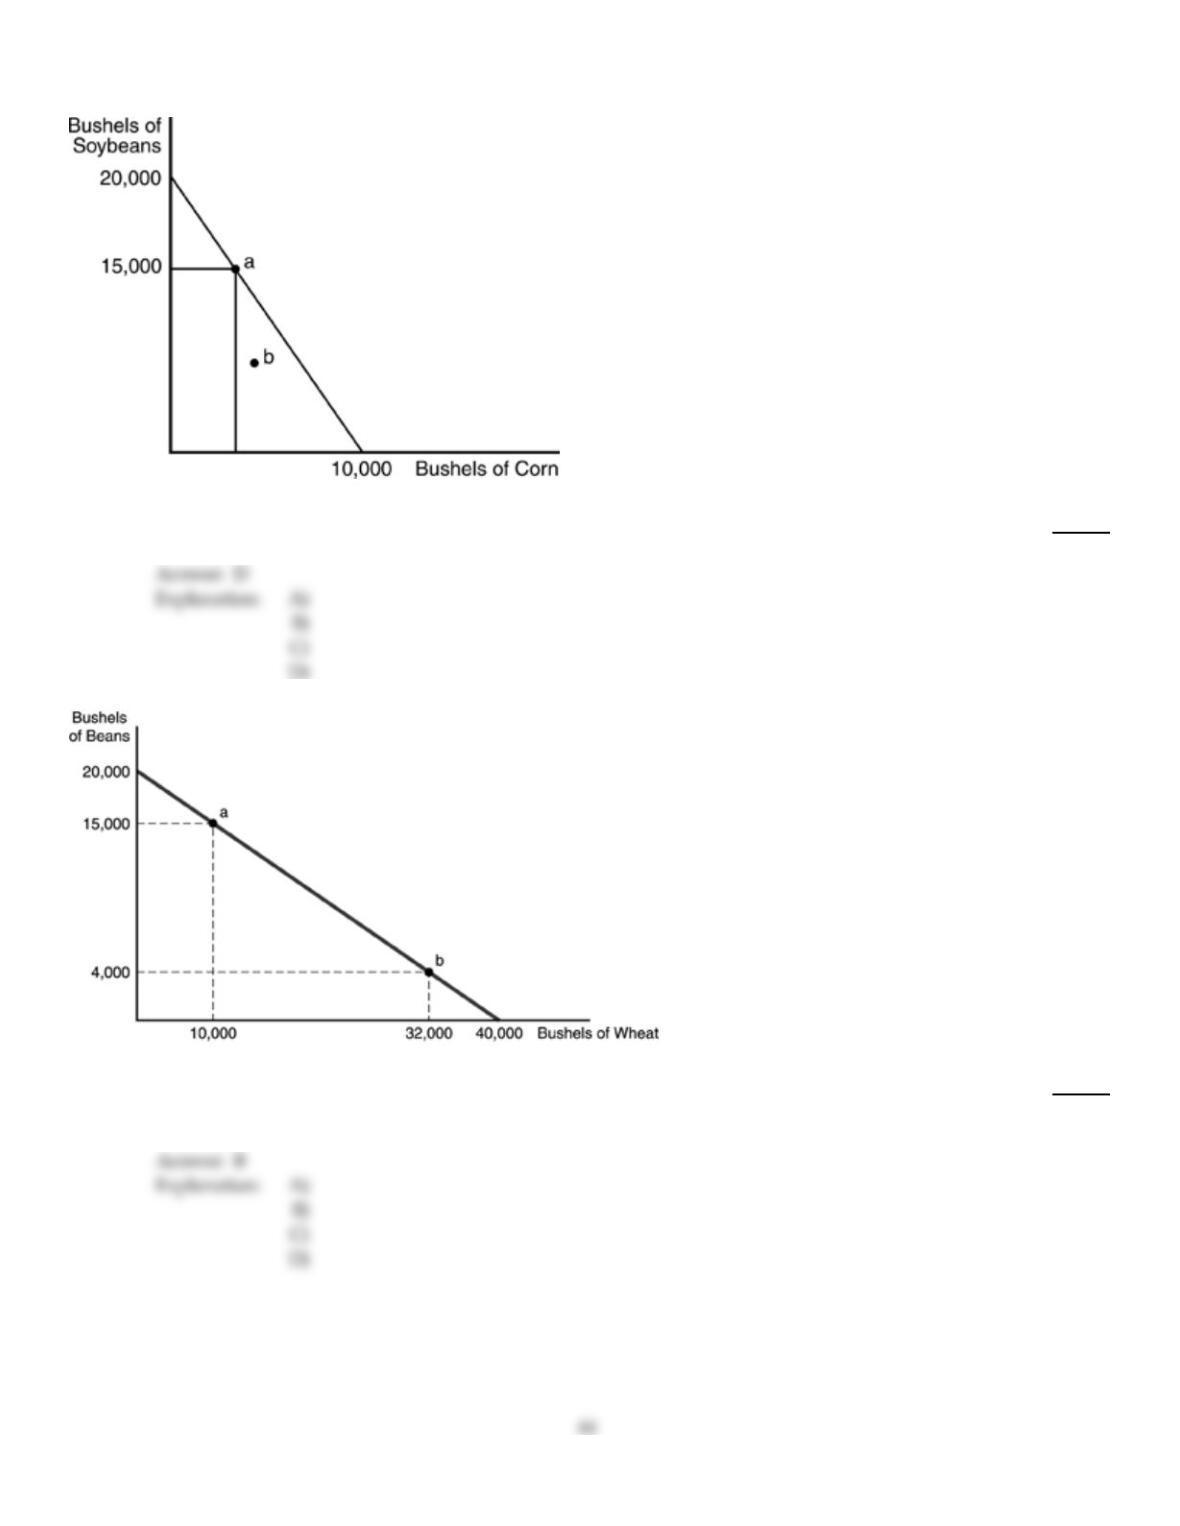
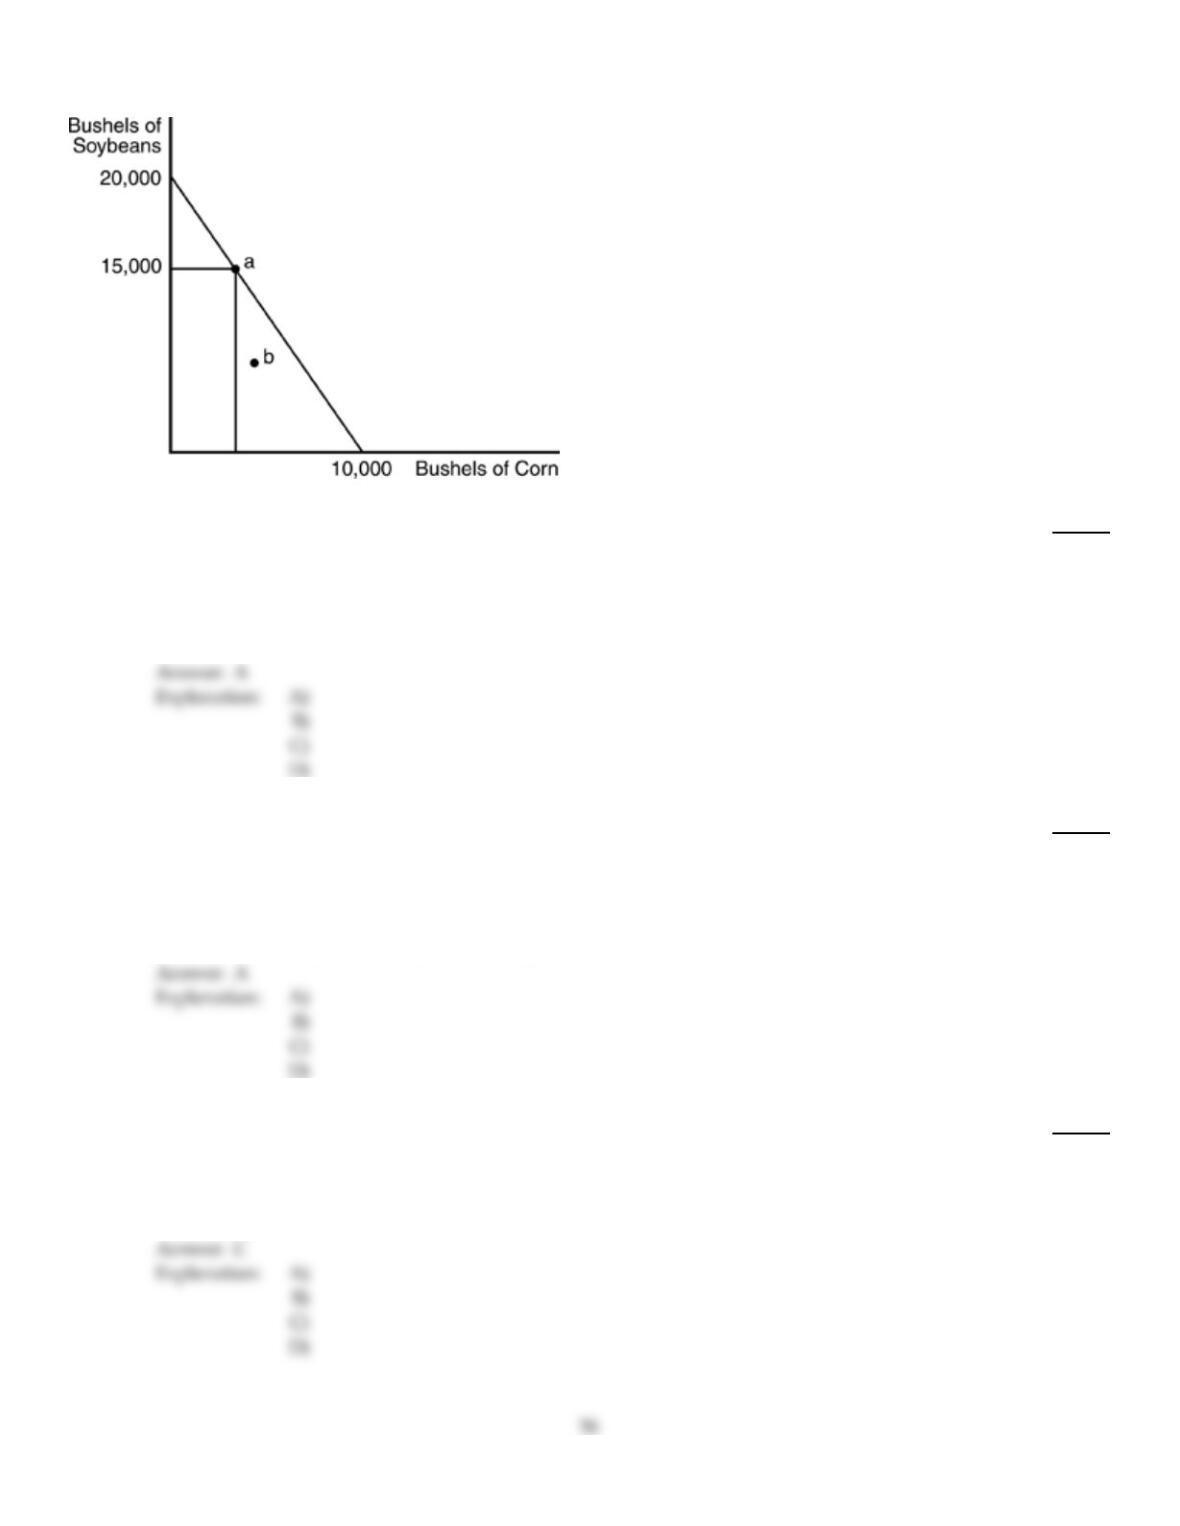
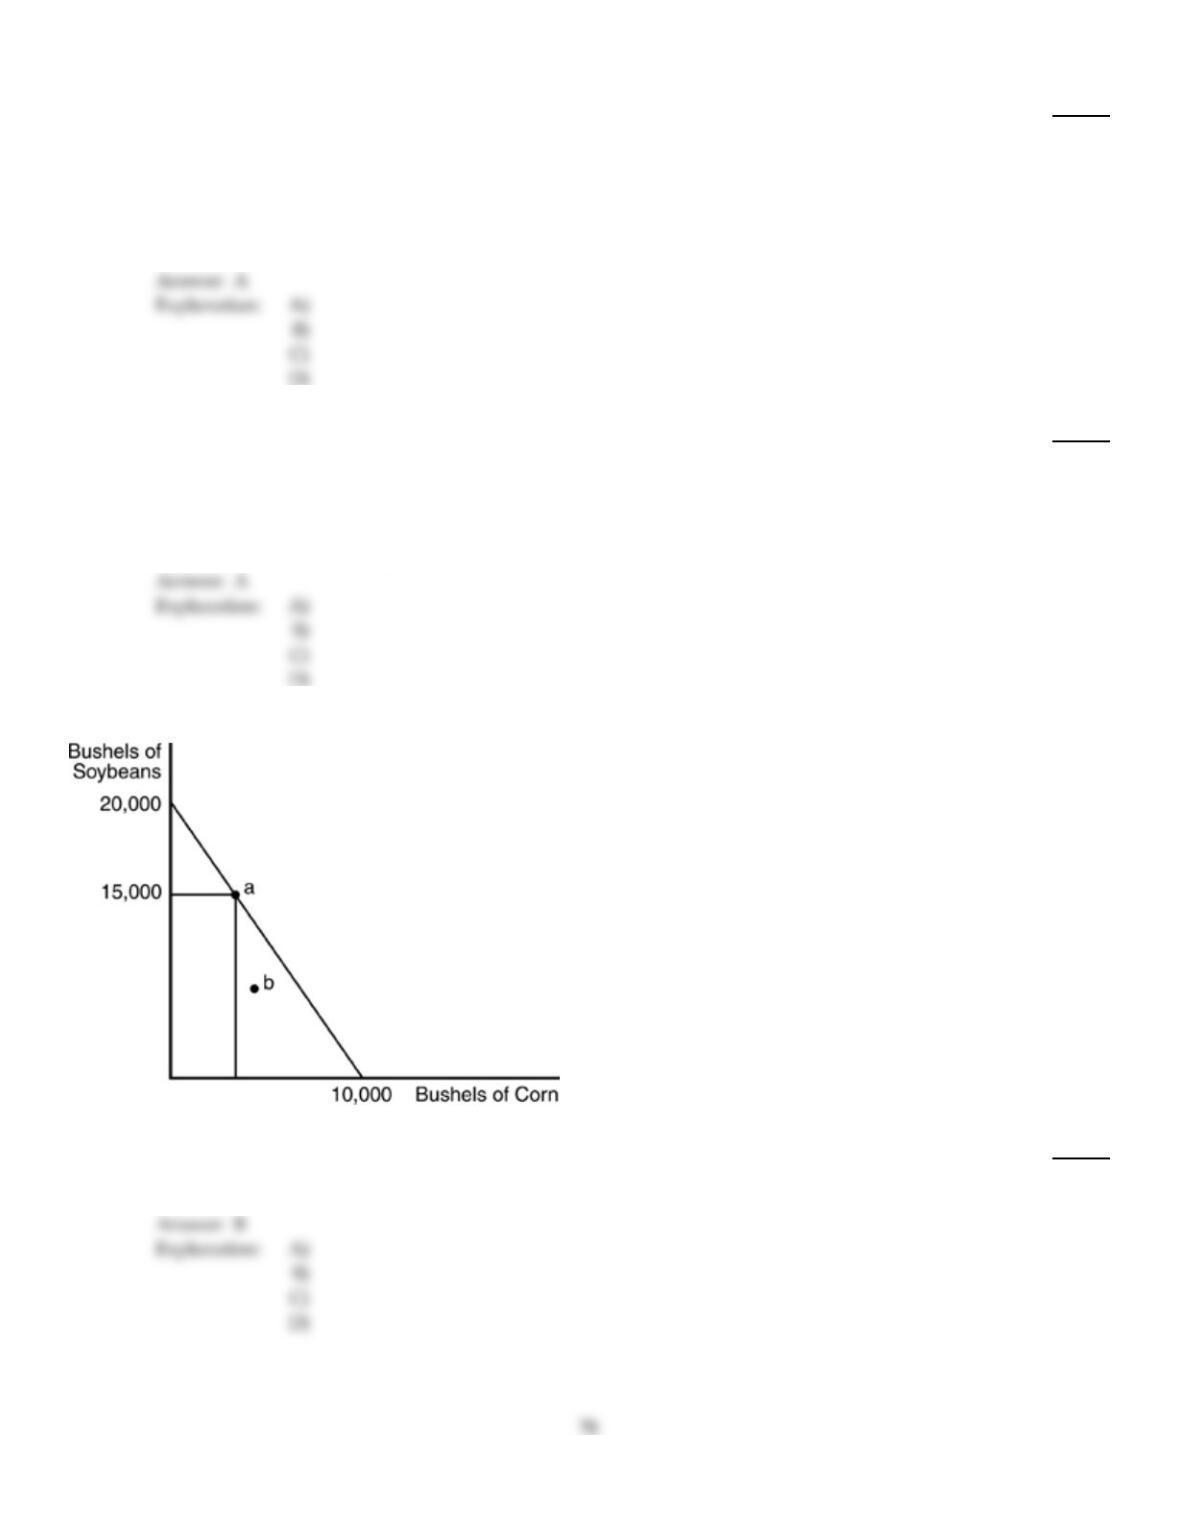
In the above figure, how many bushels of corn are produced at point “a”?
205)
A)
10,000
B)
1,000
C)
0
D)
2,500
206)
The above figure is referred to as a(n)
206)
A)
trade–off curve.
B)
production possibilities curve.
C)
opportunity curve.
D)
scarcity–shortage curve.
207)
The text argues that if avocado growers in Mexico can produce avocadoes cheaper than avocado
growers in the United States, this will not reduce total jobs available in the United States. The logic
underlying this argument is that
207)
A)
avocado growers in Mexico need the jobs more than Americans do.
B)
avocado growers in the United States did not earn much anyway.
C)
avocado growers in the United States are welcome to emigrate to Mexico.
D)
avocado growers in the United States will switch to specializing in a crop in which they hold
the comparative advantage.
208)
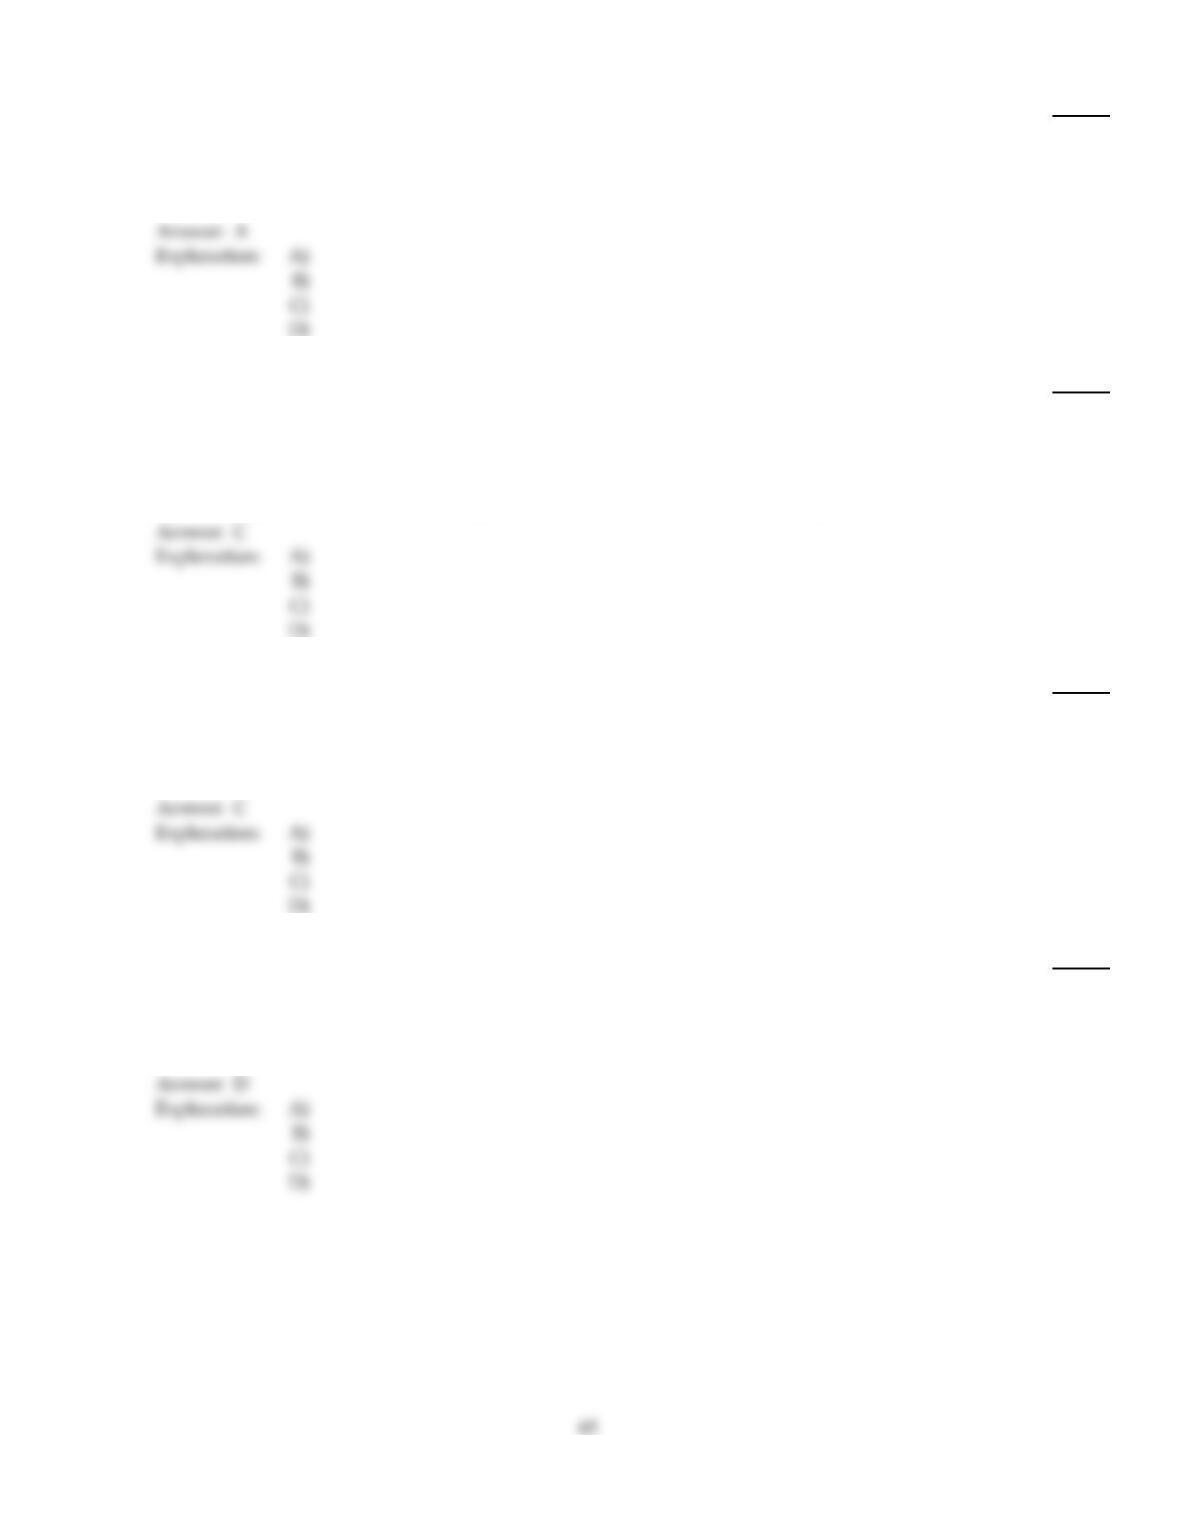
In the above figure, the combination of computers and televisions shown by point x
208)
A)
can be attained only if some of society’s resources are unemployed.
B)
is not attainable at the point in time for which the graph is drawn.
C)
suggests that the law of increasing relative costs does not hold.
D)
results only because society allocates its resources inefficiently.

209)
Opportunity cost is defined as
209)
A)
the least–costly means to produce output.
B)
the value of the output currently received by an individual or a corporation.
C)
the return from a given unit of labor.
D)
the value of the next–best alternative that must be sacrificed to attain a want.
210)
The president of the United States promises that the nation’s economy will simultaneously produce
more defense goods without any decreases in the production of other goods. Under which of the
following conditions could such a promise be valid?
210)
A)
if the United States were producing to the right of its production possibilities curve
B)
if the United States were producing inside its production possibilities curve
C)
if the United States were producing at a point on its production possibilities curve
D)
None of the above; the production possibilities curve must shift to the right.
211)
Which of the following are considered factors of production?
I. Land
II. Labor
III. Physical capital
IV. Entrepreneurship
211)
A)
I and II only
B)
I and III only
C)
I, II and III only
D)
I, II, III and IV
212)
Economic goods are
212)
A)
goods that are scarce, for which the quantity demanded exceeds the quantity supplied at a
zero price.
B)
all imaginable items from which individuals derive satisfaction or happiness.
C)
abundant goods, about which we must constantly make decisions about their best use.
D)
goods that are scarce, for which the quantity demanded exceeds the quantity supplied at any
price.

213)
The accumulated training and education that you have is
213)
A)
physical capital.
B)
economic goods.
C)
entrepreneurship.
D)
human capital.
214)
A man–made resource such as a building or a machine is an example of which resource?
214)
A)
physical capital
B)
human capital
C)
entrepreneurial ability
D)
labor
215)
Efficiency is defined as
215)
A)
the maximum consumption of goods.
B)
arriving at one’s destination quickly.
C)
the production of goods and services.
D)
production of output at minimum cost.
216)
Two factories make wooden chairs. If the workers in factory A make each chair from start to finish
and the workers in factory B divide labor, one would assume
216)
A)
factory B can take advantage of division of labor and produce more efficiently.
B)
factory A can take advantage of division of labor and produce more efficiently.
C)
the workers in factory B have more job satisfaction.
D)
the chairs in factory A are of higher quality.
217)
Division of labor refers to
217)
A)
separating union workers from nonunion workers.
B)
dividing tasks up into several subtasks and having one person perform these subtasks in a
certain order.
C)
the separation of hourly workers from salaried workers.
D)
assigning different workers to different tasks.
218)
A production possibilities curve will shift inward
218)
A)
when a war destroys the capital goods of a country.
B)
when production is inefficient.
C)
when the unemployment rate increases.
D)
when resources are expanding.
219)
John and Mary work at a bakery. John can decorate either 10 ice–cream cakes or 4 wedding cakes;
Mary can decorate either 8 ice–cream cakes or 2 wedding cakes. According to this scenario
219)
A)
the opportunity cost of decorating an ice–cream cake for John is 2.5 wedding cakes.
B)
the opportunity cost of decorating an ice–cream cake for John is 1/4 wedding cake.
C)
the opportunity cost of decorating an ice–cream cake for John is 2/5 wedding cake.
D)
the opportunity cost of decorating an ice–cream cake for John is 4 wedding cakes.
C
220)
Opportunity cost is
220)
A)
based on the intrinsic value of the good itself.
B)
the combined value of all the alternatives not selected.
C)
the value of the next best alternative which was given up.
D)
the same thing as the money price of a good.
C
221)
Which of the following is NOT an assumption used in deriving a production possibilities curve?
221)
A)
Resources are fully employed.
B)
Technology is constant.
C)
The quantity of resources is constant.
D)
The labor force is growing at a constant rate.
D
A
222)
Opportunity cost is best defined as
222)
A)
the cost of producing the purchased goods.
B)
the sum of the dollar values of all alternatives given up when choices are made.
C)
the dollar price of the purchased item.
D)
the next highest valued alternative when a choice is made.
223)
If a country’s production possibilities curve gets more bowed out over time, it is an indication that
223)
A)
technological change has taken place.
B)
the quantity of labor and capital have increased.
C)
resources have become more highly specialized.
D)
society is learning to use its resources more efficiently.
224)
With specialization
224)
A)
society is more productive while individuals are less productive.
B)
there are greater gains in material well being.
C)
opportunity costs tend to be constant.
D)
there is more emphasis on self–reliance.
225)
To have more consumer goods in the future, we must
225)
A)
lower current income.
B)
stop producing all goods today.
C)
get government involved in the production process.
D)
produce more capital goods today.
226)
In economics, international trade is based on the existence of
226)
A)
relative advantage between countries.
B)
absolute advantage between countries.
C)
output advantage between countries.
D)
comparative advantage between countries.
227)
John has decided to view the solar eclipse tomorrow. The eclipse is an example of
227)
A)
a good.
B)
a service.
C)
an economic good.
D)
entrepreneurship.
228)
Economists define technology as
228)
A)
entrepreneurship.
B)
society’s knowledge concerning the production of goods.
C)
absolute advantage.
D)
machines such as computers.
229)
Scarcity implies that
229)
A)
no person’s wants can be satisfied.
B)
the satisfaction of one person’s want means another person’s want can also be satisfied.
C)
the satisfaction of one person’s want means another person will be more than satisfied.
D)
the satisfaction of one person’s want means another person‘s want cannot be satisfied.
230)
The division of labor refers to
230)
A)
the separation of blue–collared workers and white–collared workers.
B)
the assignment of different workers to different tasks.
C)
finding the best order of performing tasks.
D)
the separation of workers into union workers and non–union workers.
231)
Economic goods are items that
231)
A)
cannot be sold at any price in the market.
B)
provide satisfaction to users.
C)
individuals would pay to get rid off.
D)
are used only by economists.
B
232)
Scarcity is
232)
A)
a situation in which the resources for producing the goods and services that people desire are
sufficient to satisfy people’s desires.
B)
poverty and misery.
C)
a situation in which the resources required to produce the goods and services that people
desire are insufficient to satisfy all wants.
D)
a shortage of goods and services.
C
233)
Whenever productive resources are used to make capital goods
233)
A)
absolute advantage occurs.
B)
society is not producing efficiently.
C)
society is giving up current consumption.
D)
the production possibilities curve becomes flatter.
C
B
234)
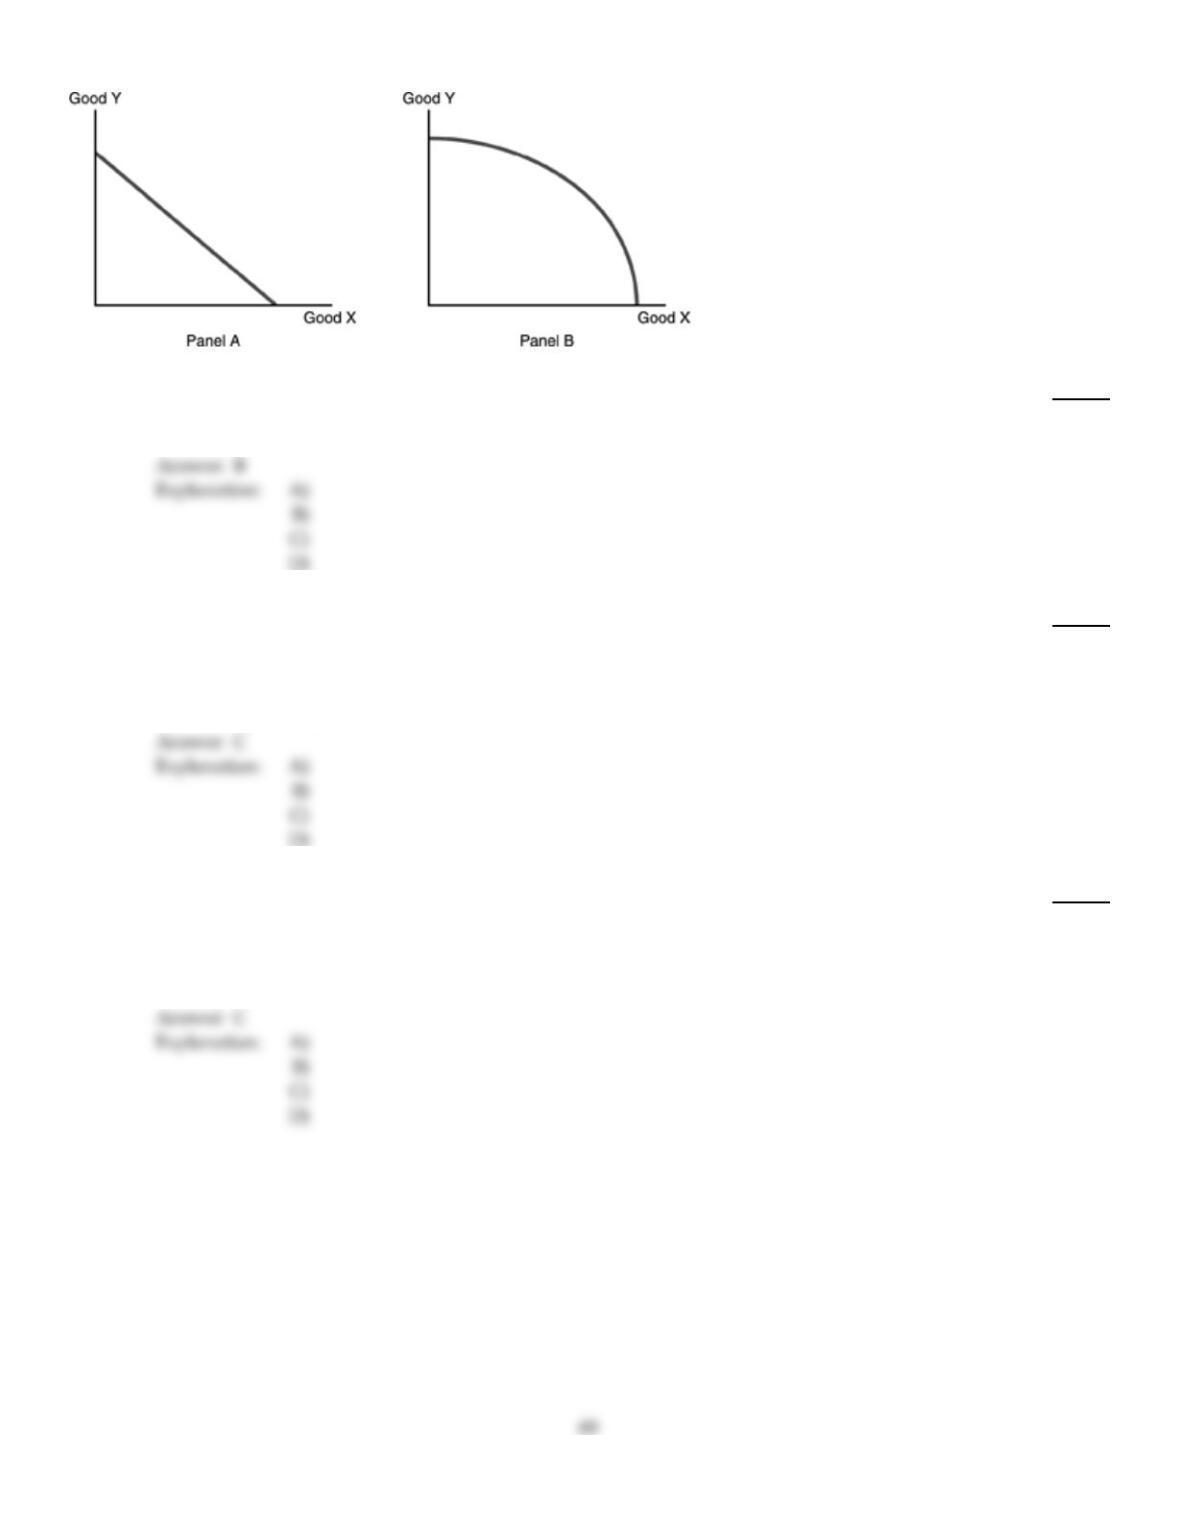
Refer to the above figure. The Law of Increasing Additional Costs applies in
234)
A)
Panel A only.
B)
Panel B only.
C)
Panels A and B.
D)
neither Panel A nor B.
235)
Scarcity is
235)
A)
represented by long lines at stores.
B)
a situation of shortage after a hurricane.
C)
a permanent human condition relative to the nearly limitless nature of human desires.
D)
the same thing as poverty.
236)
Which of the following would result in a movement along the production possibilities curve?
236)
A)
population growth
B)
growth in the capital stock
C)
a change in the outputs of two goods that a society chooses to produce
D)
a fall in the unemployment rate
237)
If the farmer is producing 5000 bushels of soybeans at point “b” in the above figure, we know that
237)
A)
the farmer is not using his resources efficiently.
B)
the farmer is using his resources efficiently.
C)
the farmer must be using more land than was used in constructing the production
possibilities curve.
D)
the farmer is using his land to produce a crop other than soybeans or corn.
238)
Scarcity and shortages differ in that
238)
A)
scarcity is a condition of human life while shortages are usually temporary phenomena
related to an imbalance between the amount desired and the amount produced.
B)
shortages apply to resource markets while scarcity applies to product markets.
C)
scarcity is caused by natural disasters and shortages are caused by mistakes people make.
D)
scarcity is a type of shortage but shortage is a broader concept.
239)
Technology is best defined as
239)
A)
the maximum output that can be obtained from a stock of physical capital.
B)
output inside the production possibilities curve.
C)
society’s pool of applied knowledge concerning the production of goods and services.
D)
the utilization of more resources for the same amount of production.

240)
The discovery of new natural resources will cause
240)
A)
the economy to move closer to the production possibilities curve.
B)
the production possibilities curve to shift up and to the right.
C)
the curve to shift back and to the left.
D)
an upward movement along the curve.
241)
The production possibilities curve represents the maximum feasible production combinations
resulting from
241)
A)
the mix of current resources that utilizes all available inputs using current technology.
B)
the lack of trade–offs in production.
C)
a fixed amount of demand by consumers.
D)
the lack of technology used in production.
242)
How does an economy represented by a straight–line production possibilities curve differ from one
represented by a traditional production possibilities curve with a bowed shape?
242)
A)
In the economy represented by a straight–line production possibilities curve, the law of
increasing relative cost does not apply.
B)
In the economy represented by a straight–line production possibilities curve, there is no
opportunity cost.
C)
In the economy represented by a straight–line production possibilities curve, changing the
amount of resources devoted to the production of each good will not alter the amount of each
good actually produced.
D)
In the economy represented by a straight–line production possibilities curve, neither good is
scarce.
243)
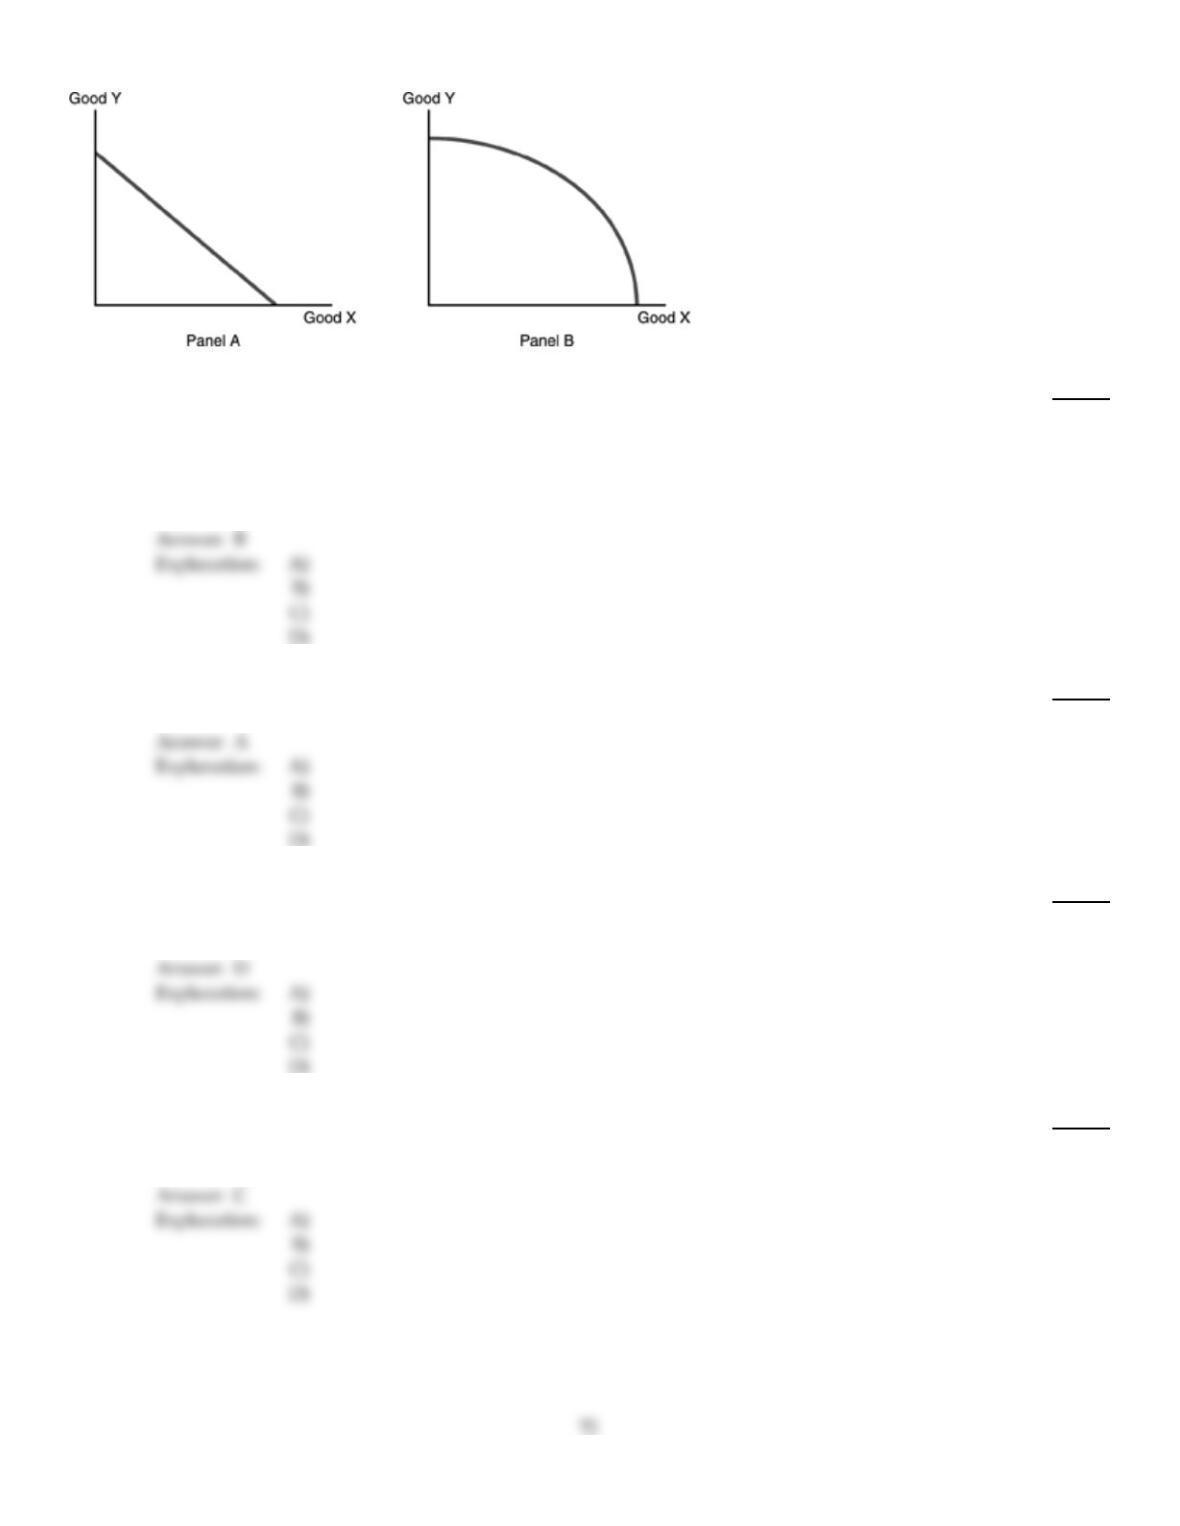
Refer to the above figure. Which of the following statements is TRUE?
243)
A)
Opportunity costs do not apply to Panel A but apply to Panel B.
B)
In Panel A, equal amounts of Y must be given up to obtain equal increments of X while in
Panel B increasingly greater amounts of Y must be given up to obtain equal increments of X.
C)
Panel A does not represent an economy that is producing efficiently while Panel B does.
D)
Panel A represents an economy that has a lower level of technology than Panel B.
244)
Which of the following is NOT an economic good?
244)
A)
garbage
B)
a haircut
C)
a textbook
D)
broccoli
245)
All of the following are assumptions of the production possibilities curve EXCEPT
245)
A)
there is a fixed level of technology.
B)
resources are fully employed.
C)
there is a fixed time period.
D)
there is a fixed demand for the products.
246)
Scarcity affects
246)
A)
only middle income people.
B)
only poor people.
C)
all people.
D)
only rich people.
247)
Division of labor
247)
A)
makes economic goods possible.
B)
increases the amount of capital in the economy.
C)
is not possible for service goods.
D)
leads to an increase in the amount of output in the economy.
248)
If Joey goes surfing for four hours instead of earning $10 per hour for those four hours, his
opportunity cost is
248)
A)
the cost of gasoline used to get to the beach.
B)
$40.
C)
the travel time to the beach.
D)
the good time spent surfing.
B
249)
The existence of scarcity means that
249)
A)
firms will increase their production to eliminate the scarcity.
B)
there are not enough resources to satisfy unlimited human wants.
C)
firms working with the government will allocate resources to eliminate the scarcity.
D)
the government will step in to eliminate the scarcity.
B
250)
Economic bads are items
250)
A)
that individuals desire but which receive social disapproval.
B)
that receive social approval but which governments dislike.
C)
for which the produced quantity is less than the amount desired at a positive price.
D)
for which the desired quantity is less than what nature provides at a zero price.
D
D
251)
The bowed shape of the traditional production possibilities curve reflects the
251)
A)
fact that not all resources are equally well–suited to producing all goods.
B)
problems of inequality.
C)
negative side effects of economic growth.
D)
costs of unemployment.
252)
When an employee at a grocery store scans the price of your items, bags the groceries, and collects
your paper, the individual has provided
252)
A)
a service.
B)
physical capital.
C)
entrepreneurship.
D)
land.
253)
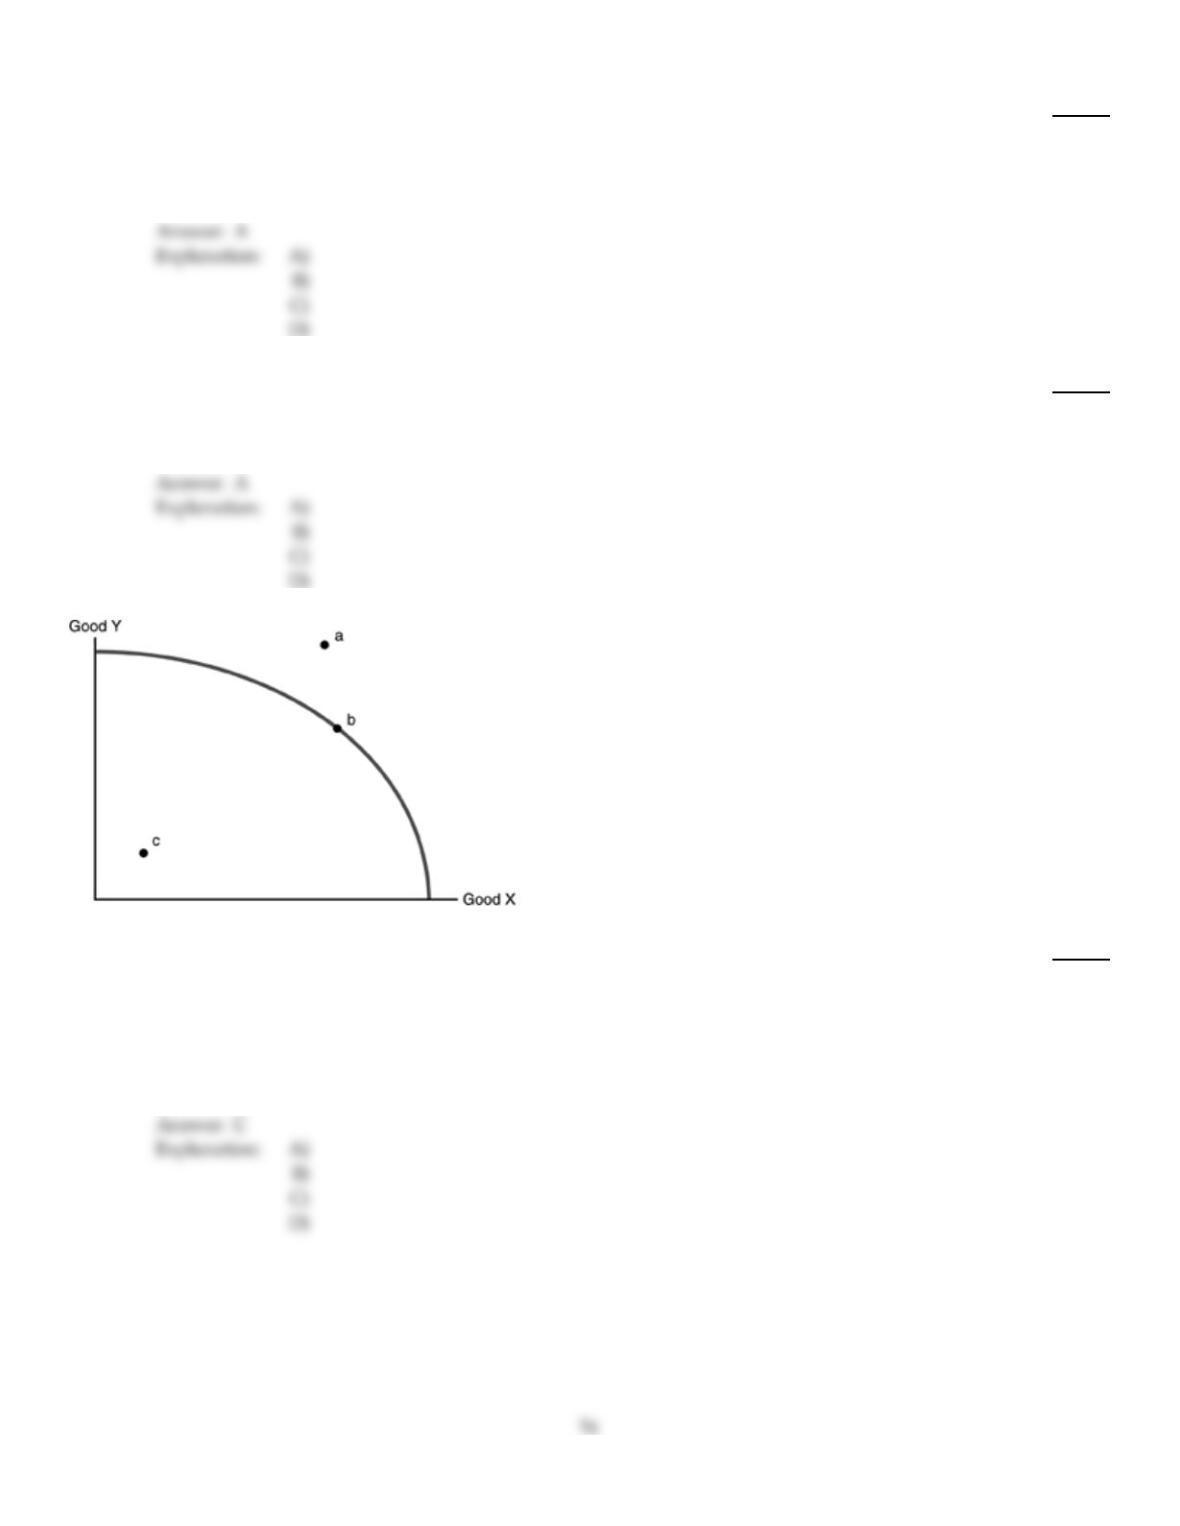
Refer to the above figure. We are currently producing at point c. Which of the following statements
is TRUE?
253)
A)
The Law of Increasing Additional Cost does not hold.
B)
Resources are being efficiently utilized.
C)
Resources are not being efficiently utilized.
D)
The only way to produce more of Goods X or Y is to have an increase in the amount of
resources.
254)
Which factor of production includes water?
254)
A)
land
B)
human capital
C)
physical capital
D)
entrepreneurship
255)
Which of the following is assumed when constructing a production possibilities curve?
255)
A)
resources of a given quality
B)
the efficient use of resources
C)
a fixed amount of resources
D)
All of the above are correct.
Explanation:
256)
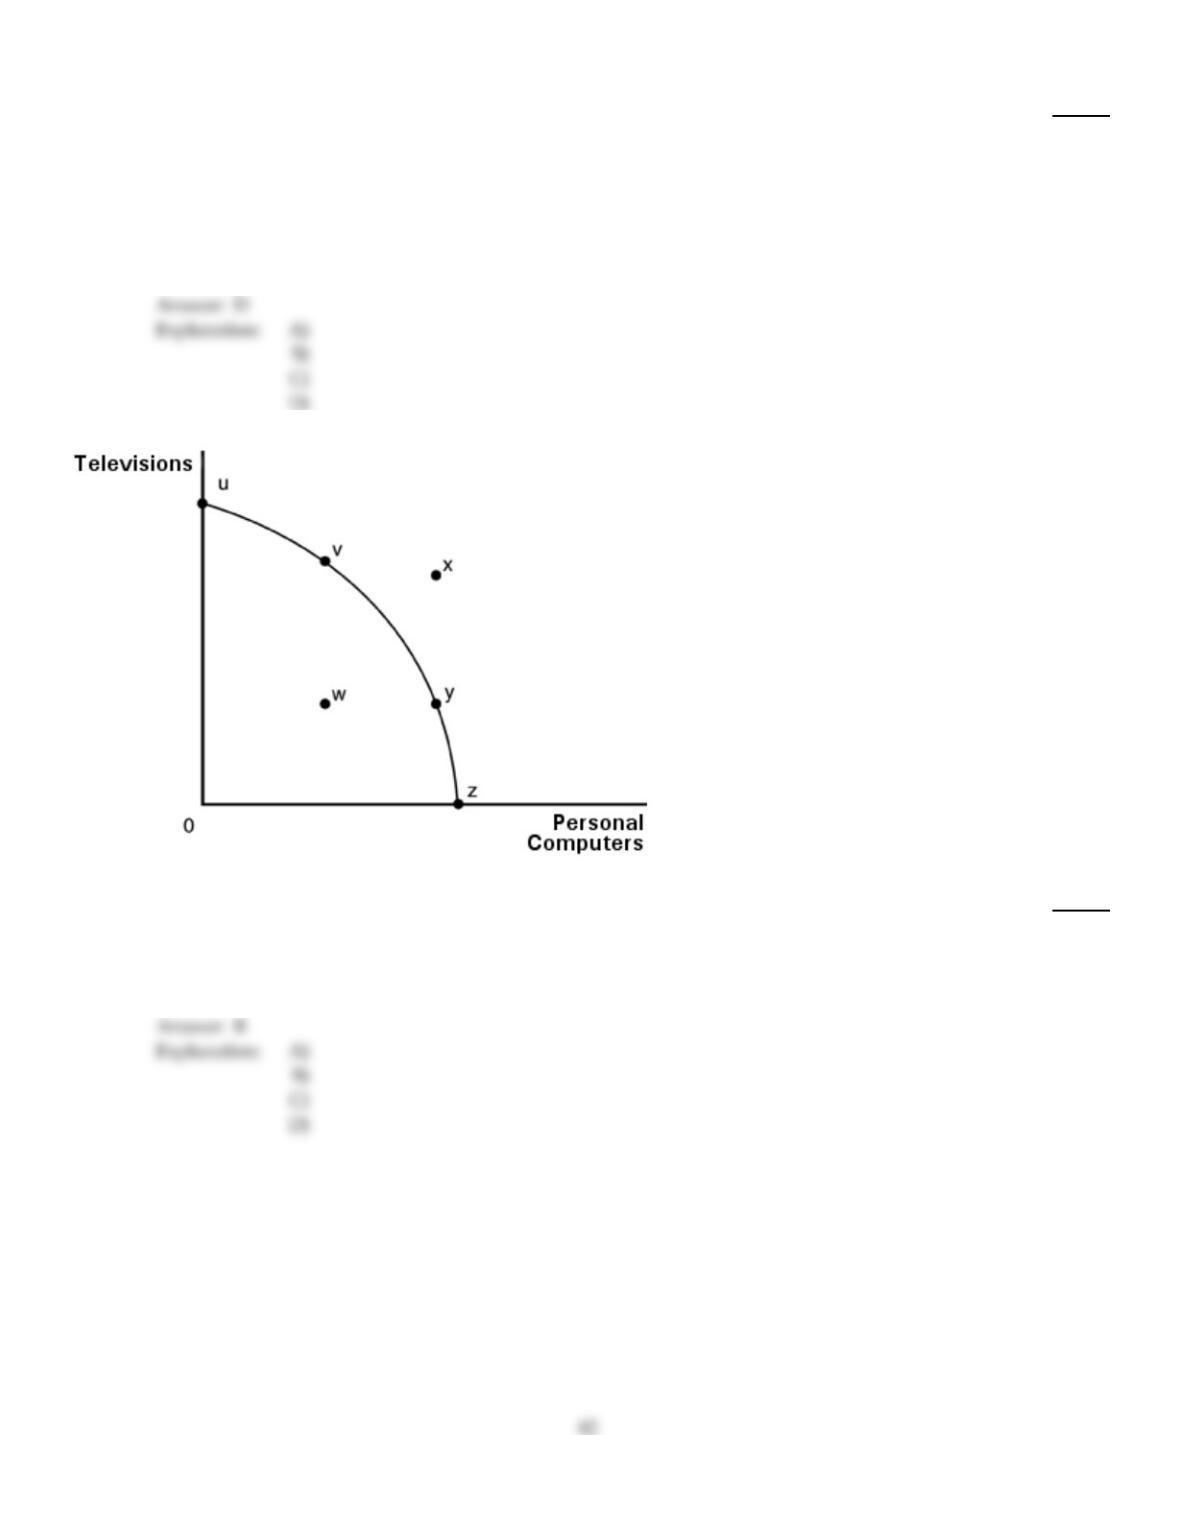
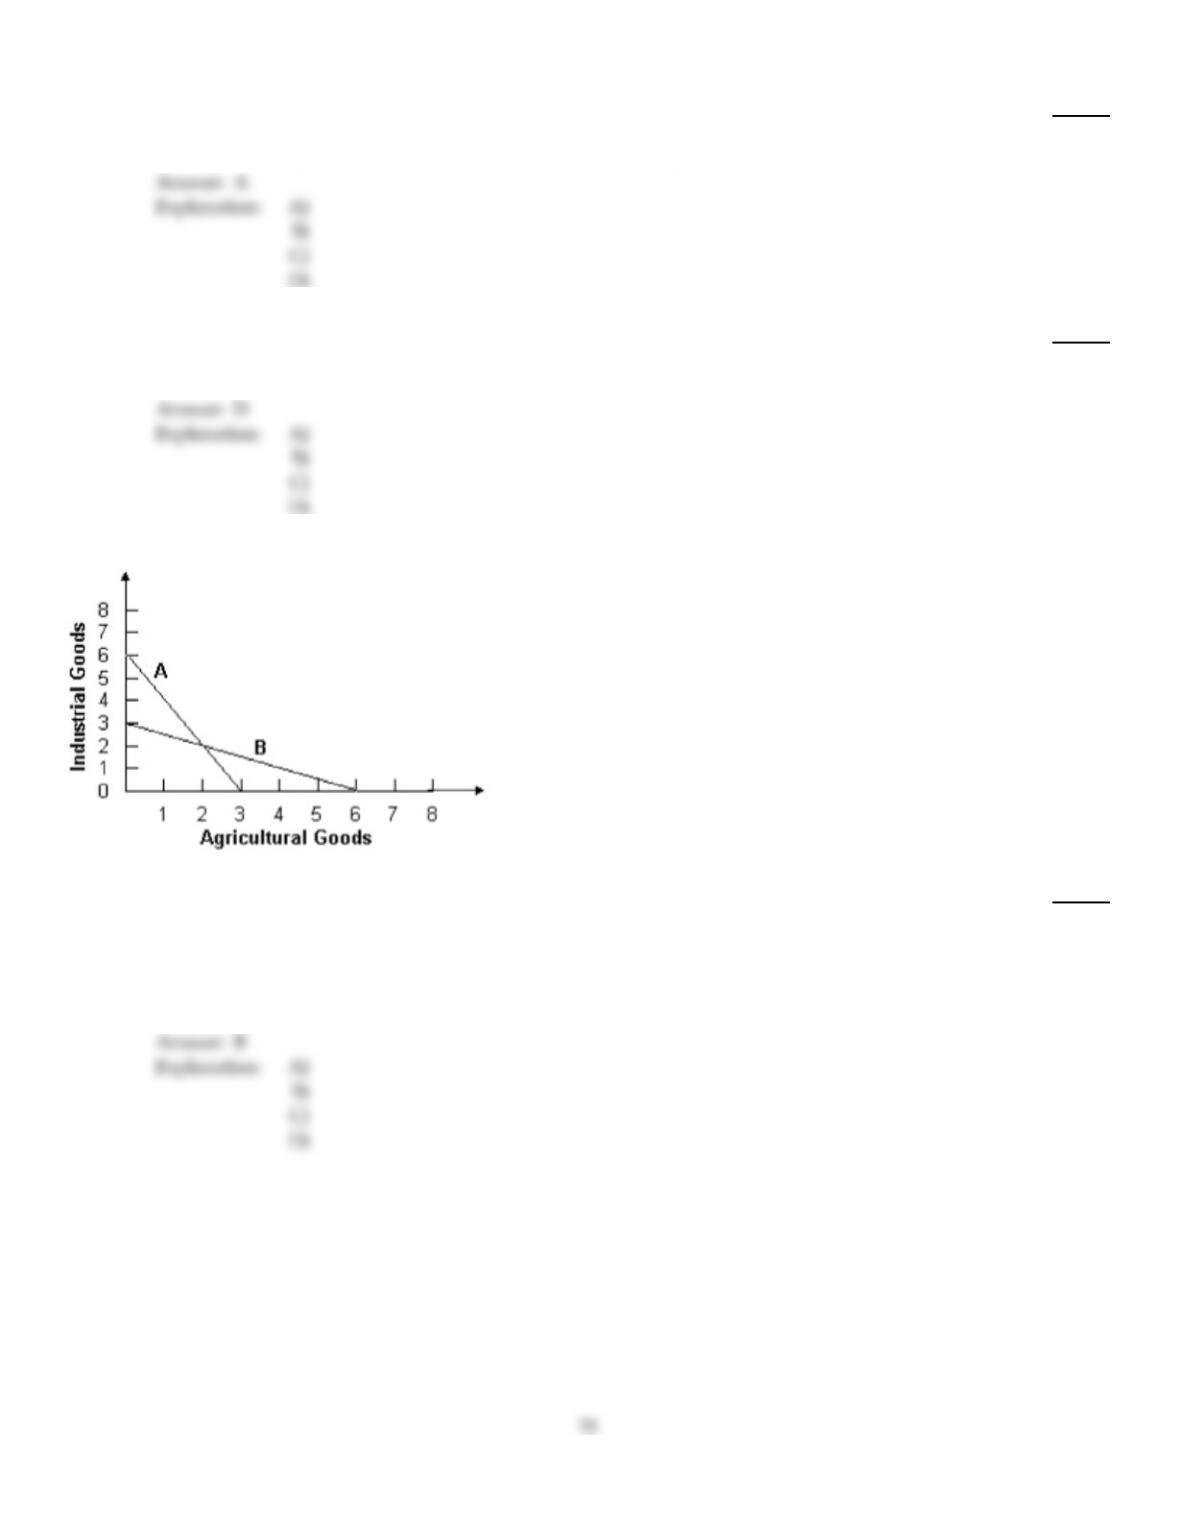
Based on the above figure, if countries “A” and “B” faced the production possibilities curves above,
both countries would benefit if
256)
A)
they both produced both industrial and agricultural goods.
B)
“A” produced industrial goods, and “B” produced agricultural goods.
C)
“B” produced industrial goods, and “A” produced agricultural goods.
D)
they did not trade.
Explanation:
Explanation:
257)
Why do most people choose to specialize in a narrow set of skills for their work, rather than to
learn a little bit about several varied fields of endeavor?
257)
A)
It allows them to earn more income by being more productive.
B)
They don’t correctly perceive the costs of being so specialized.
C)
They are unaware of how much better off they would be if they diversified their skills.
D)
They feel that doing so will minimize their chances of being unemployed.
258)
The production possibilities curve bows out because
258)
A)
of the law of increasing additional cost.
B)
production is efficient.
C)
resources are not being fully utilized.
D)
production is inefficient.
A
259)
The more society consumes today
259)
A)
the harder it will be to consume less in the future because people will find it hard to adjust to
less.
B)
the less society can consume in the future.
C)
the easier it will be to consume less in the future.
D)
the more it consumes next year.
B
260)
Comparative advantage implies choosing the activity that
260)
A)
does not demand any specialization.
B)
has a high opportunity cost.
C)
is inside the production possibilities frontier.
D)
has the lowest opportunity cost.
D
A
261)
All mutually beneficial trades have taken place. This implies that
261)
A)
the production possibilities curve is bowed out.
B)
society is inside the production possibilities curve.
C)
society is on the constant cost portion of its production possibilities curve.
D)
economic efficiency prevails in the society.
262)
A point inside a society’s production possibilities curve represents
262)
A)
a technically superior output combination.
B)
an underutilization of productive resources.
C)
an unattainable combination of outputs.
D)
an output combination that satisfies the needs of the population.
263)
The fact that our wants are unlimited but our resources are limited implies that
263)
A)
we have to make choices.
B)
the only way to make someone better off is to make someone else worse off.
C)
entrepreneurship has failed as an economic system.
D)
we should limit our wants.
264)
Division of labor means that
264)
A)
the labor market in the United States is geographically segmented.
B)
some employees join labor unions and others do not.
C)
the production process is divided into smaller tasks.
D)
management and labor are always in conflict.
265)
The trade–off between the present and future consumption is measured by
265)
A)
the foregone present consumption.
B)
the difference between the money price of present goods and the money cost of producing
them.
C)
the money cost of both the present and future consumption.
D)
the difference between the money price of future goods and the money cost of producing
them.
266)
Which of the following is TRUE about comparative advantage?
266)
A)
Comparative advantage explains trade within nations and among nations.
B)
Comparative advantage explains trade within nations, but not among nations.
C)
Comparative advantage has nothing to do with trade among nations; it only is concerned
with specialization within a firm.
D)
Comparative advantage explains trade among nations, but not within nations.
267)
In the above figure, what is the opportunity cost of one bushel of soybeans?
267)
A)
2 bushels of corn
B)
0.5 bushels of corn
C)
1 bushel of corn
D)
unable to determine

A B C D E
Televisions 100 90 75 55 0
Computers 025 50 75 100
The above table shows the daily production possibilities for a nation.
268)
According to the above table, the opportunity cost of each additional computer in terms of
televisions
268)
A)
increases as more computers are produced.
B)
is meaningless because the cost of computers cannot be expressed in terms of televisions.
C)
remains constant.
D)
falls as more computers are produced.
269)
“My brother is better at cooking, better at cleaning, and better at fixing the car than I am.” Relative
to me, my brother has
269)
A)
a comparative advantage in cooking, cleaning, and car repair.
B)
more income than me.
C)
more intelligence than me.
D)
an absolute advantage in cooking, cleaning, and car repair.
270)
Economic growth is shown by
270)
A)
a point near the top of the production possibilities curve.
B)
an outward shift of the production possibilities curve.
C)
a point outside the production possibilities curve.
D)
an inward shift of the production possibilities curve.
271)
In constructing a production possibilities curve, all of the following are assumed EXCEPT
271)
A)
the time period involved is fixed.
B)
the state of technology is improving.
C)
the quantity and quality of resources being used is fixed.
D)
resources are fully employed.
272)
Which of the following is NOT an example of investment in human capital?
272)
A)
a medical student’s internship
B)
the purchase of a personal computer for playing games
C)
Johnny learns how to read.
D)
A mechanic attends a training workshop on a new type of engine.
273)
If a country increased the production of its capital goods, then
273)
A)
the more consumption of goods we can have today.
B)
the more unemployed resources there will be in the future.
C)
the less consumption we can have today, but we will have more in the future.
D)
the more unemployed resources there are today.
274)
Even though mass transit systems such as buses are available in most cities in the United States,
many residents decide to drive to work in their own vehicles because
274)
A)
they are not aware of the opportunity cost of driving.
B)
there is no opportunity cost of them to drive.
C)
they do not behave according to the economic way of thinking.
D)
the opportunity cost of riding a bus is too high for them.
275)
As an economy moves from point to point along its production possibilities curve, which one of the
following variables changes?
275)
A)
the amount of each good or service produced
B)
the total amount of resources employed
C)
the time frame under consideration
D)
the level of technology