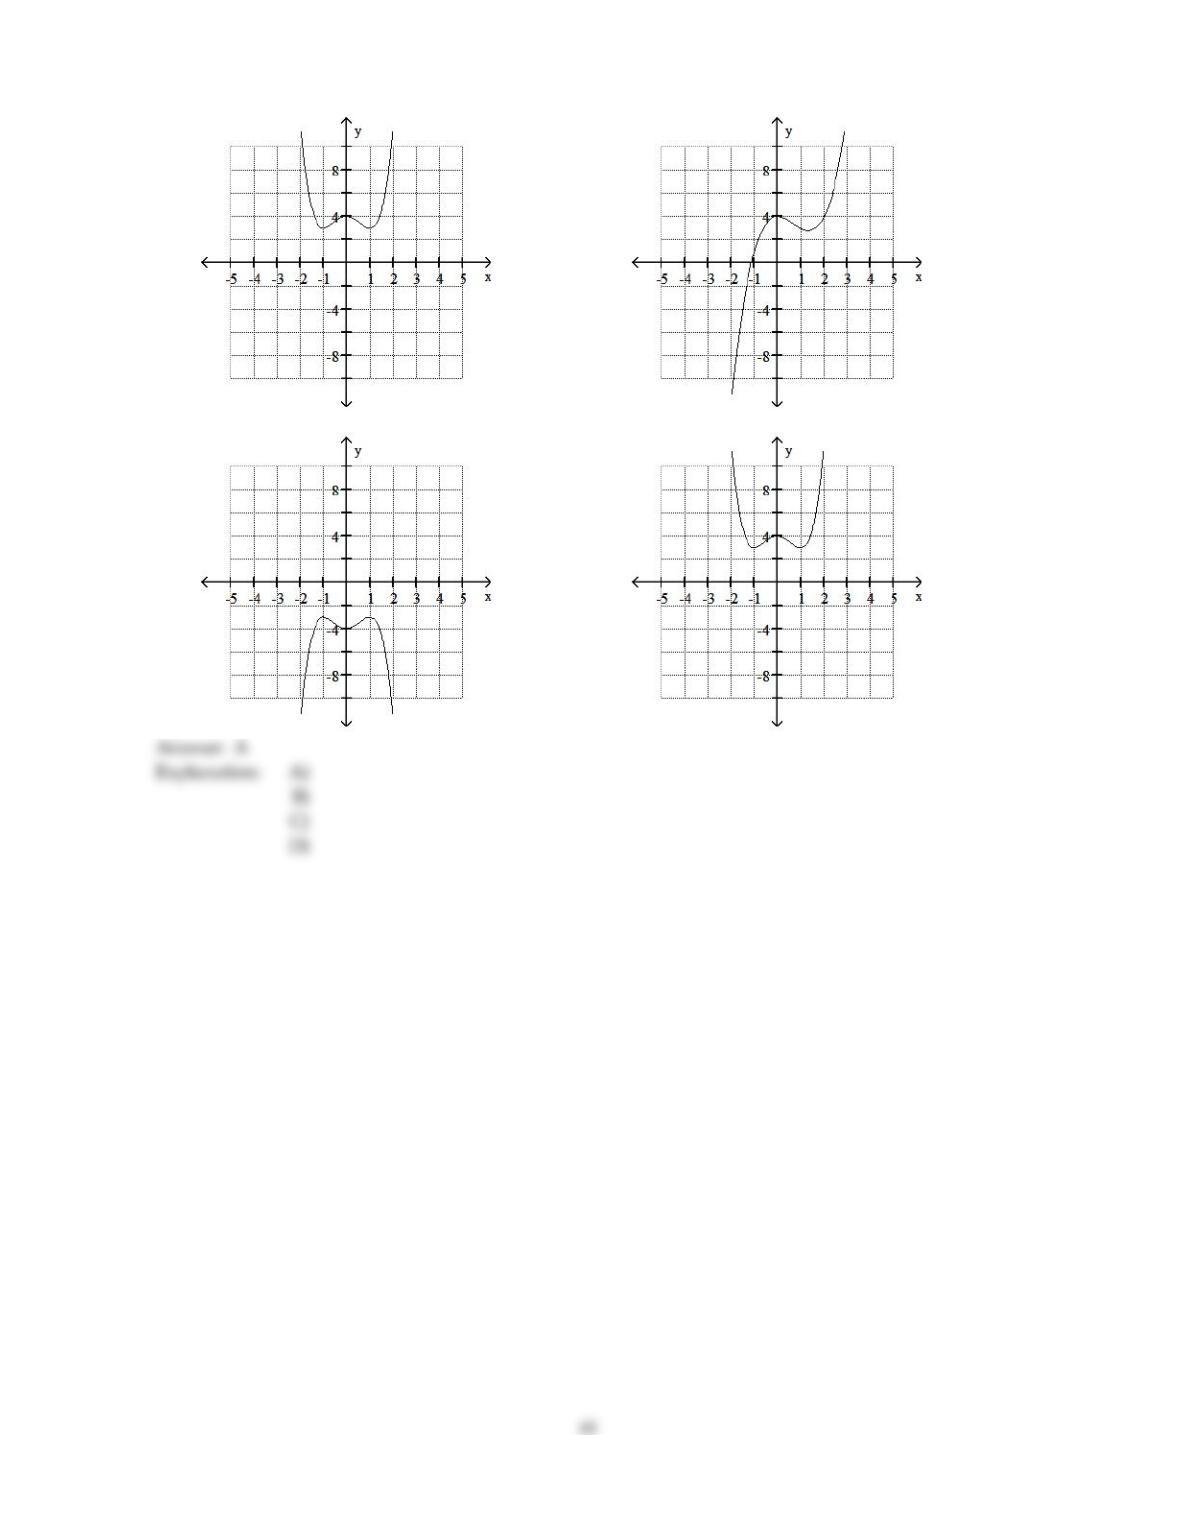
A)
B)
C)
D)
Solve the problem.
108)
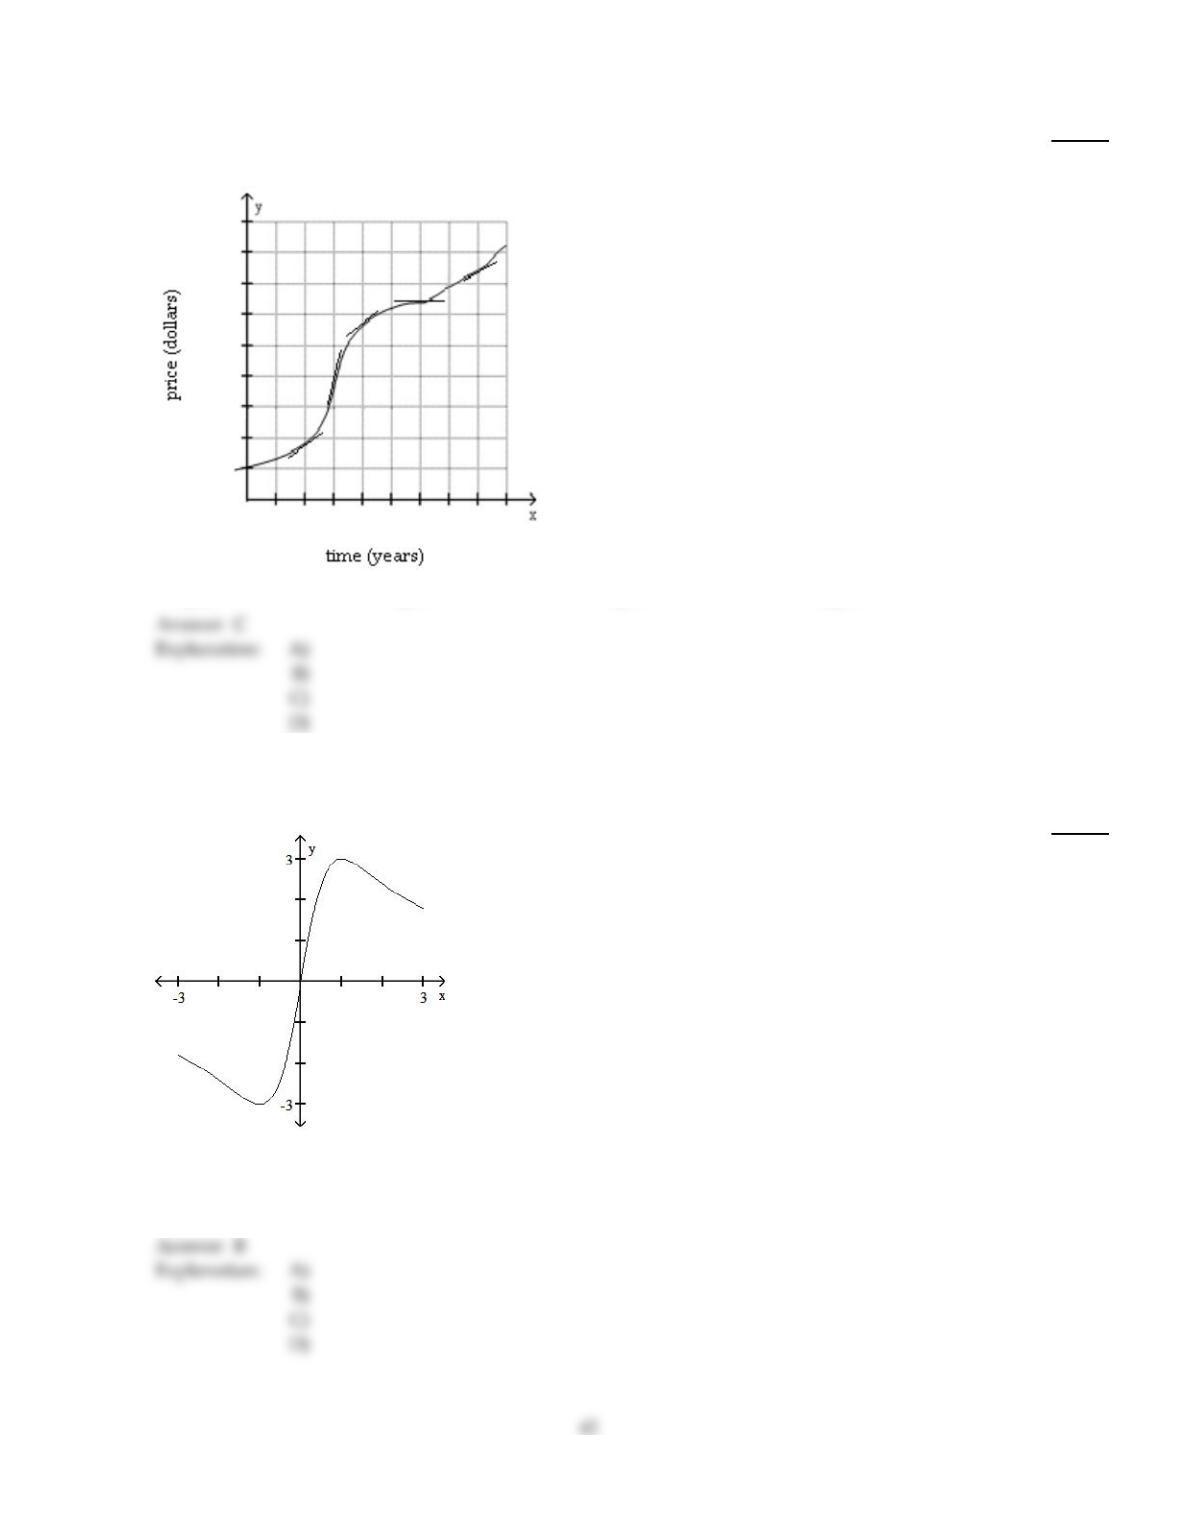
The graph below shows the price of a bushel of a certain crop over a span of 9 years. In what year
was the rate of price increase the least?
9.65
1.65
1 2 3 4 5 6 7 8 9
108)
A)
2
B)
8
C)
6
D)
3
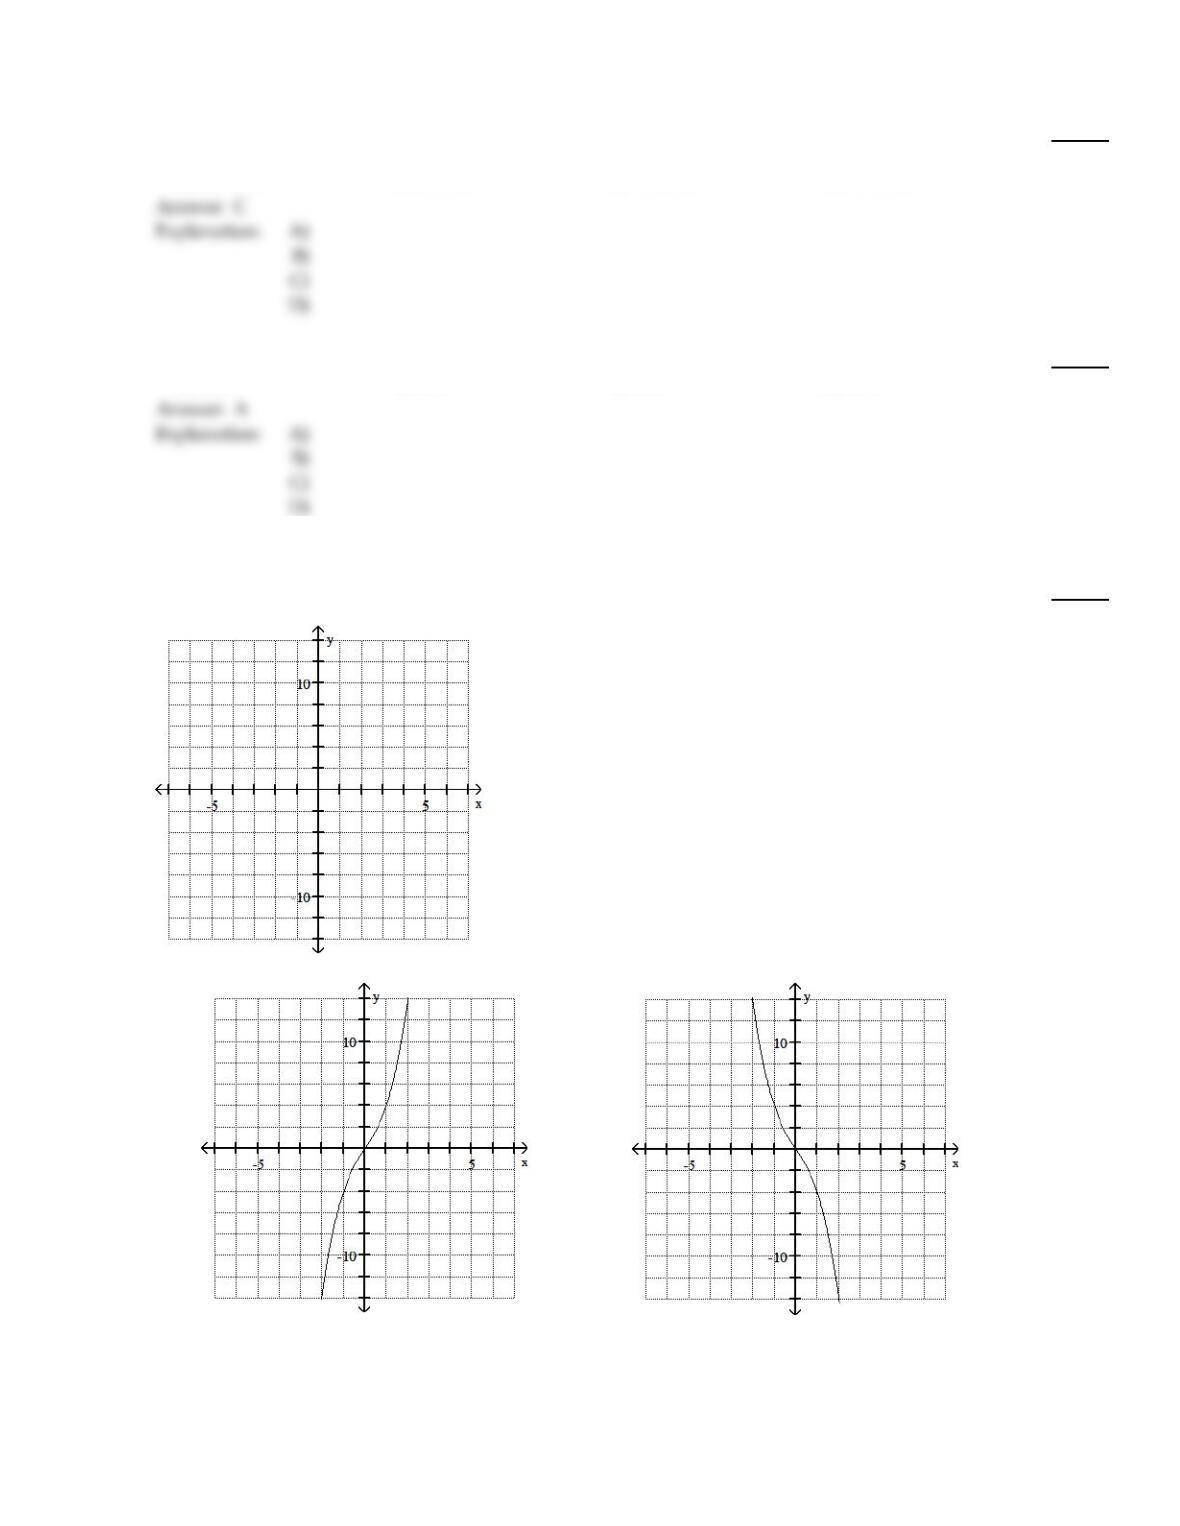
Suppose that the function with the given graph is not f(x), but f (x). Find the locations of all extrema, and tell whether
each extremum is a relative maximum or minimum.
109)
109)
A)
No relative extrema
B)
Relative minimum at 0
C)
Relative maximum at 3; relative minimum at –3
D)
Relative maximum at 1; relative minimum at –1
Solve the problem.
110)
Find the number of units, x, that produces the maximum profit P, if C(x) =80 + 8x and
p =80 – 2x.
110)
A)
32 units
B)
8 units
C)
18 units
D)
72 units
111)
Find the price p per unit that produces the maximum profit P if C(x) =60 + 24x and p =60 – 2x.
111)
A)
$42
B)
$40
C)
$38
D)
$36
Graph the function by first finding the relative extrema.
112)
f(x) =x3+3x
112)
A)
B)
43
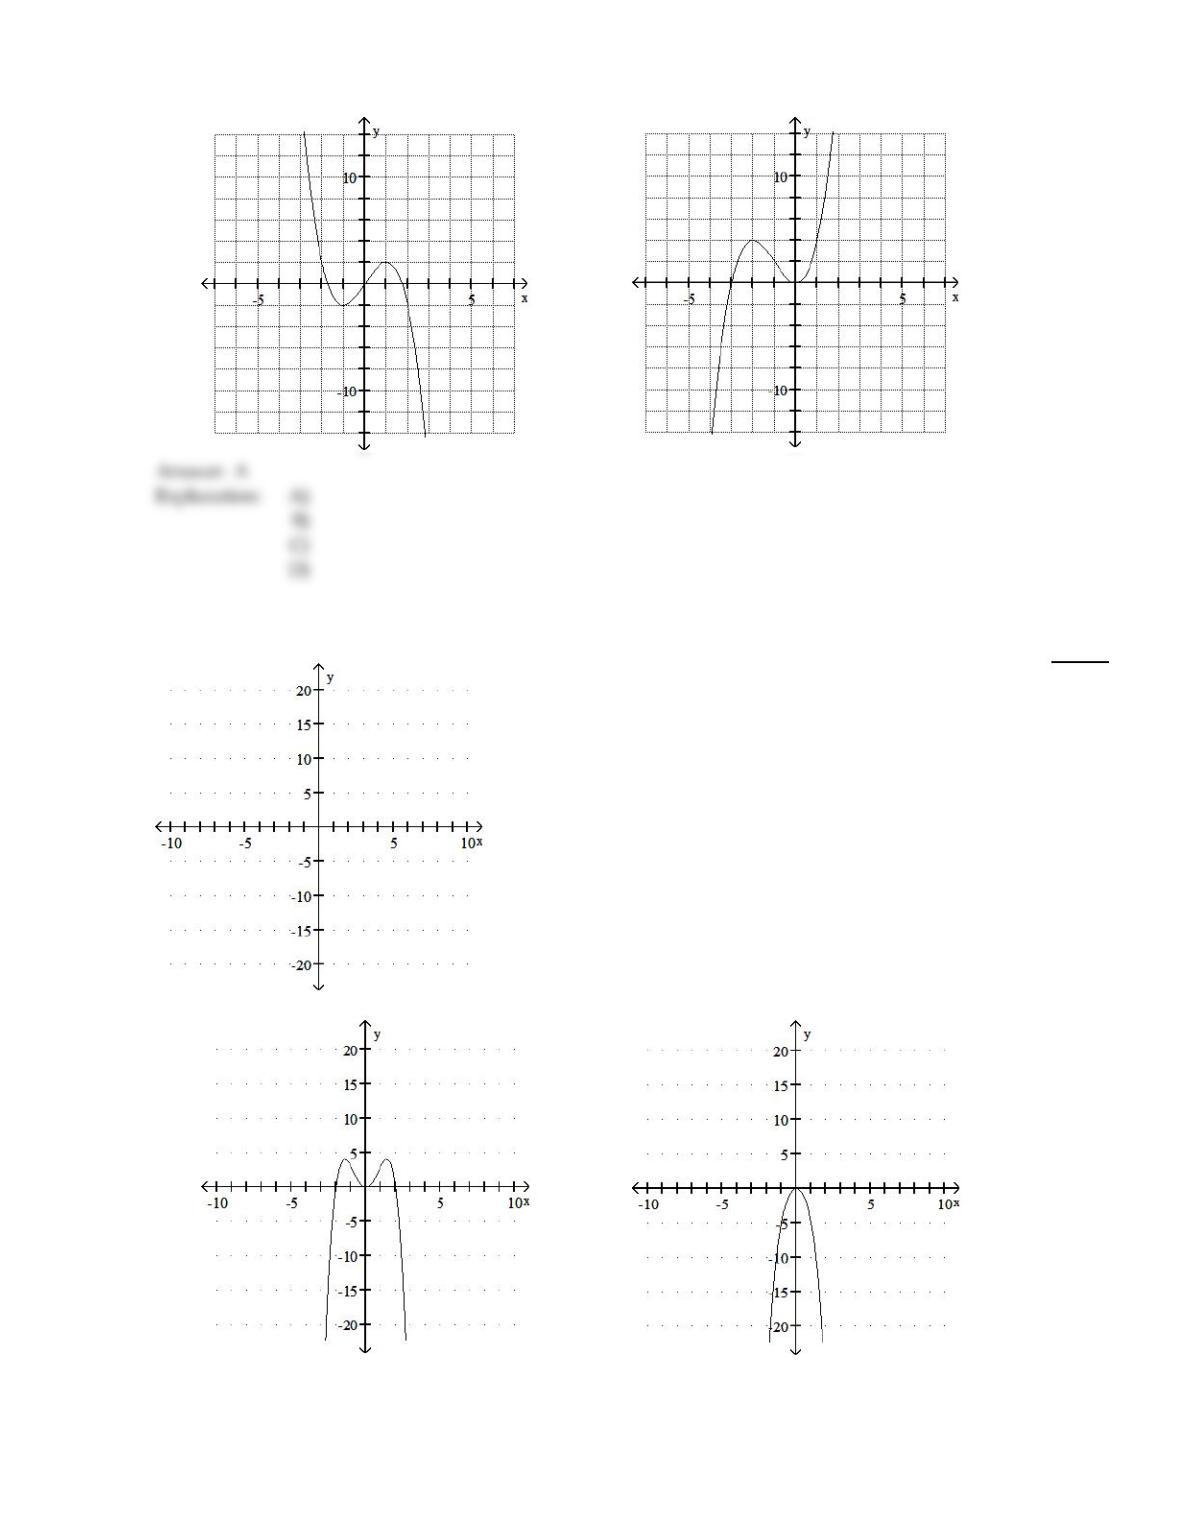
C)
D)
Graph the function.
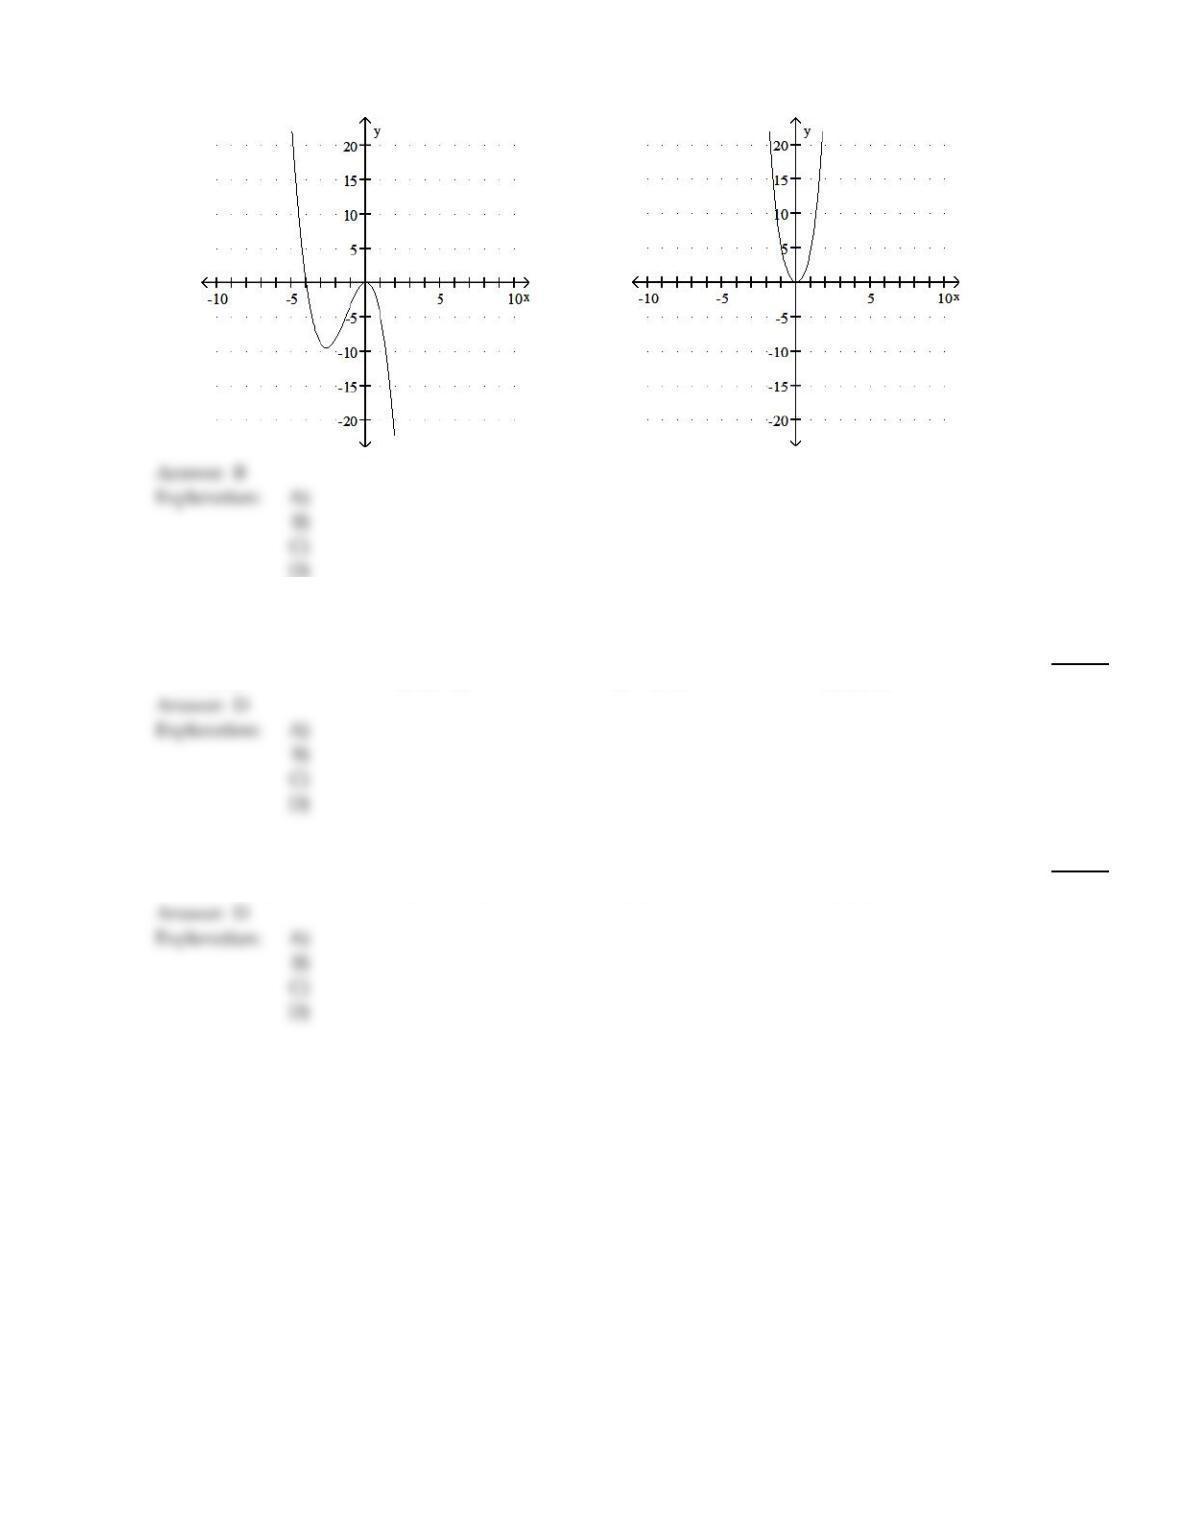
113)
f(x) = – x4–4x2
113)
A)
B)
44
C)
D)
Find the points of inflection.
114)
f(x) = – x3+9x +4
114)
A)
(0, 9)
B)
(4, –4)
C)
(–4, 9)
D)
(0, 4)
115)
f(x) =x3–12x2+ 2x + 15
115)
A)
(4, –252)
B)
(–4, –48)
C)
(4, –46)
D)
(4, –105)
45
Solve the problem.
116)
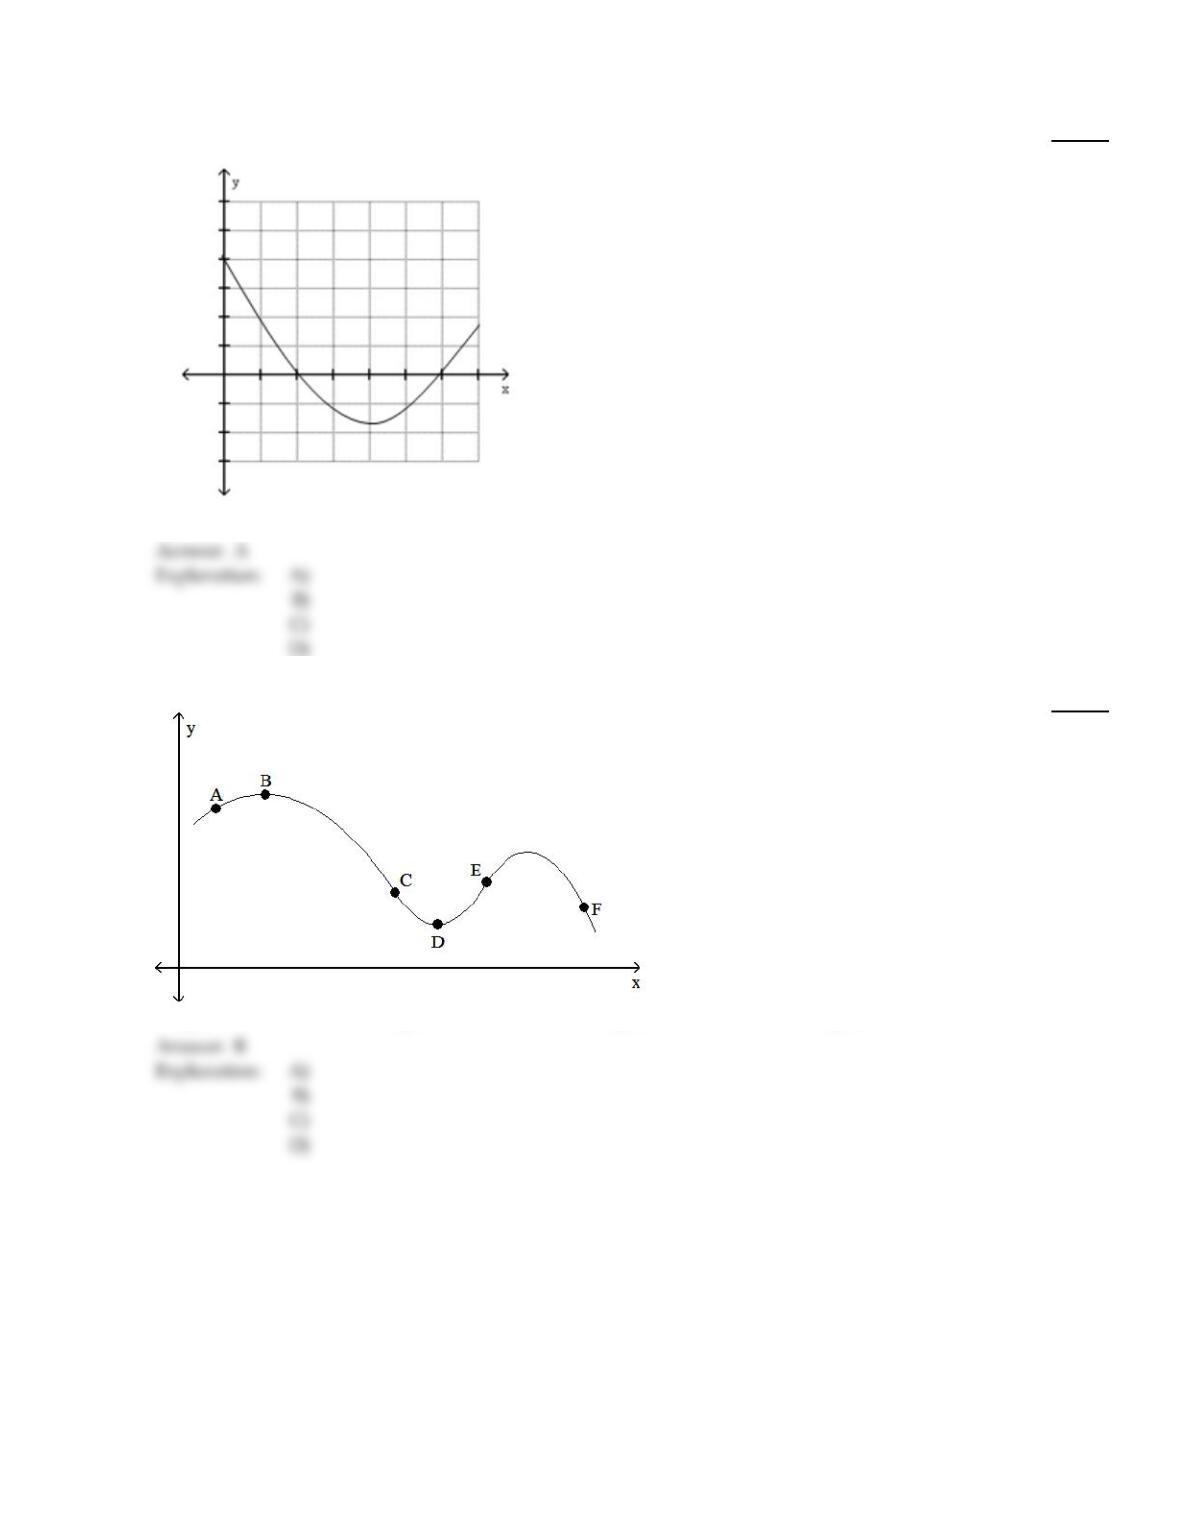
The following graph shows f(x). On what interval is f(x) decreasing?
412 20 28
116)
A)
8< x <24
B)
0 < x <16
C)
16 < x <28
D)
0 < x <8
117)
Which labeled point has the most negative slope?
117)
A)
E
B)
F
C)
D
D)
C
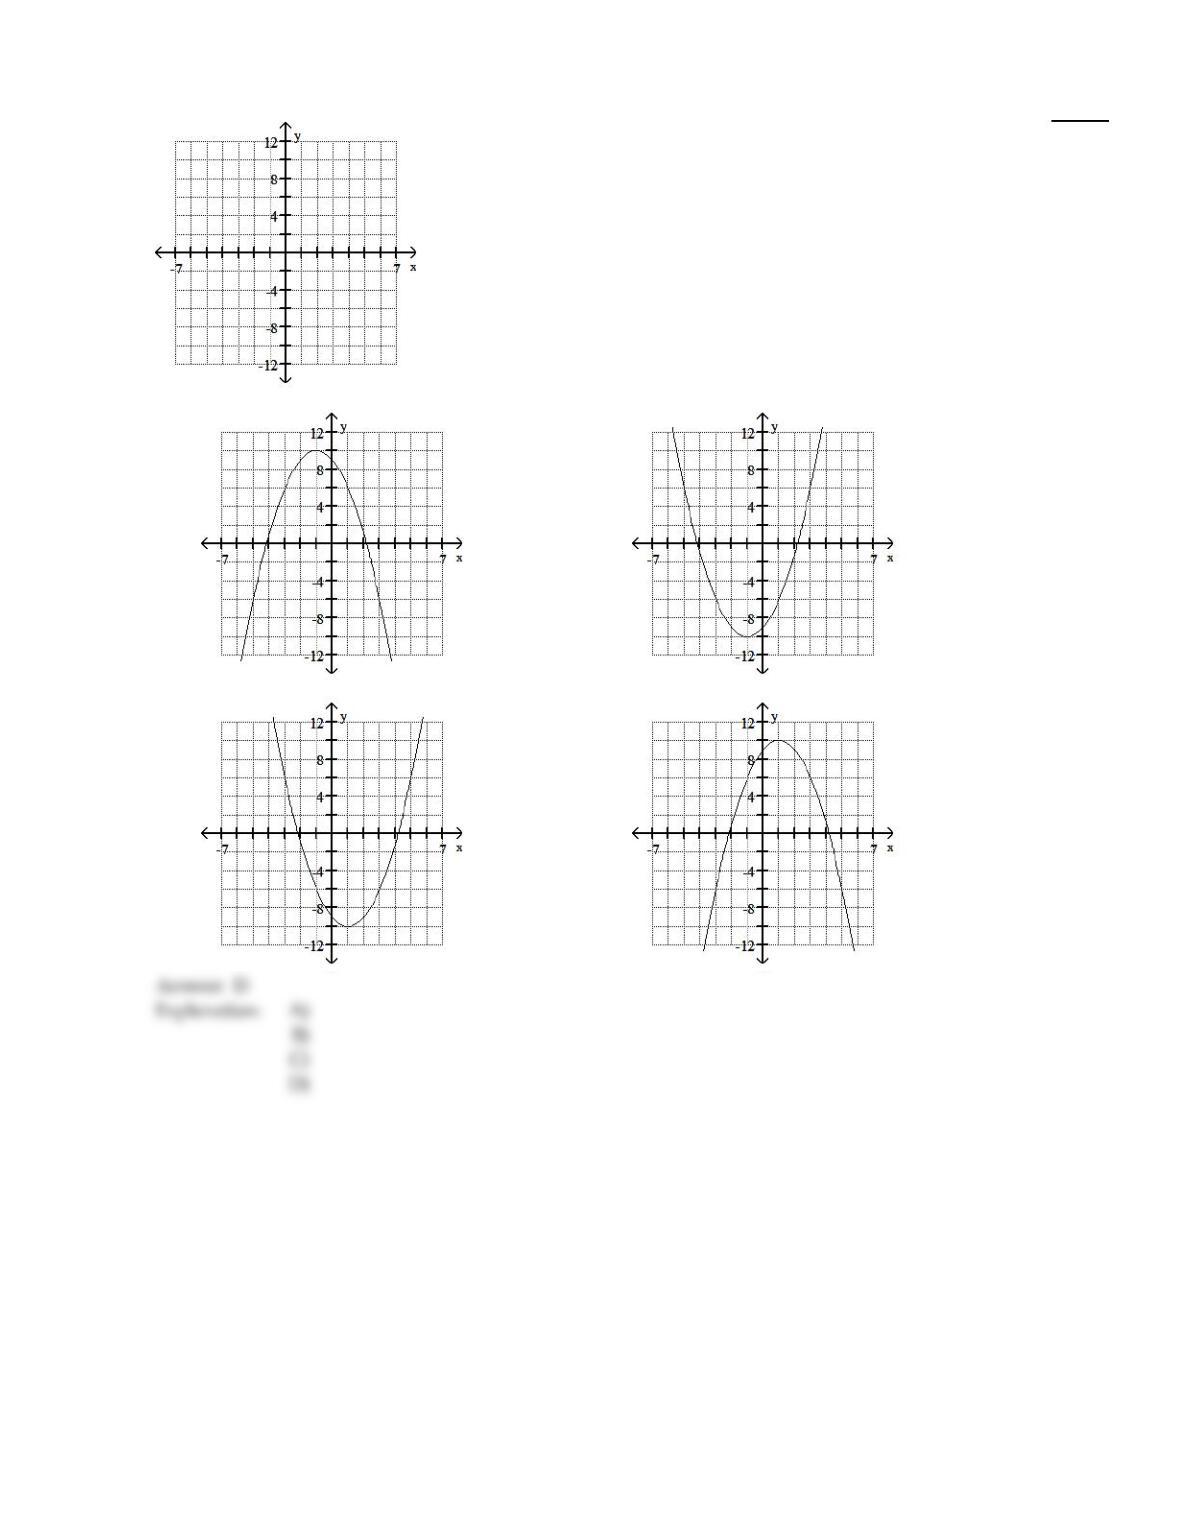
Graph the function by first finding the relative extrema.
46
118)
f(x) =9+2x –x2
118)
A)
B)
C)
D)
47
119)
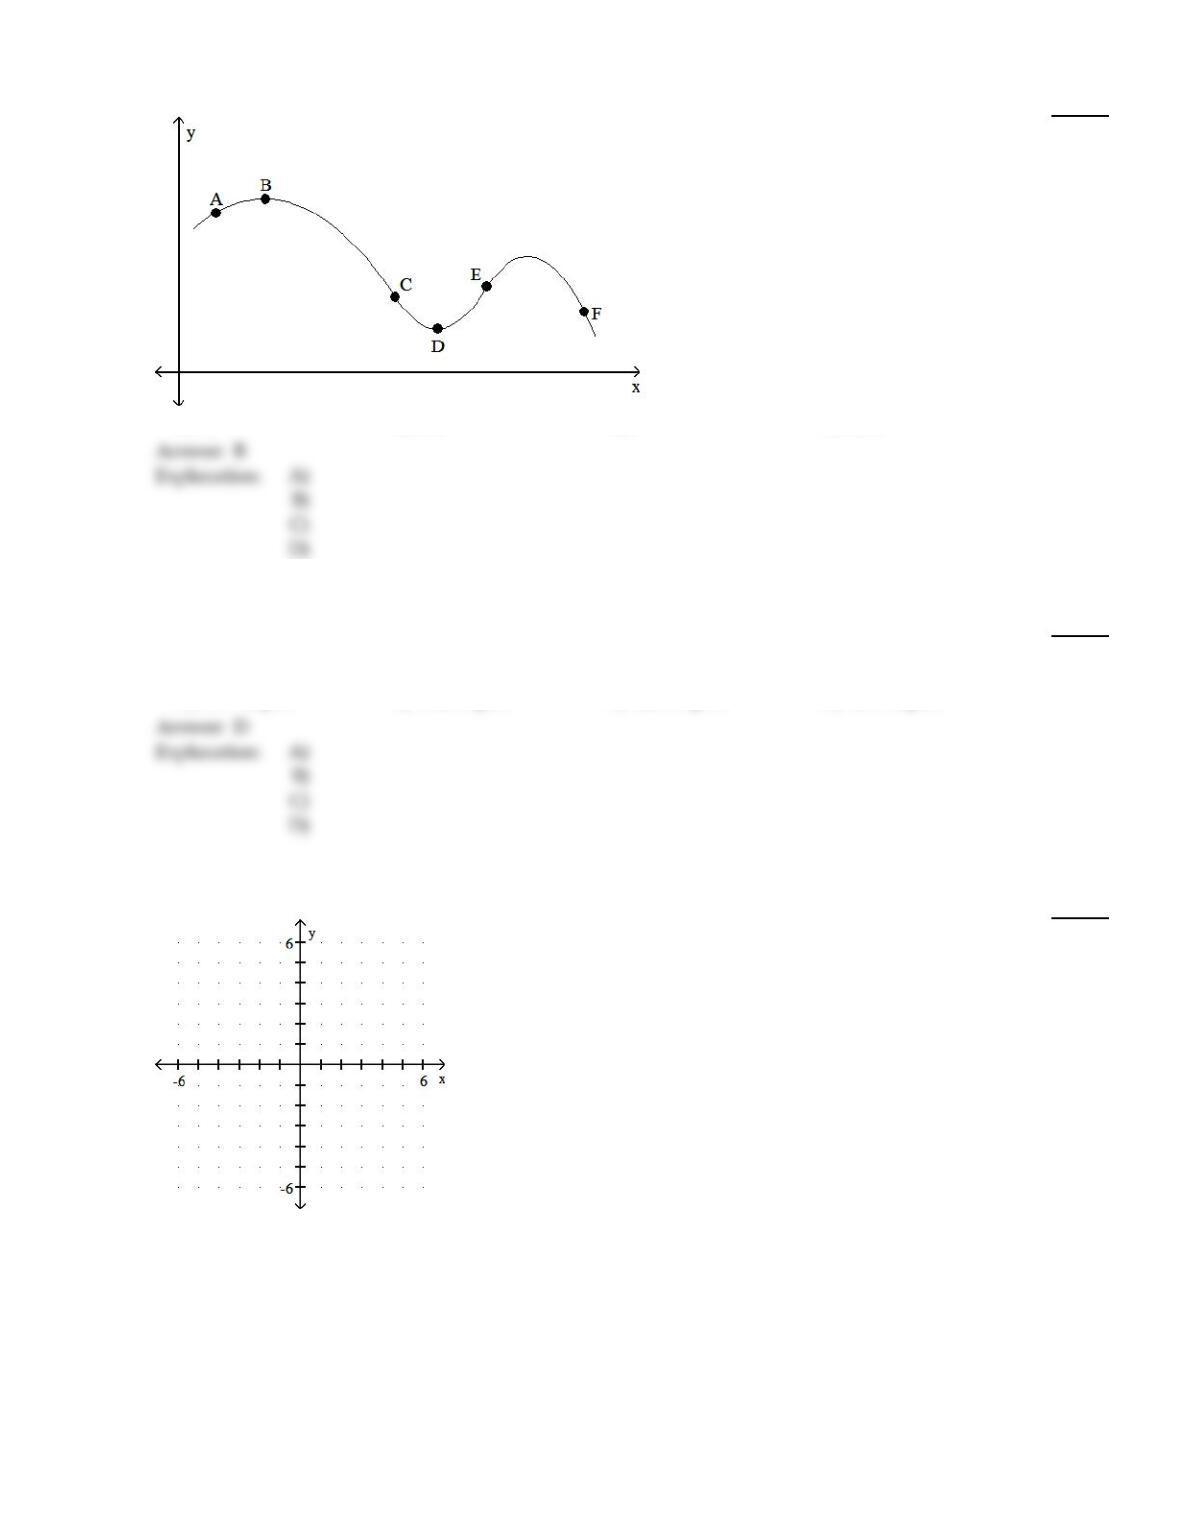
At which labeled point(s) is the function decreasing?
119)
A)
C
B)
C, F
C)
F
D)
A, E
Solve the problem.
120)
A bookstore has an annual demand for 61,000 copies of a best–selling book. It costs $0.70 to store
one copy for one year, and it costs $125 to place an order. Find the optimum number of copies per
order.
120)
A)
5579 copies
B)
5124 copies
C)
4201 copies
D)
4668 copies
Graph the function.
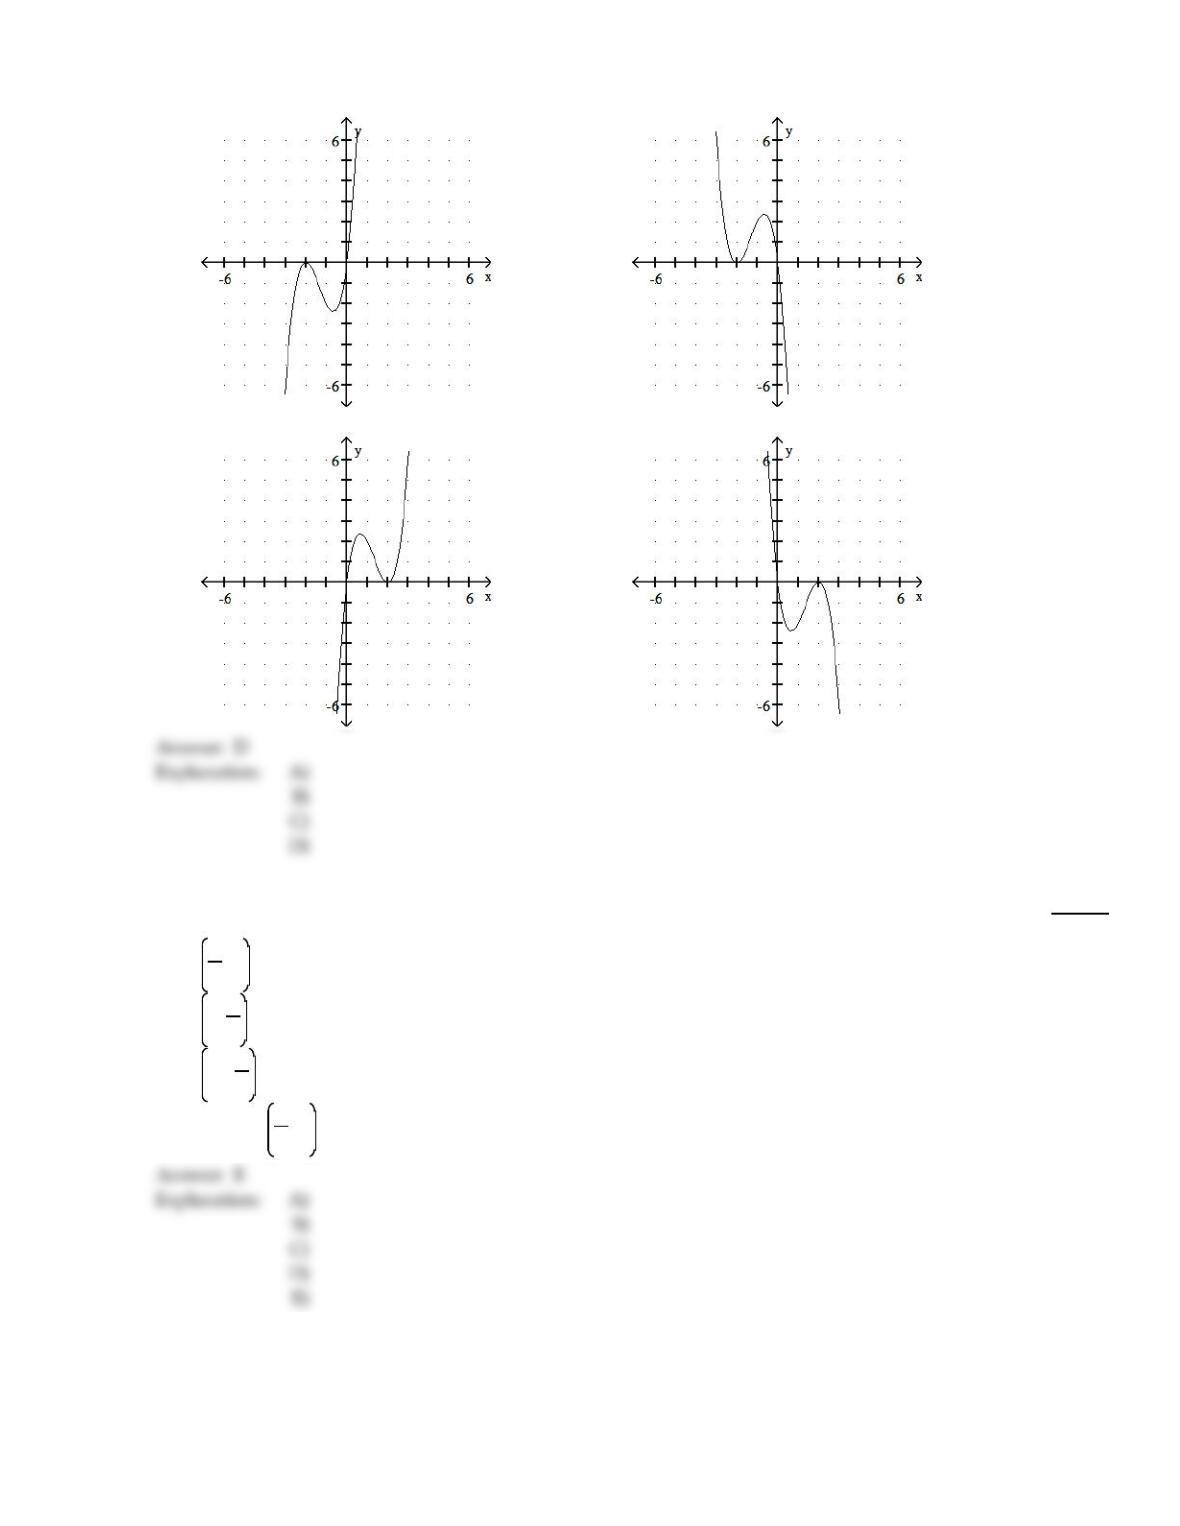
121)
f(x) = – 2x(x – 2)2
121)
48
A)
B)
C)
D)
122)
Find the interval(s) where f is concave up for f(x) = 4x4– 3x3+ 5x –10.
122)
A)
( , )
B)
3
8,
C)
0, 3
8
D)
, 3
8
E)
( , 0) 3
8,
E
49
D
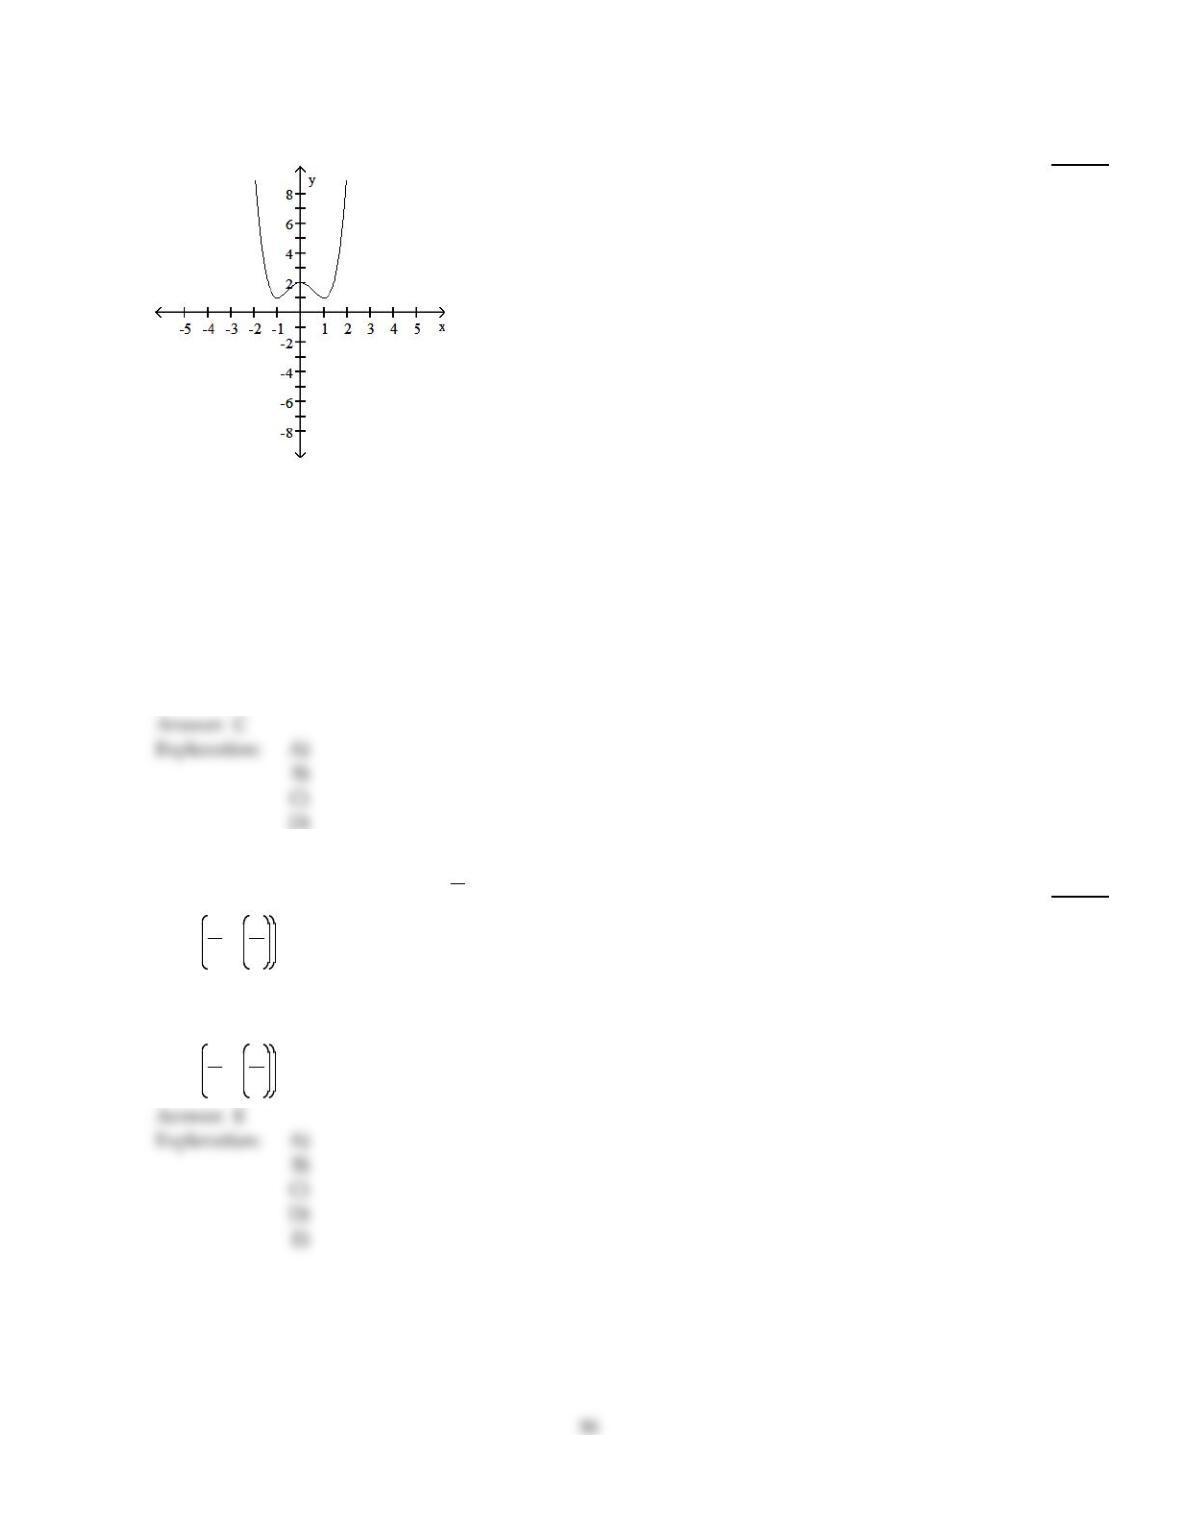
Suppose that the function with the given graph is not f(x), but f (x). Find the open intervals where the function is concave
upward or concave downward, and find the location of any inflection points.
123)
123)
A)
Concave upward on (–1, 0) and (1, ); concave downward on ( , –1) and (0, 1); inflection
points
at –2, 0, and 2
B)
Concave upward on ( , 0); concave downward on (0, ); inflection point at 0
C)
Concave upward on (–1, 0) and (1, ); concave downward on ( , –1) and (0, 1); inflection
points
at –1, 0, and 1
D)
Concave upward on ( , –1) and (0, 1); concave downward on (–1, 0) and (1, ; ); inflection
points
at –1, 0, and 1
124)
Find the inflection point(s) of f(x) =2
3x3– 7x2+ 24x –16.
124)
A)
2
7, f 2
7
B)
(2, f (2)) and (6, f (6))
C)
(56, f (56))
D)
(3, f (3)) and (4, f (4))
E)
7
2, f 7
2
E
C
125)
What is the maximum area that can be enclosed in a rectangular shape with 100 feet of fence if one
of the two long sides is not fenced (there is a natural boundary there)?
125)
A)
2500 square feet
B)
1000 square feet
C)
1250 square feet
D)
625 square feet
E)
none of these
Solve the problem.
126)
The population of squirrels in a certain forest is increasing. Let P(t) be the population of squirrels at
time t and suppose that P(t) has the line y =26,000 as an asymptote. What does this imply about the
size of the population?
126)
A)
The population will not rise above 26,000.
B)
The population will grow to 26,000 then begin to drop.
C)
The population will not drop below 26,000.
D)
The population is 26,000 at any given time t.
D)
Find the x–intercepts of the function.
127)
f(x) = x2+ 8x –3
127)
A)
(–4±19, 0)
B)
(–4±219, 0)
C)
(4 +19, 0)
D)
(–1±19, 0)
D)
51
D)
Solve the problem.
128)
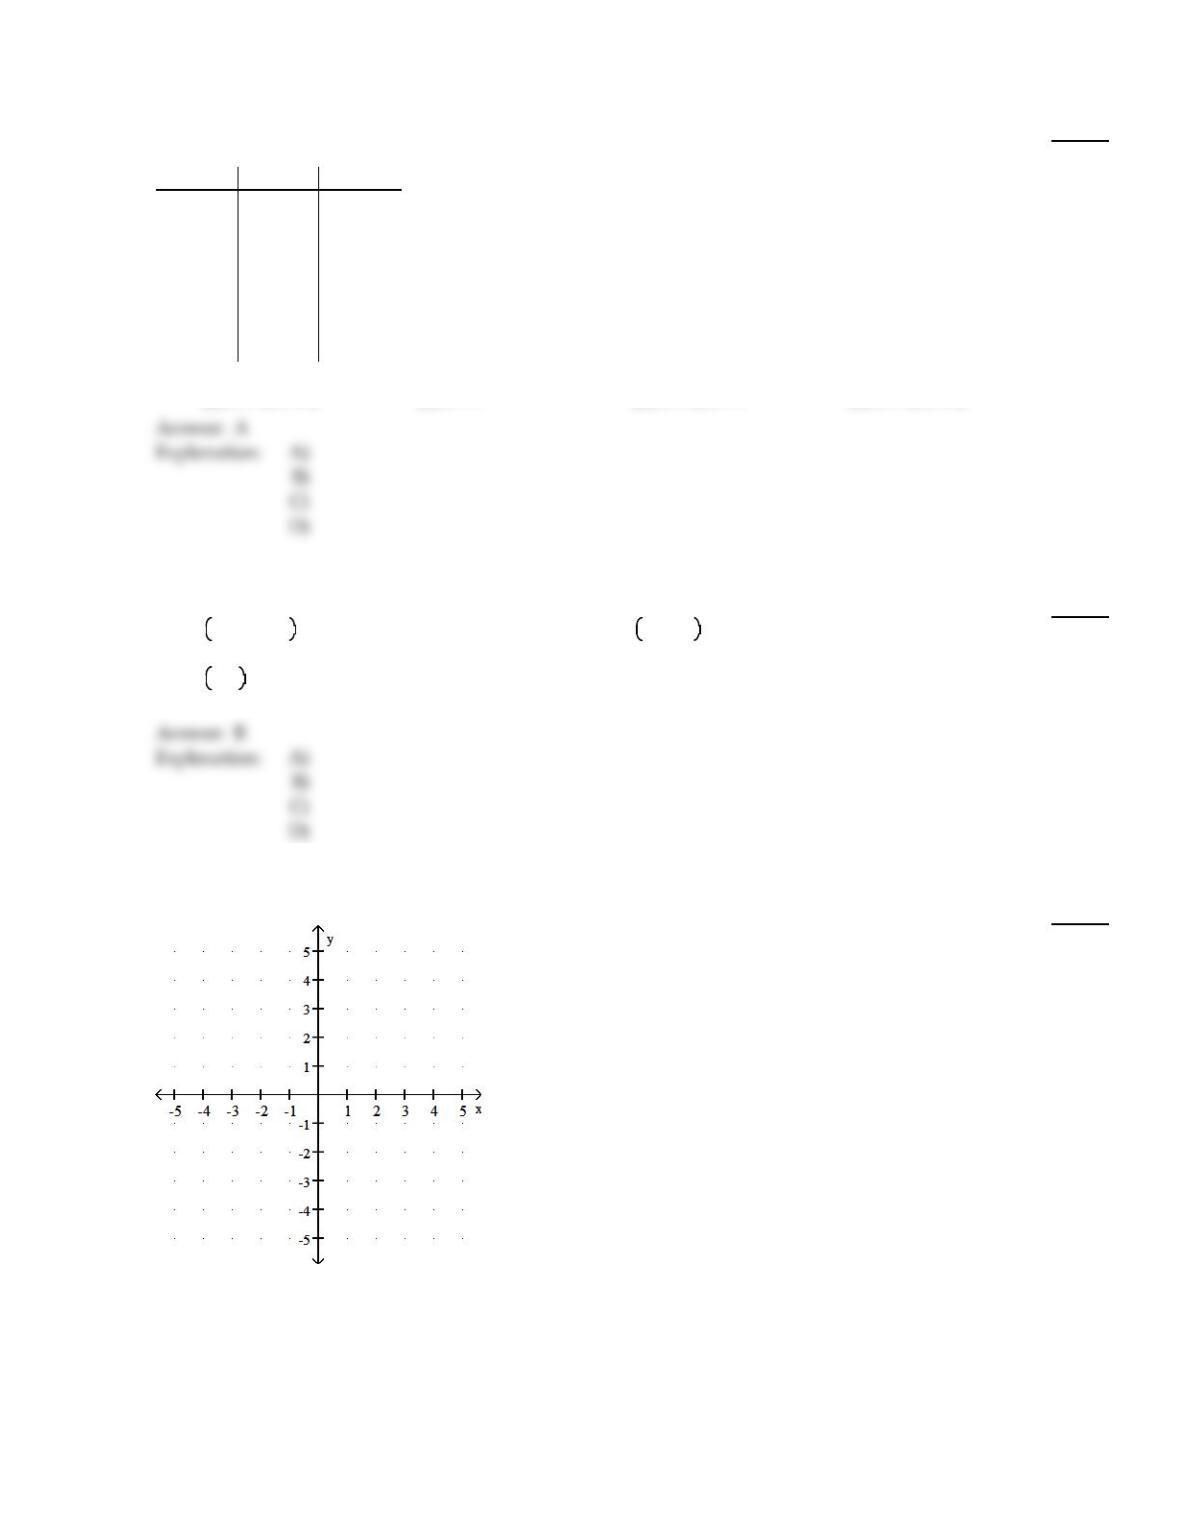
The first and second derivatives of the function f(x) have the values given in the table. (a) Find the
x–coordinates of all relative extreme points. (b) Find the x–coordinates of all inflection points.
x f (x) f(x)
0
x <3Positive Negative
3 0 0
3< x <6Positive Positive
6Positive 0
6< x <7Positive Negative
7 0 Negative
7< x 12 Negative Negative
128)
A)
(a) x =7
(b) x =3, x =6
B)
(a) x =3, x =6
(b) x =7
C)
(a) x =3, x =6
(b) x =3, x =7
D)
(a) x =3, x =7
(b) x =3, x =6
Find the points of inflection.
129)
f(x) = 2x3+ 12x2+ 18x
129)
A)
–3.5,171.5
B)
– 2,– 4
C)
0, 0
D)
No points of inflection exist
Graph the function.
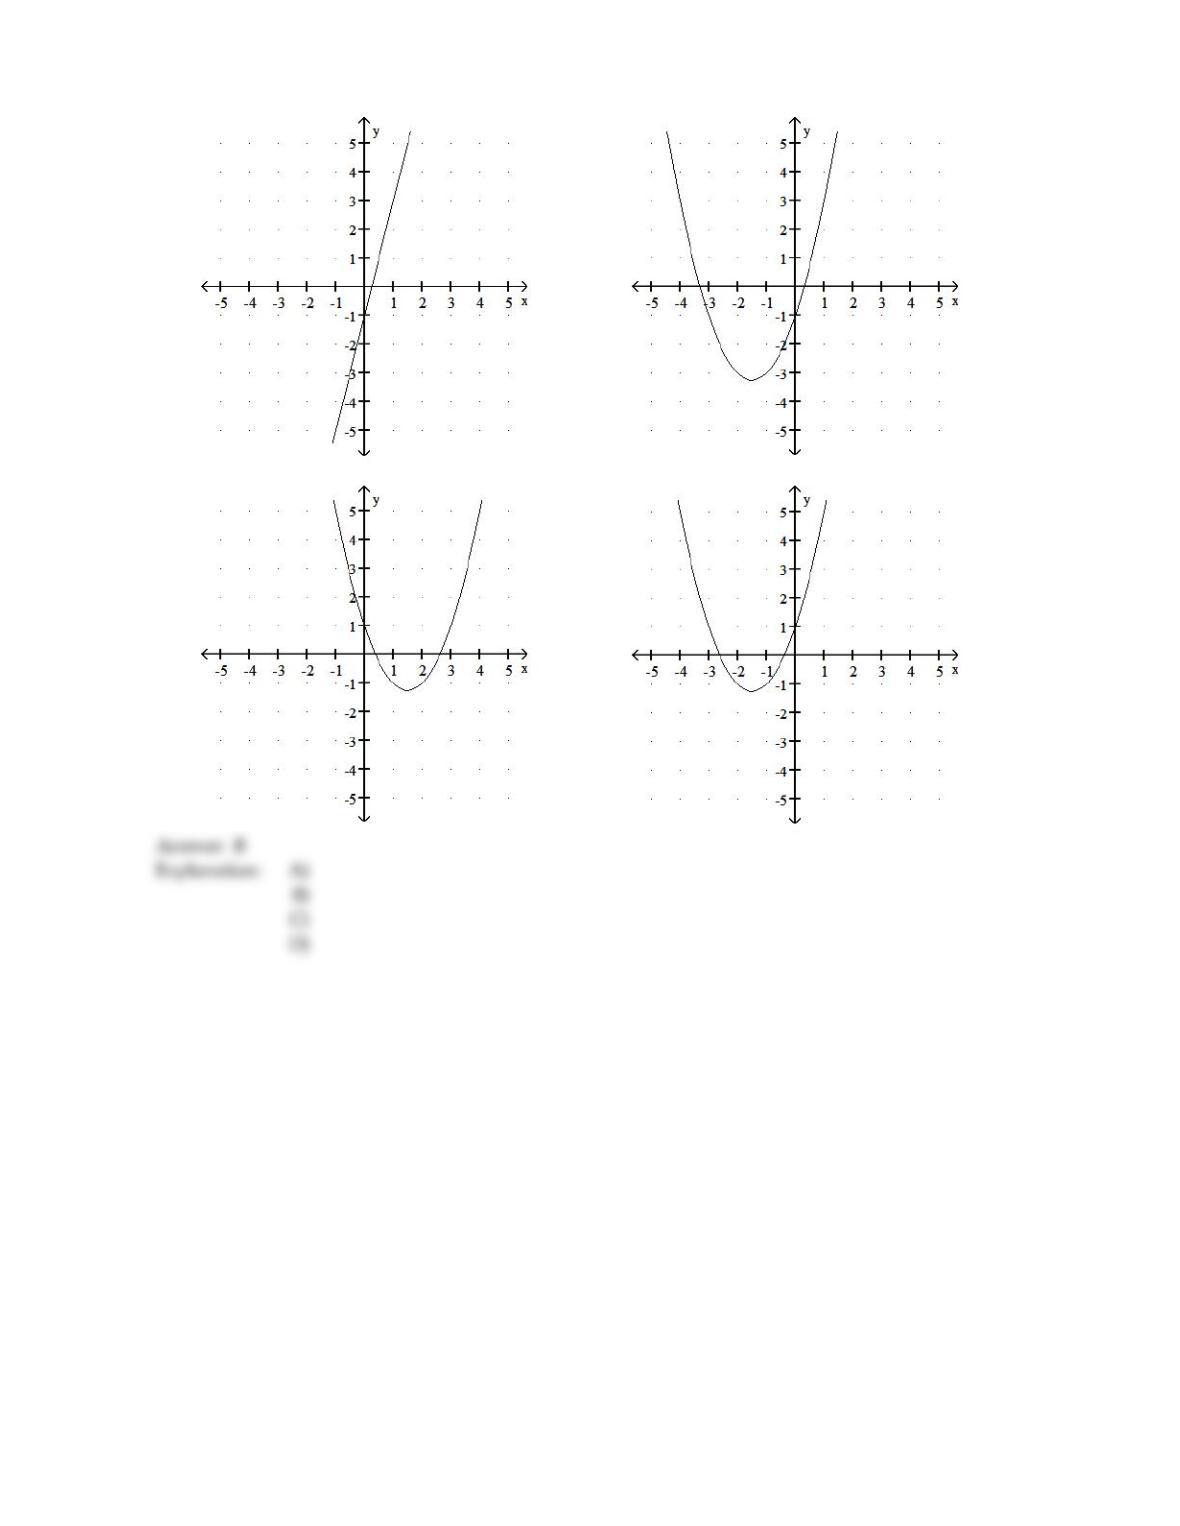
130)
f(x) =x2+3x –1
130)
52
A)
B)
C)
D)
53
Solve the problem.
131)
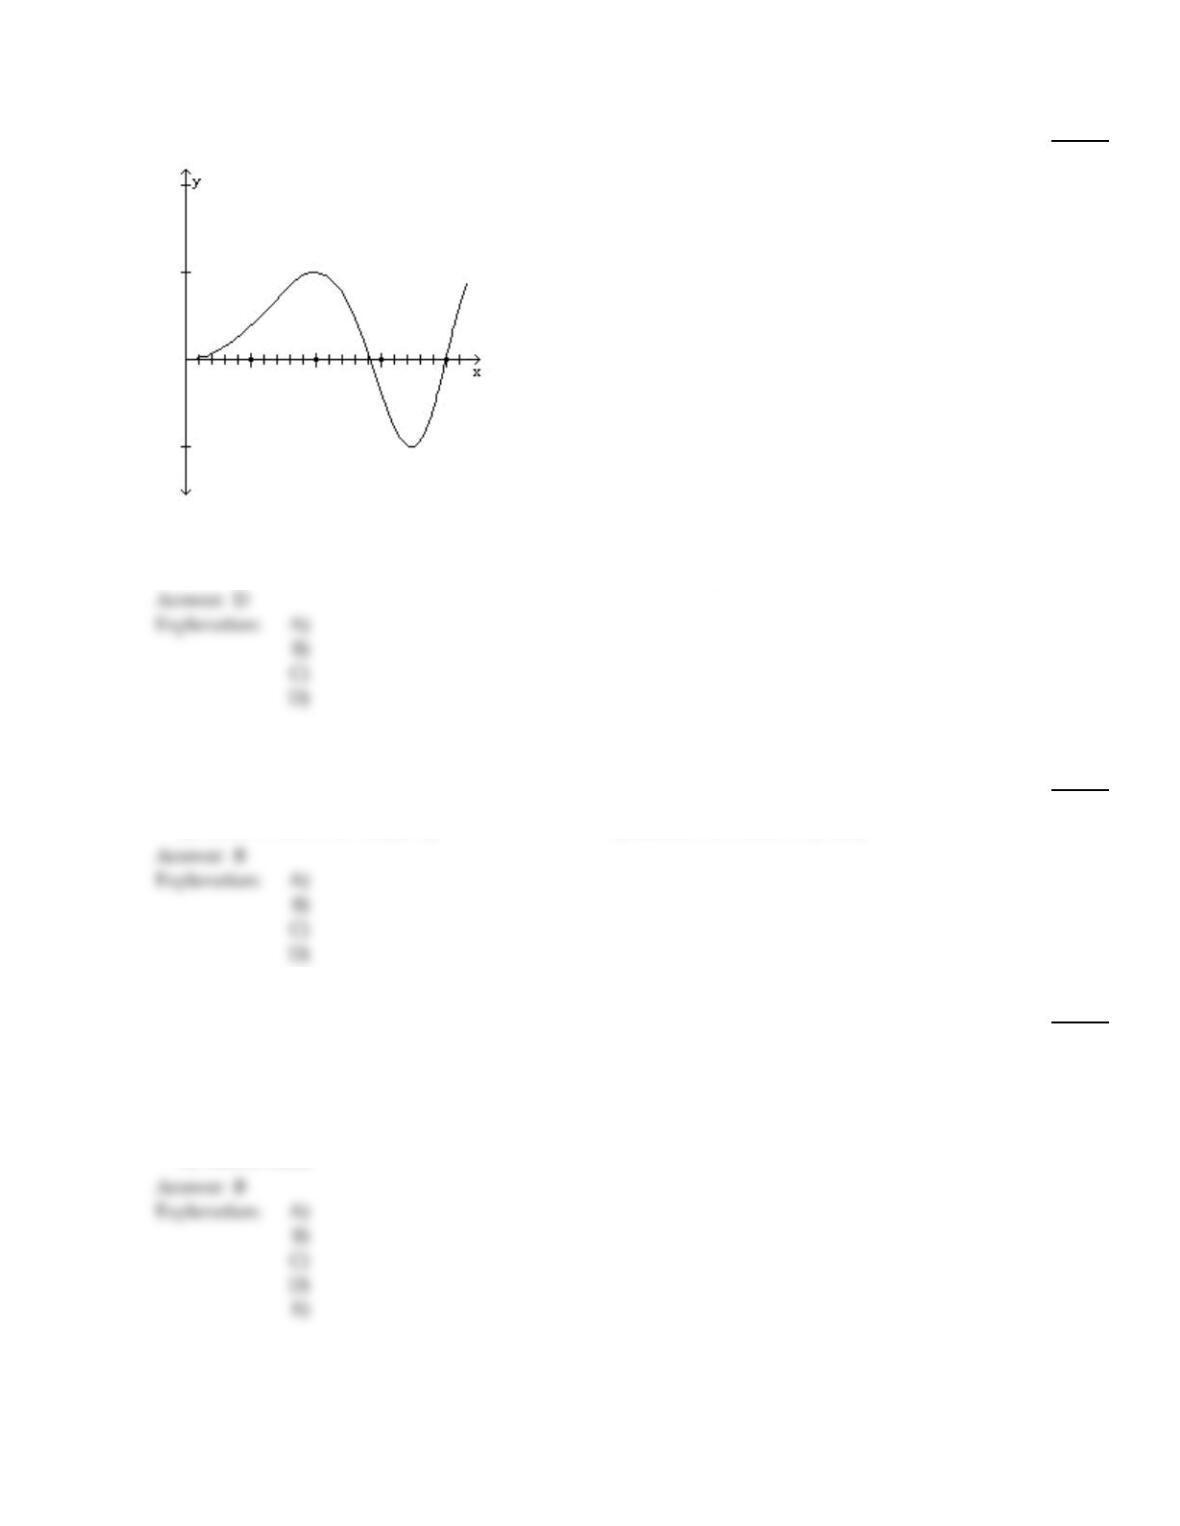
The following graph represents f(x). At x =20, does the graph of f(x) have a relative minimum, a
relative maximum, an inflection point, or none of these?
10 20 30 40
131)
A)
none of these
B)
relative maximum
C)
relative minimum
D)
inflection point
Find the relative extrema of the function, if they exist.
132)
f(x) =3x2+ 24x + 53
132)
A)
Relative minimum at (5, –4)
B)
Relative minimum at (–4, 5)
C)
Relative maximum at (4, –5)
D)
Relative minimum at (–5, 4)
133)
A manufacturer estimates that the profit from producing x units of a commodity is –x2+ 40x – 100
dollars per week. What is the maximum profit he can realize in one week?
133)
A)
$500
B)
$300
C)
$400
D)
$275
E)
none of these
54
134)
Find the relative extreme points for f(x) =x3+ 6x2– 15x.
134)
A)
(–5, f(–5)) is a relative extreme minimum point, (1, f(1)) a relative extreme maximum
B)
(5, f(5)) is a relative extreme minimum point, (–1, f(–1)) a relative extreme maximum
C)
(0, f(0)) is a relative extreme minimum point
D)
(–5, f(–5)) is a relative extreme maximum point, (1, f(1)) a relative extreme minimum
E)
(5, f(5)) is a relative extreme maximum point, (–1, f(–1)) a relative extreme minimum
Use the graph to answer the question.
135)
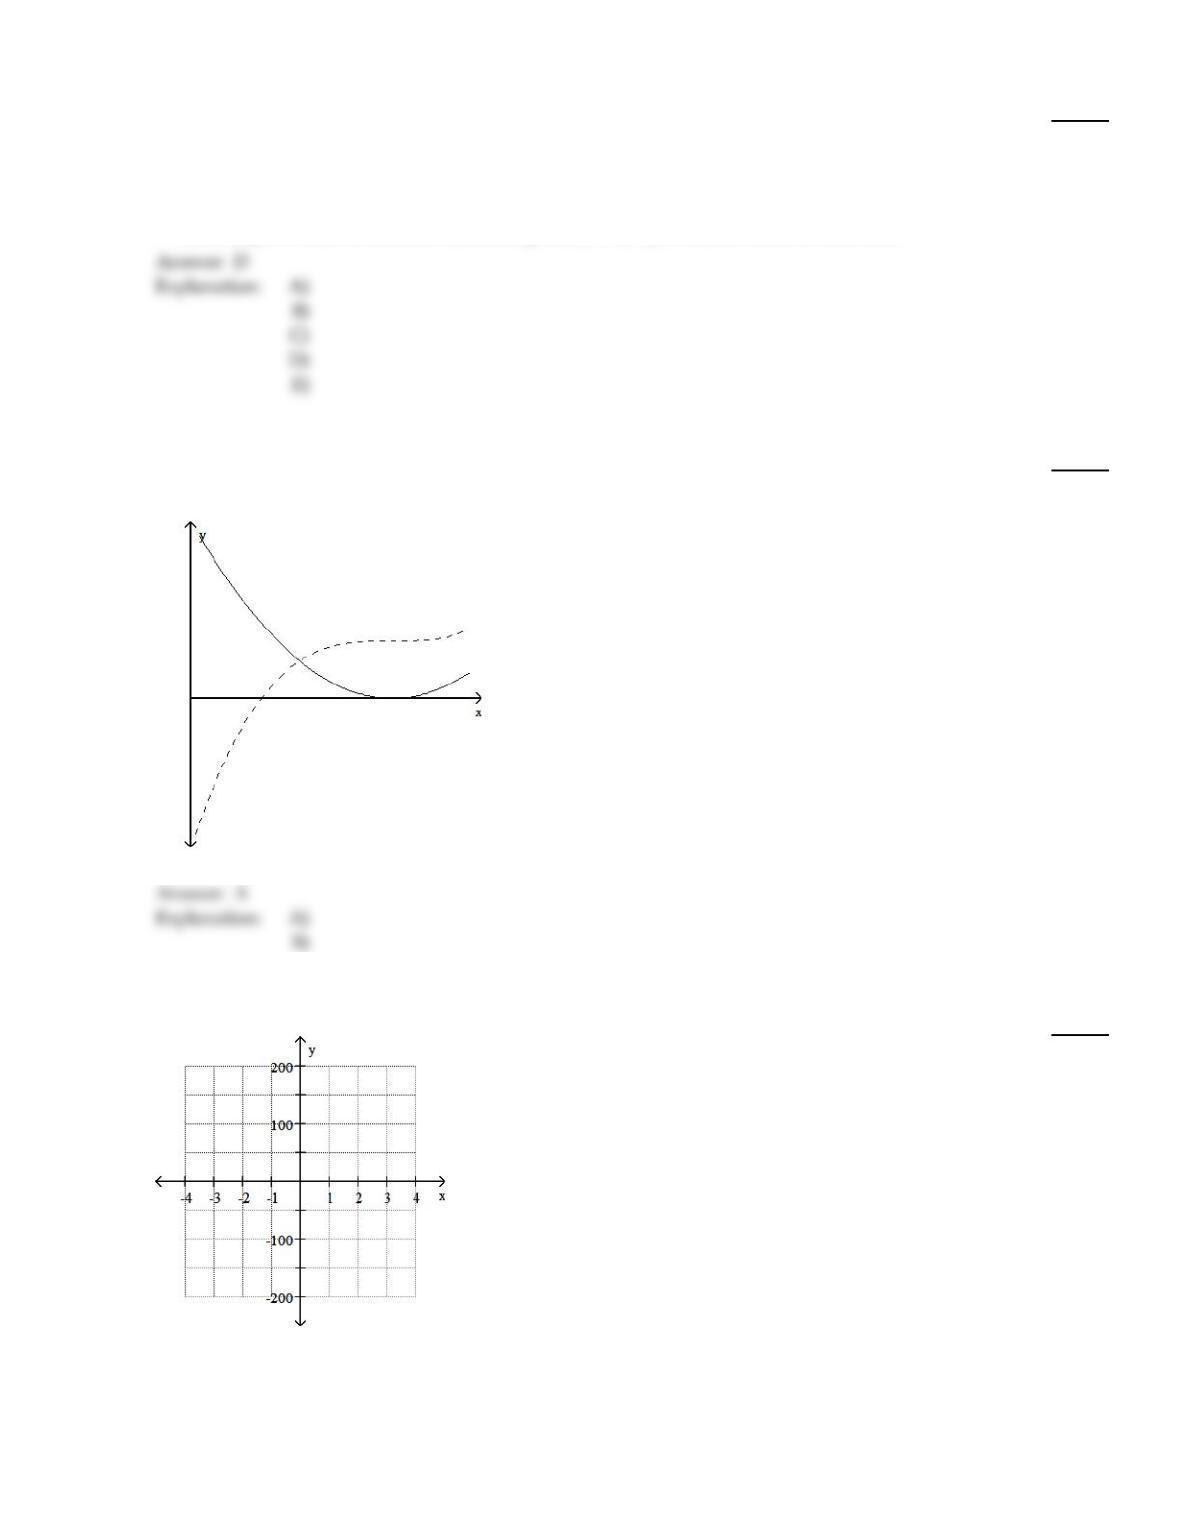
In the graph below the solid line represents y = f(x) and the dashed line represents y = g(x).
Determine which function is the derivative of the other.
135)
A)
f(x) =g(x)
B)
g(x) =f(x)
A
Graph the function by first finding the relative extrema.
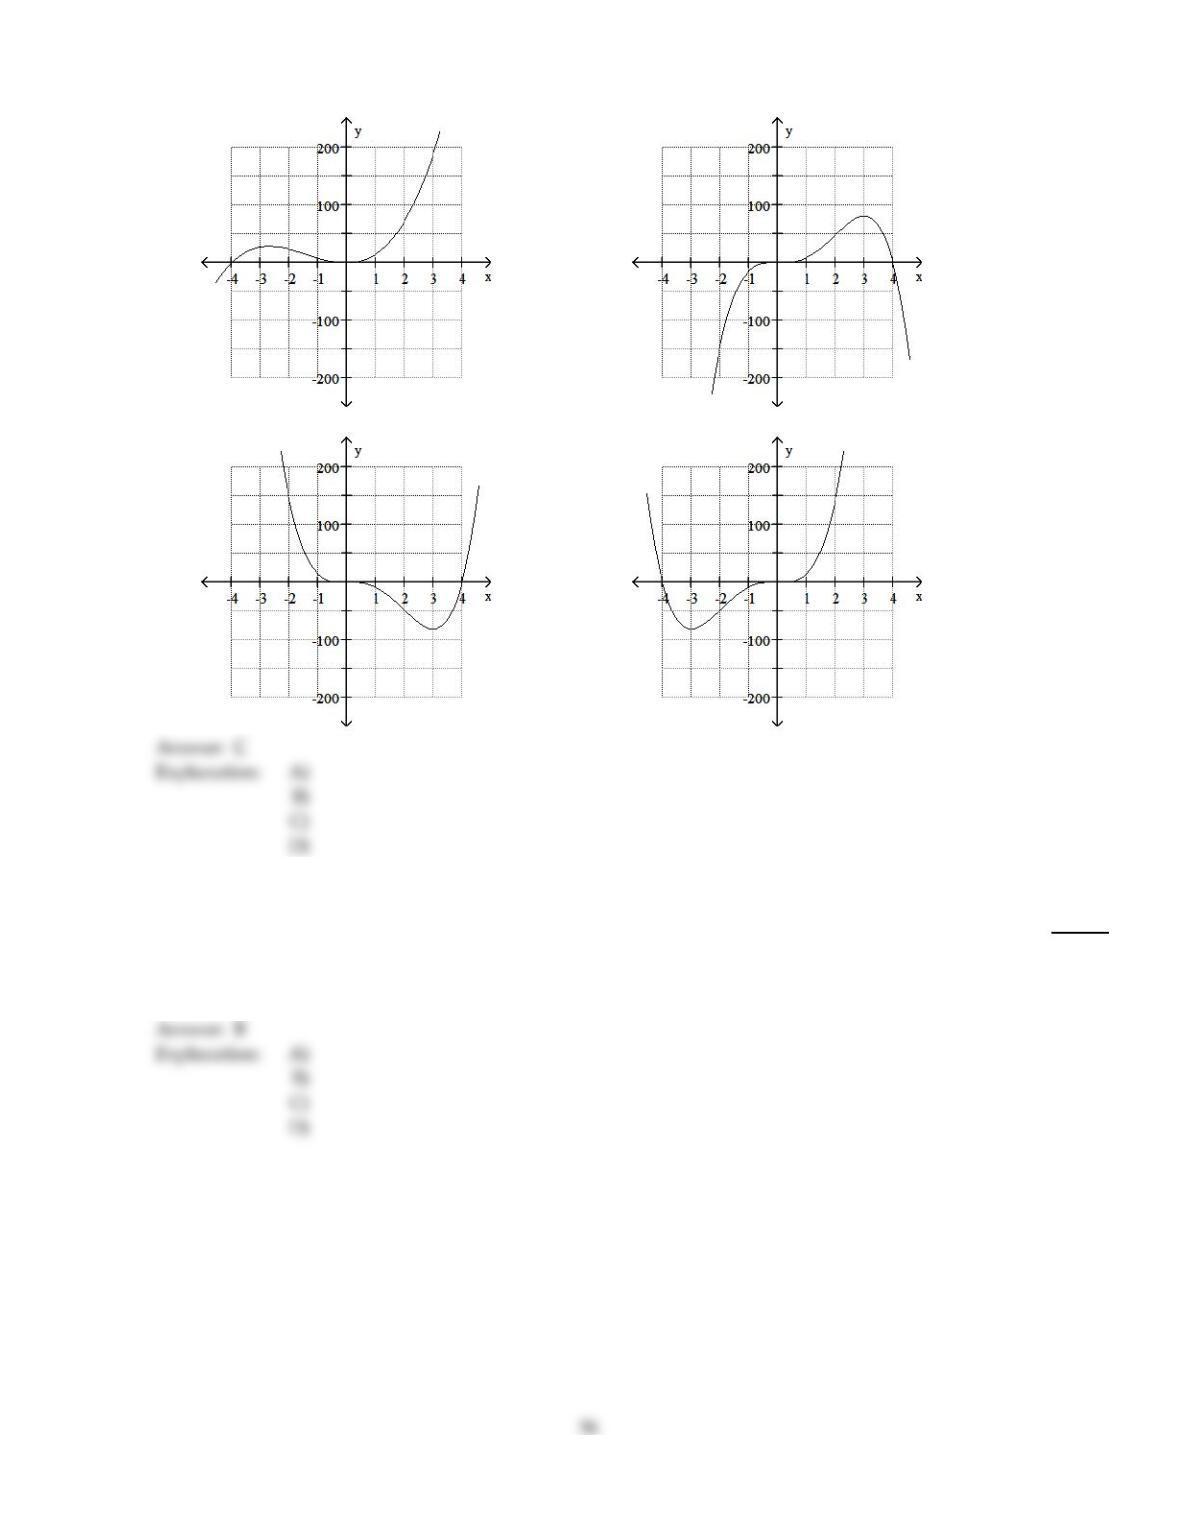
136)
g(x) = 3x4–12x3
136)
55
D
A)
B)
C)
D)
Solve the problem.
137)
The annual revenue and cost functions for a manufacturer of grandfather clocks are approximately
R(x) =480x – 0.01x2 and C(x) =200x + 100,000, where x denotes the number of clocks made. What
is the maximum annual profit?
137)
A)
$2,160,000
B)
$1,860,000
C)
$1,960,000
D)
$2,060,000