C)
D)
Find the domain of the indicated combined function.
84)
Find the domain of (fg)(x) when f(x) =5x +3 and g(x) =3x –7.
84)
A)
Domain: [0, )
B)
Domain: (–, )
C)
Domain: –7
3,
D)
Domain: 7
3,
Find functions f and g so that h(x) = (f
g)(x).
85)
h(x) = |6x + 8|
85)
A)
f(x) = x, g(x) =6x + 8
B)
f(x) = – |x|, g(x) =6x + 8
C)
f(x) =|–x|, g(x) =6x – 8
D)
f(x) =|x|, g(x) =6x + 8
D
C)
D)
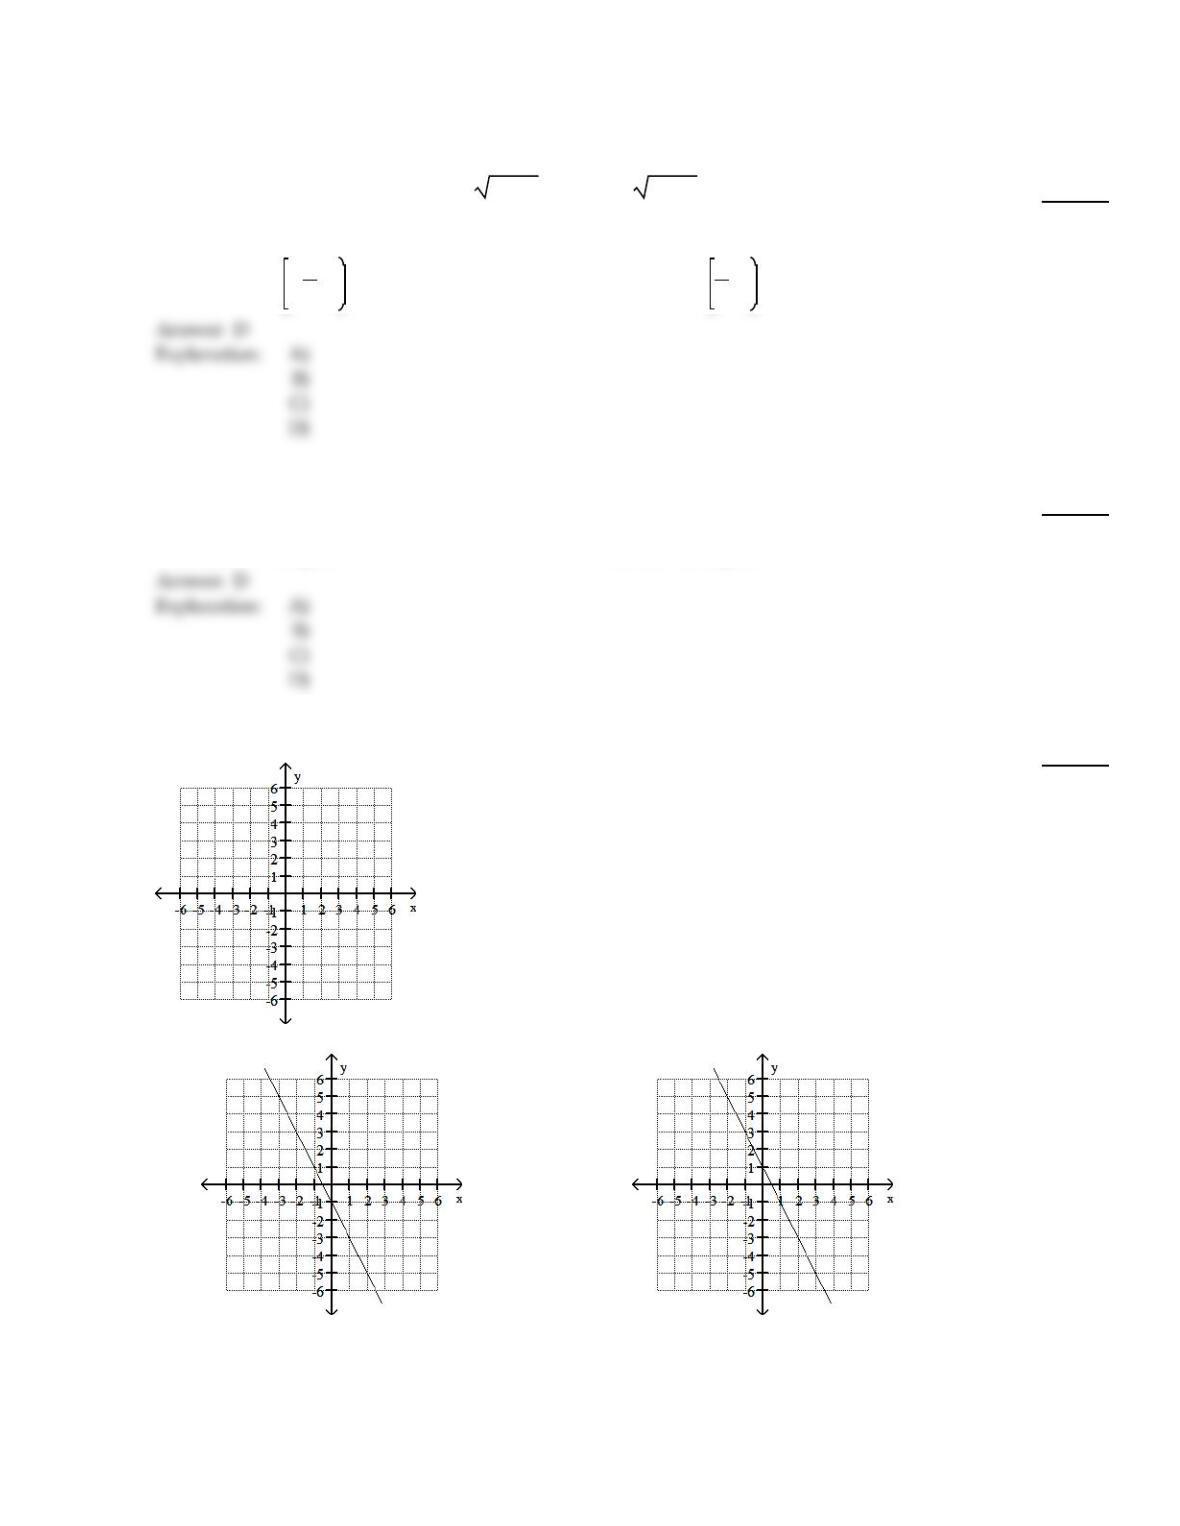
Graph the line whose equation is given.
86)
y =2x + 1
86)
A)
B)
41
D
C)
D)
C)
D)
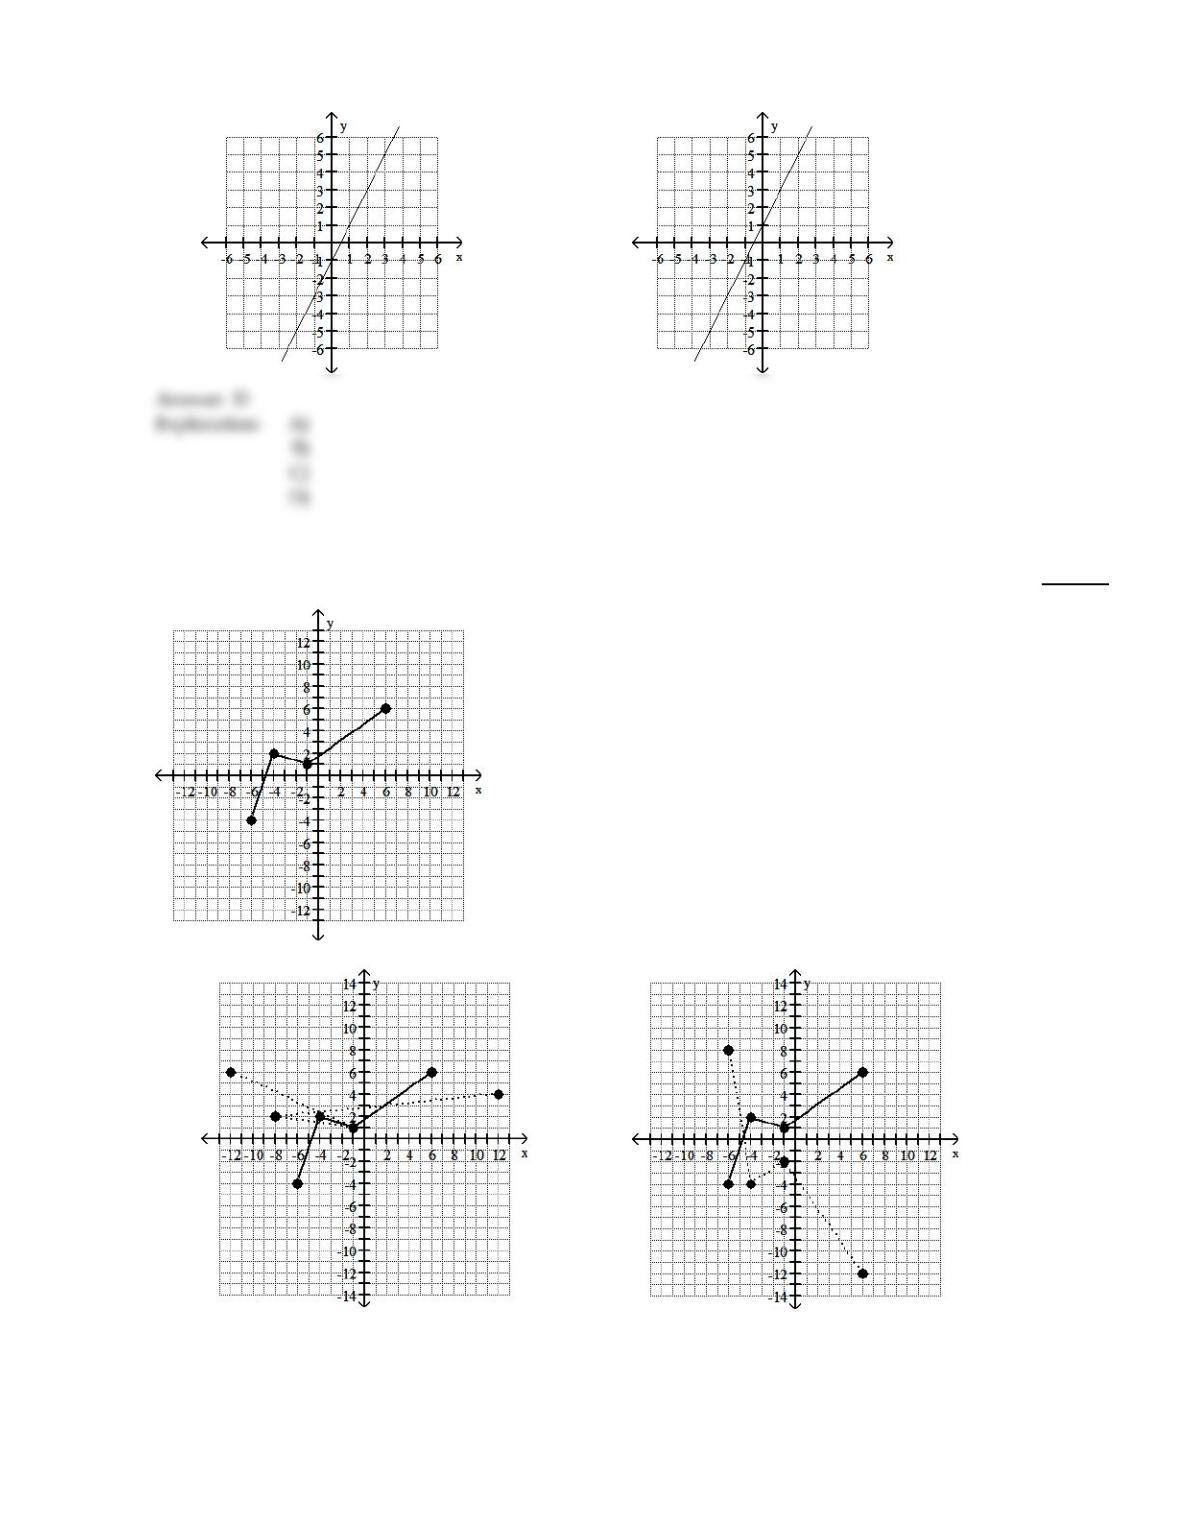
Use the graph of y = f(x) to graph the given function g.
87)
g(x) = – 2f(x)
87)
A)
B)
42
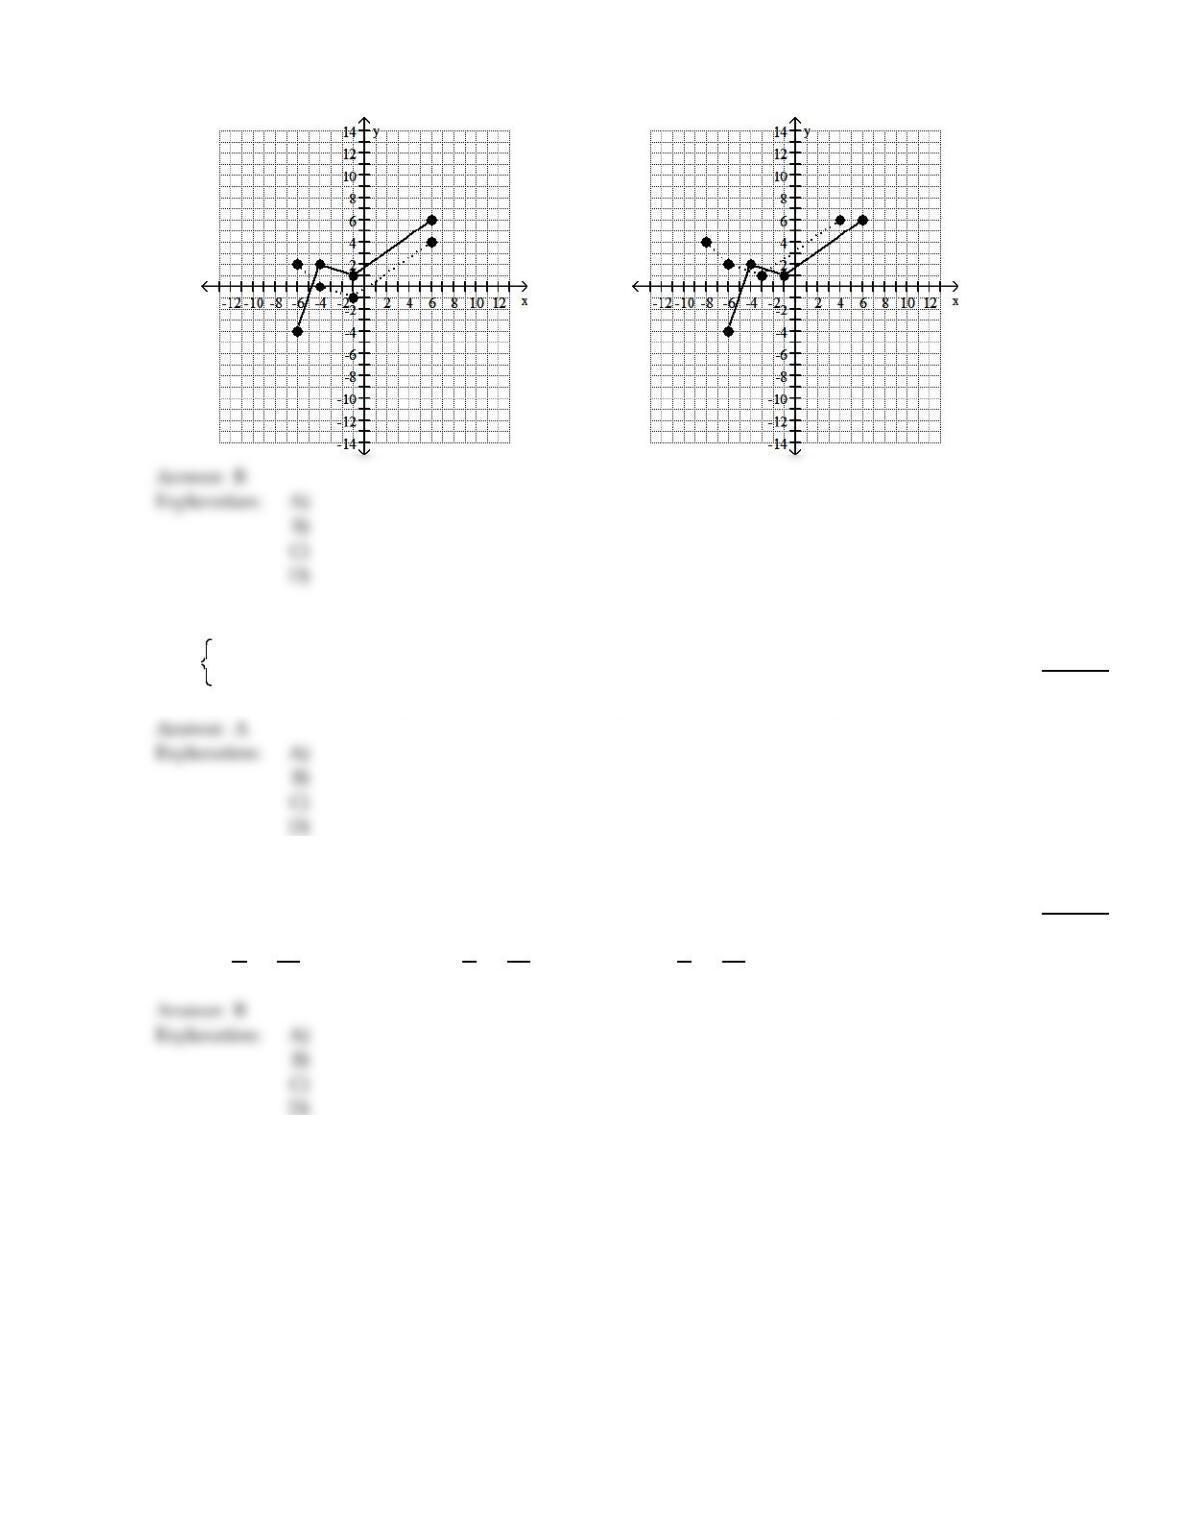
C)
D)
Evaluate the piecewise function at the given value of the independent variable.
88)
f(x) =3x – 2 if x <1
2x + 3 if x 1; f(1)
88)
A)
5
B)
0
C)
6
D)
3
Use the given conditions to write an equation for the line in the indicated form.
89)
Passing through (2, 5) and perpendicular to the line whose equation is –8x + y –8= 0;
slope–intercept form
89)
A)
y =1
8x –21
4
B)
y = – 1
8x +21
4
C)
y = – 1
8x –21
4
D)
y = – 8x – 42
43
Solve.
90)
The average value of a certain type of automobile was $14,640 in 1994 and depreciated to $6240 in
1997. Let y be the average value of the automobile in the year x, where x = 0 represents 1994. Write
a linear equation that models the value of the automobile in terms of the year x.
90)
A)
y = – 2800x – 2160
B)
y = – 1
2800 x – 6240
C)
y = – 2800x +6240
D)
y = – 2800x +14,640
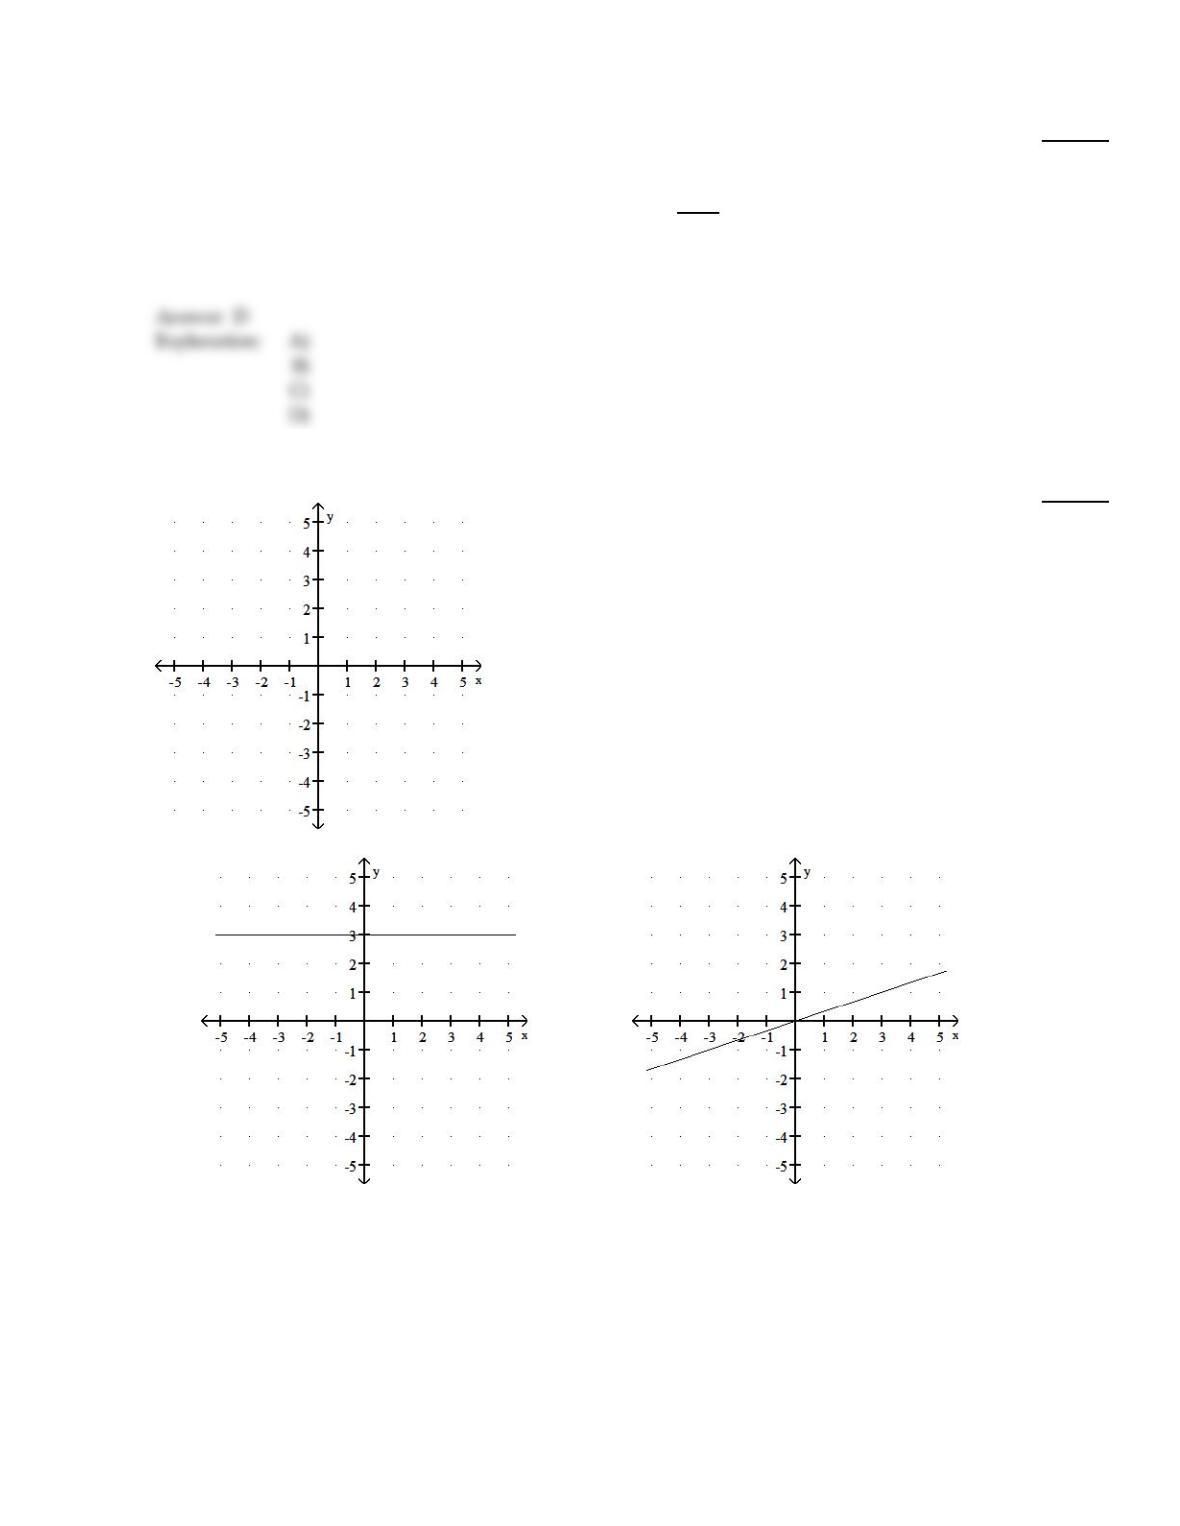
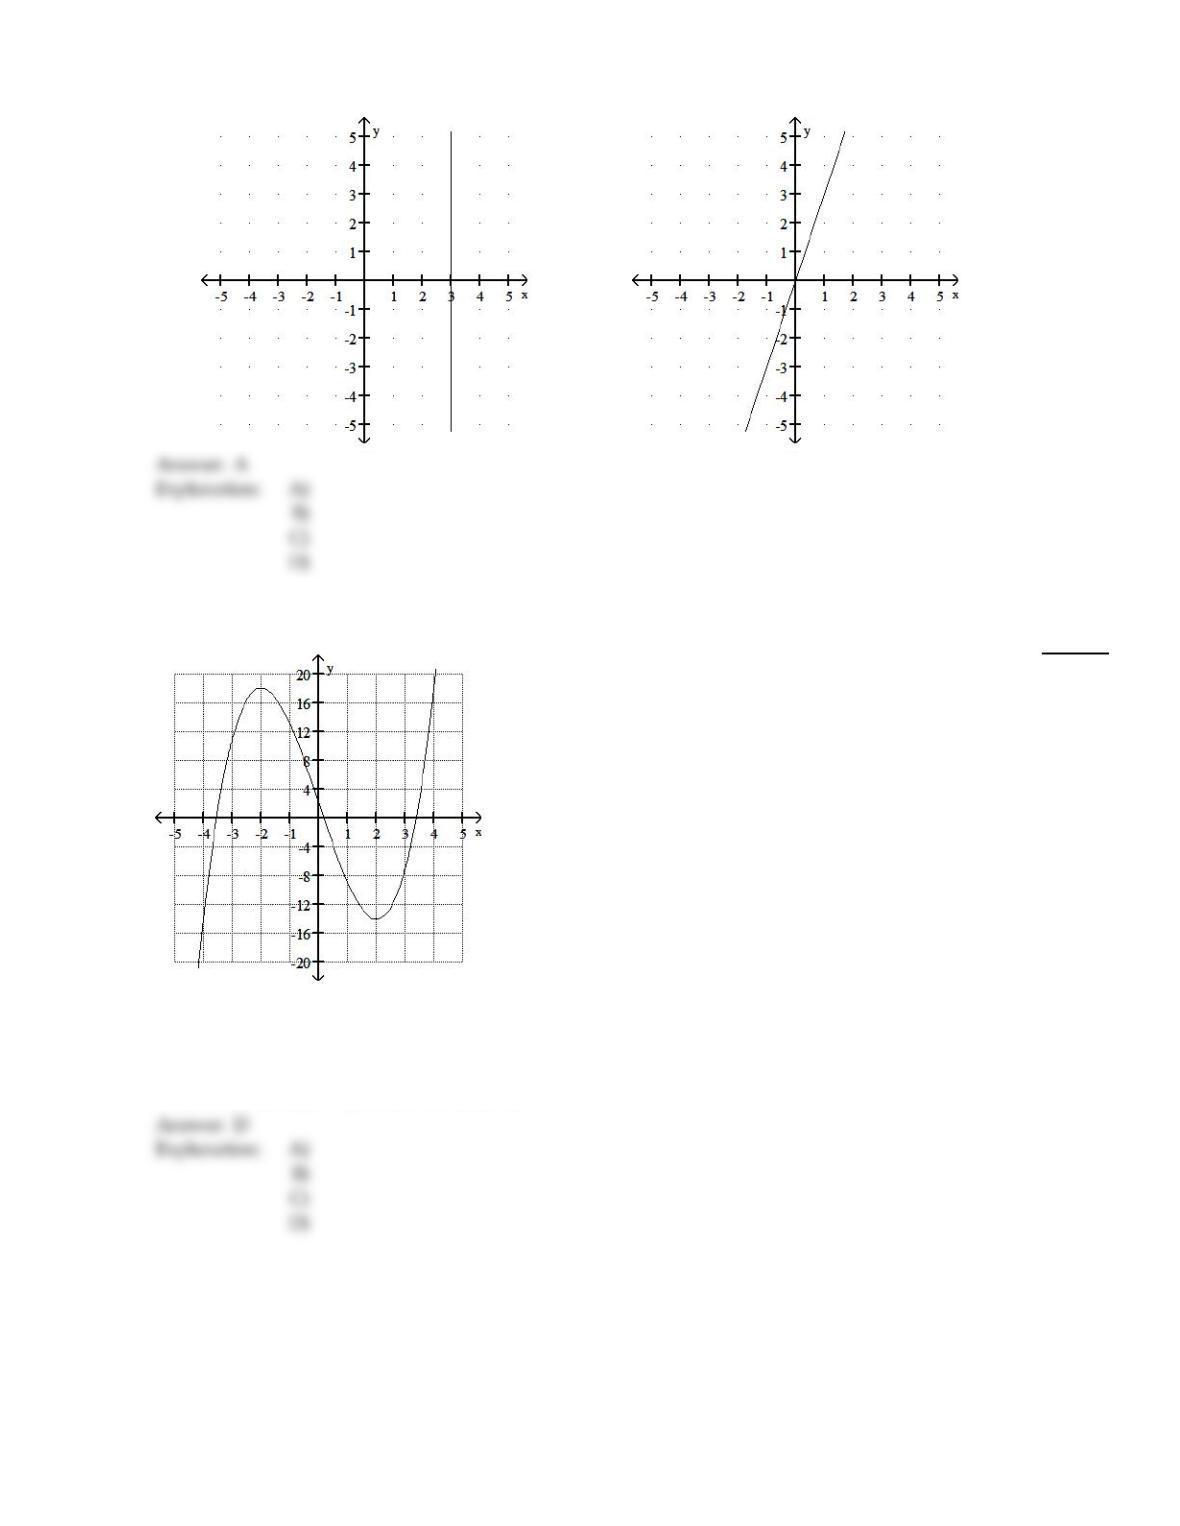
Graph the equation in the rectangular coordinate system.
91)
f(x) =3
91)
A)
B)
44
C)
D)
Use the graph of the given function to find any relative maxima and relative minima.
92)
f(x) = x3– 12x + 2
92)
A)
no maximum or minimum
B)
maximum: (–2, 18) and (0, 0); minimum: (2, –14)
C)
maximum: (2, –14); minimum: (–2, 18)
D)
minimum: (2, –14); maximum: (–2, 18)
45
Find functions f and g so that h(x) = (f
g)(x).
93)
h(x) = – 7x2+ 15
93)
A)
f(x) =x, g(x) = – 7x2+ 15
B)
f(x) = – 7x + 15, g(x) = x2
C)
f(x) =–7x2, g(x) =15
D)
f(x) = – 7x2+ 15, g(x) =x
Find the midpoint of the line segment whose end points are given.
94)
(2, – 3) and (3
2, – 1)
94)
A)
(7
4, – 2)
B)
(–1
4, 1)
C)
(7
2, – 4)
D)
(1
4, – 1)
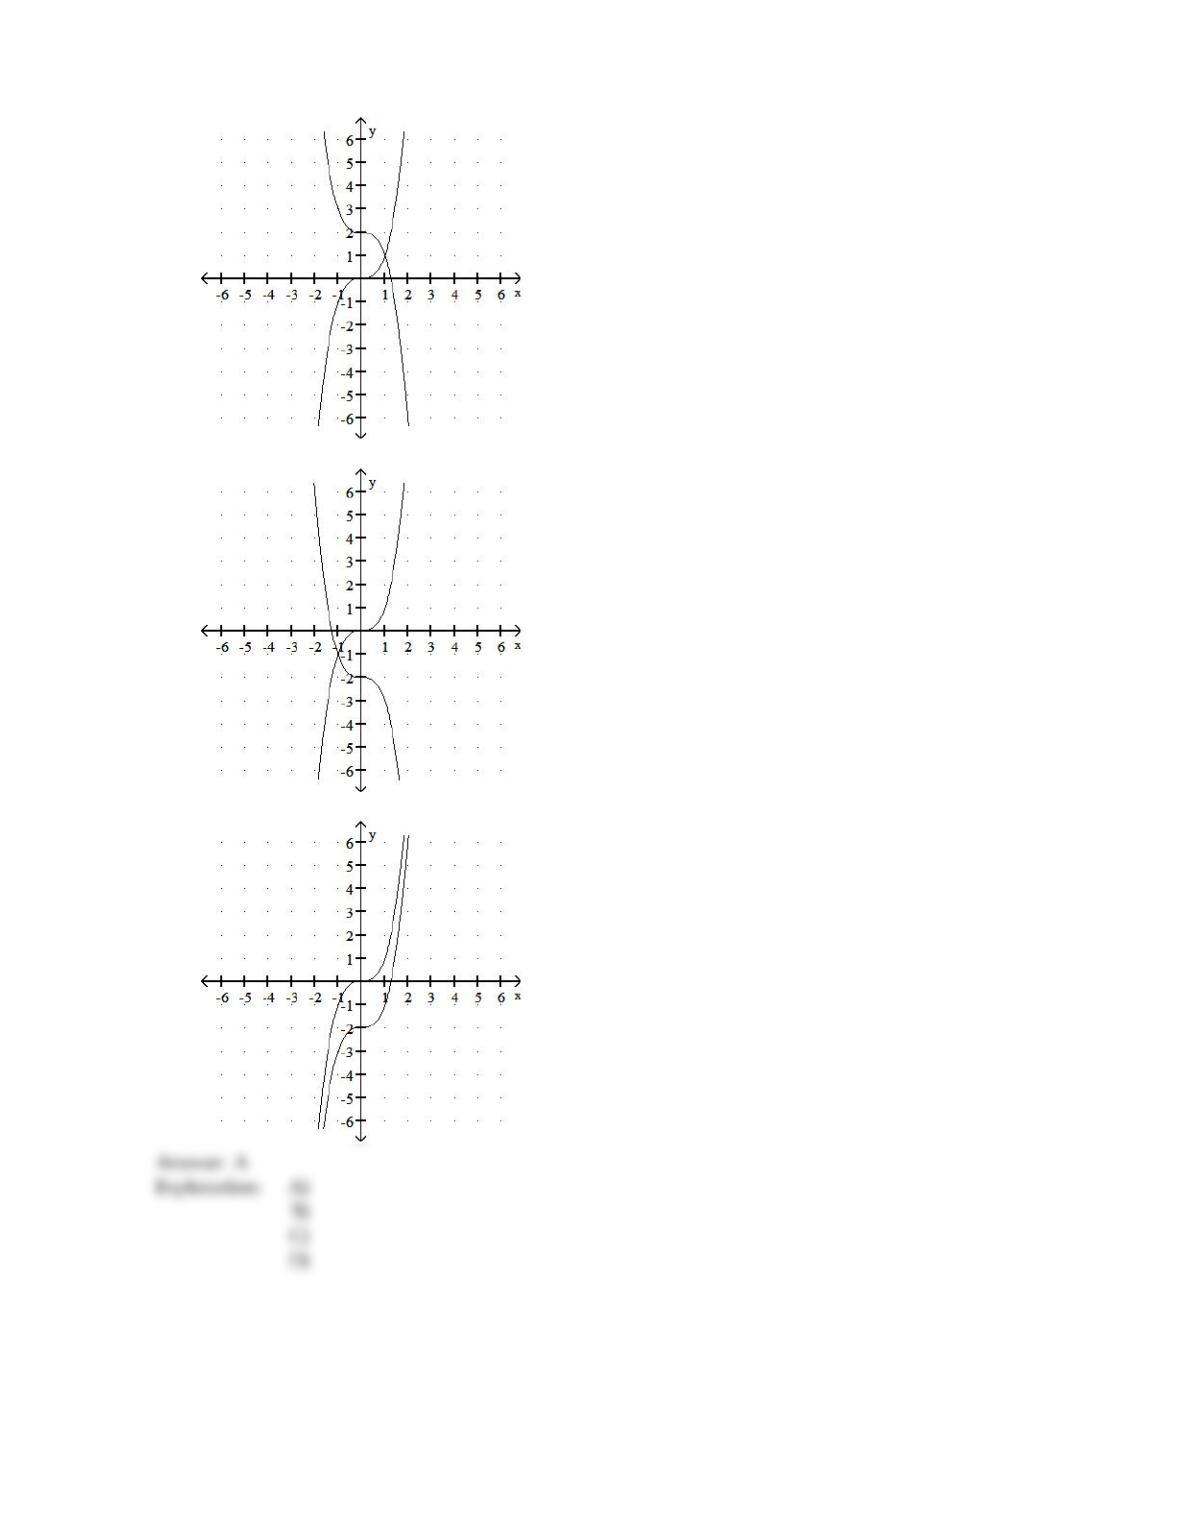
Begin by graphing the standard cubic function f(x) =x3. Then use transformations of this graph to graph the given
function.
95)
g(x) = – 1
4x3
95)
A)
B)
46
C)
D)
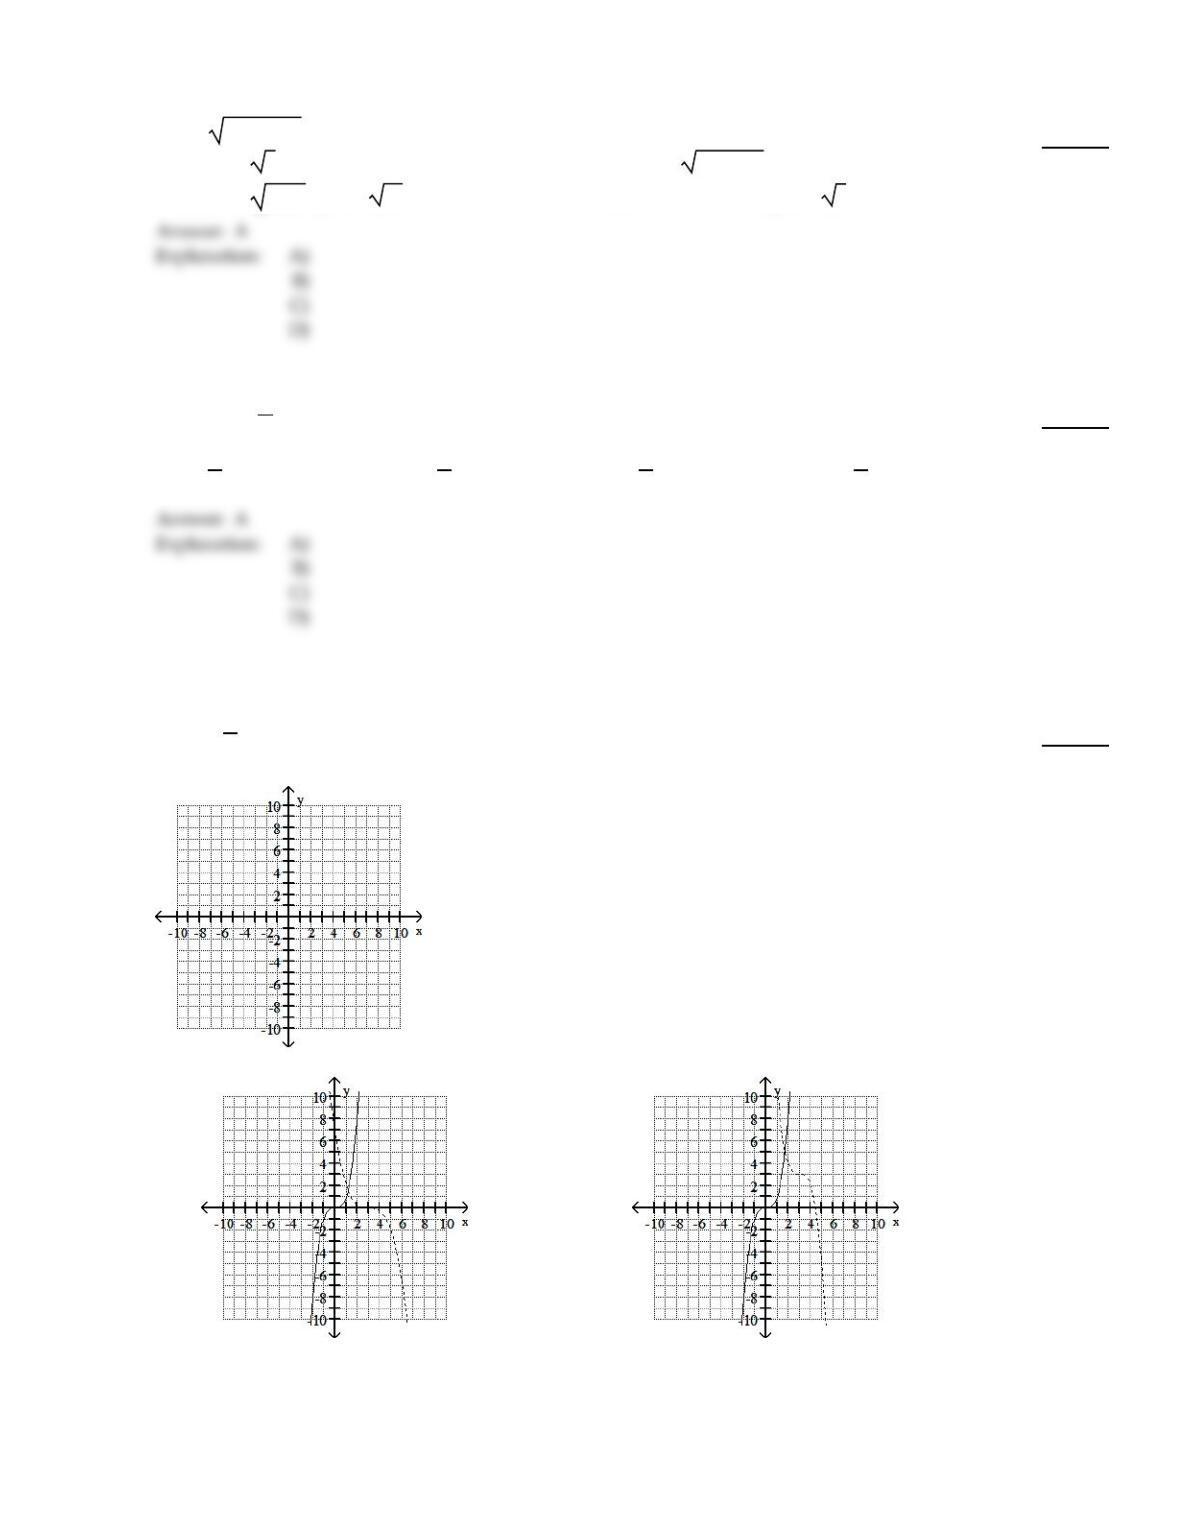
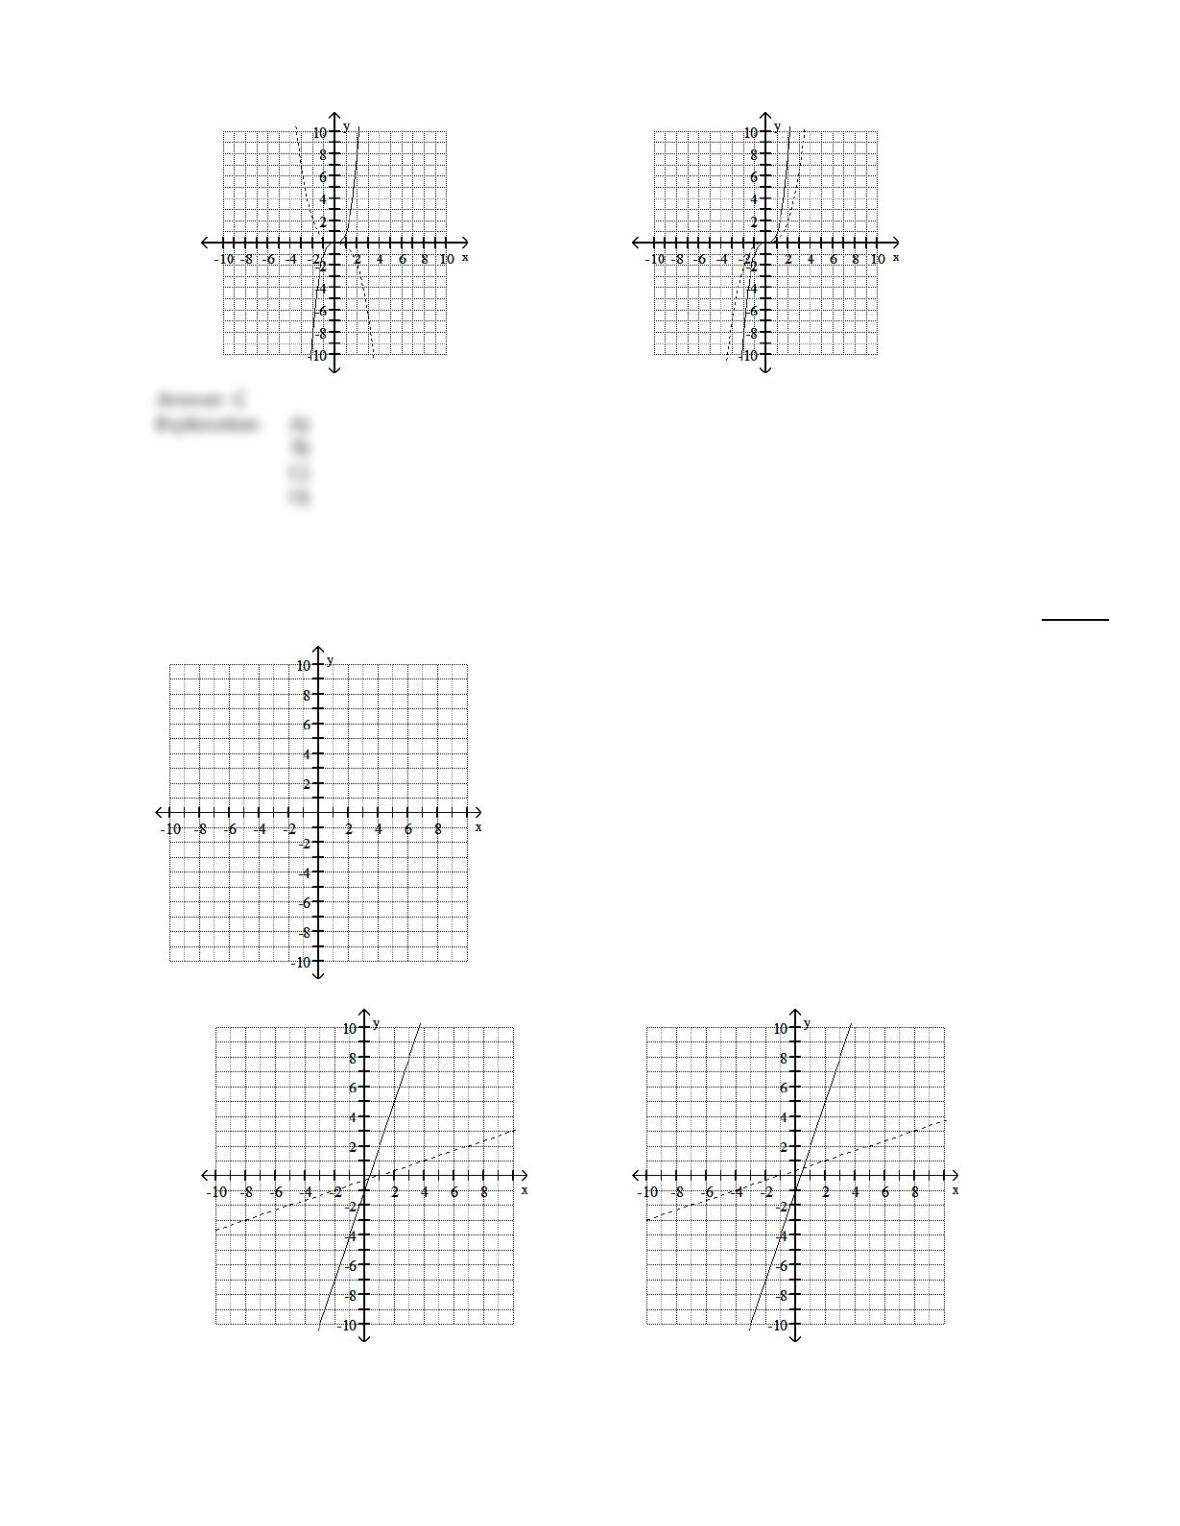
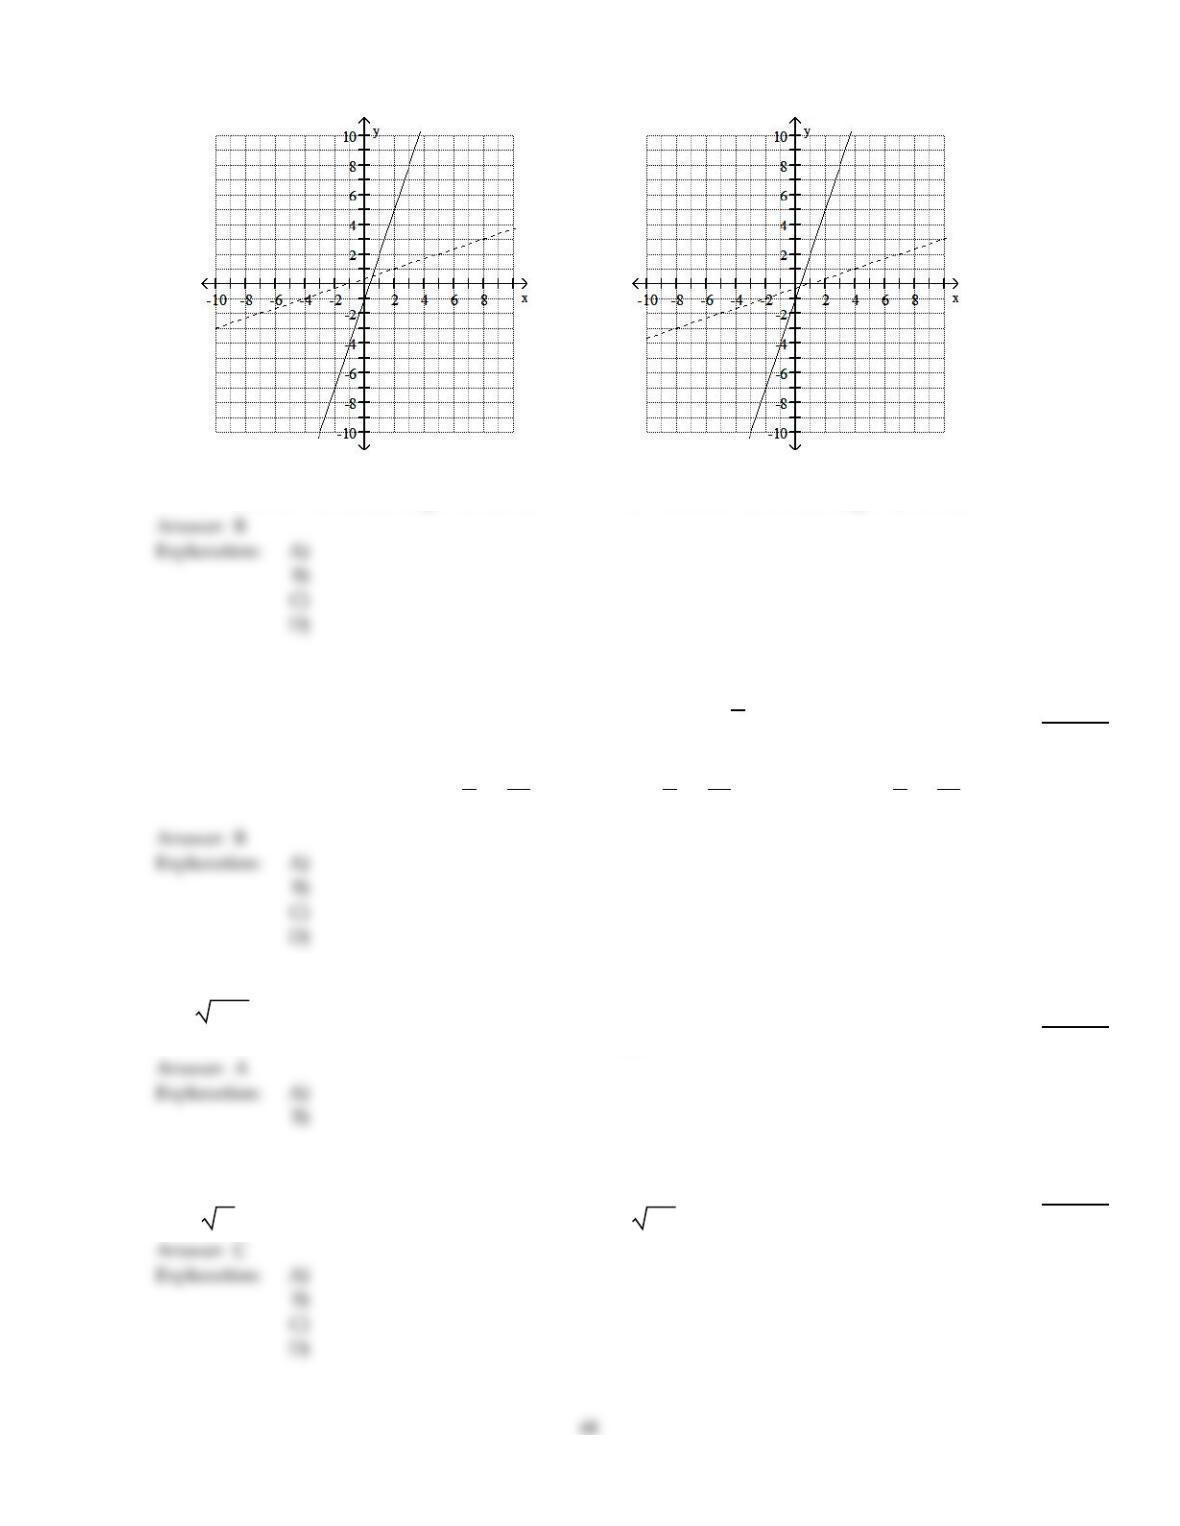
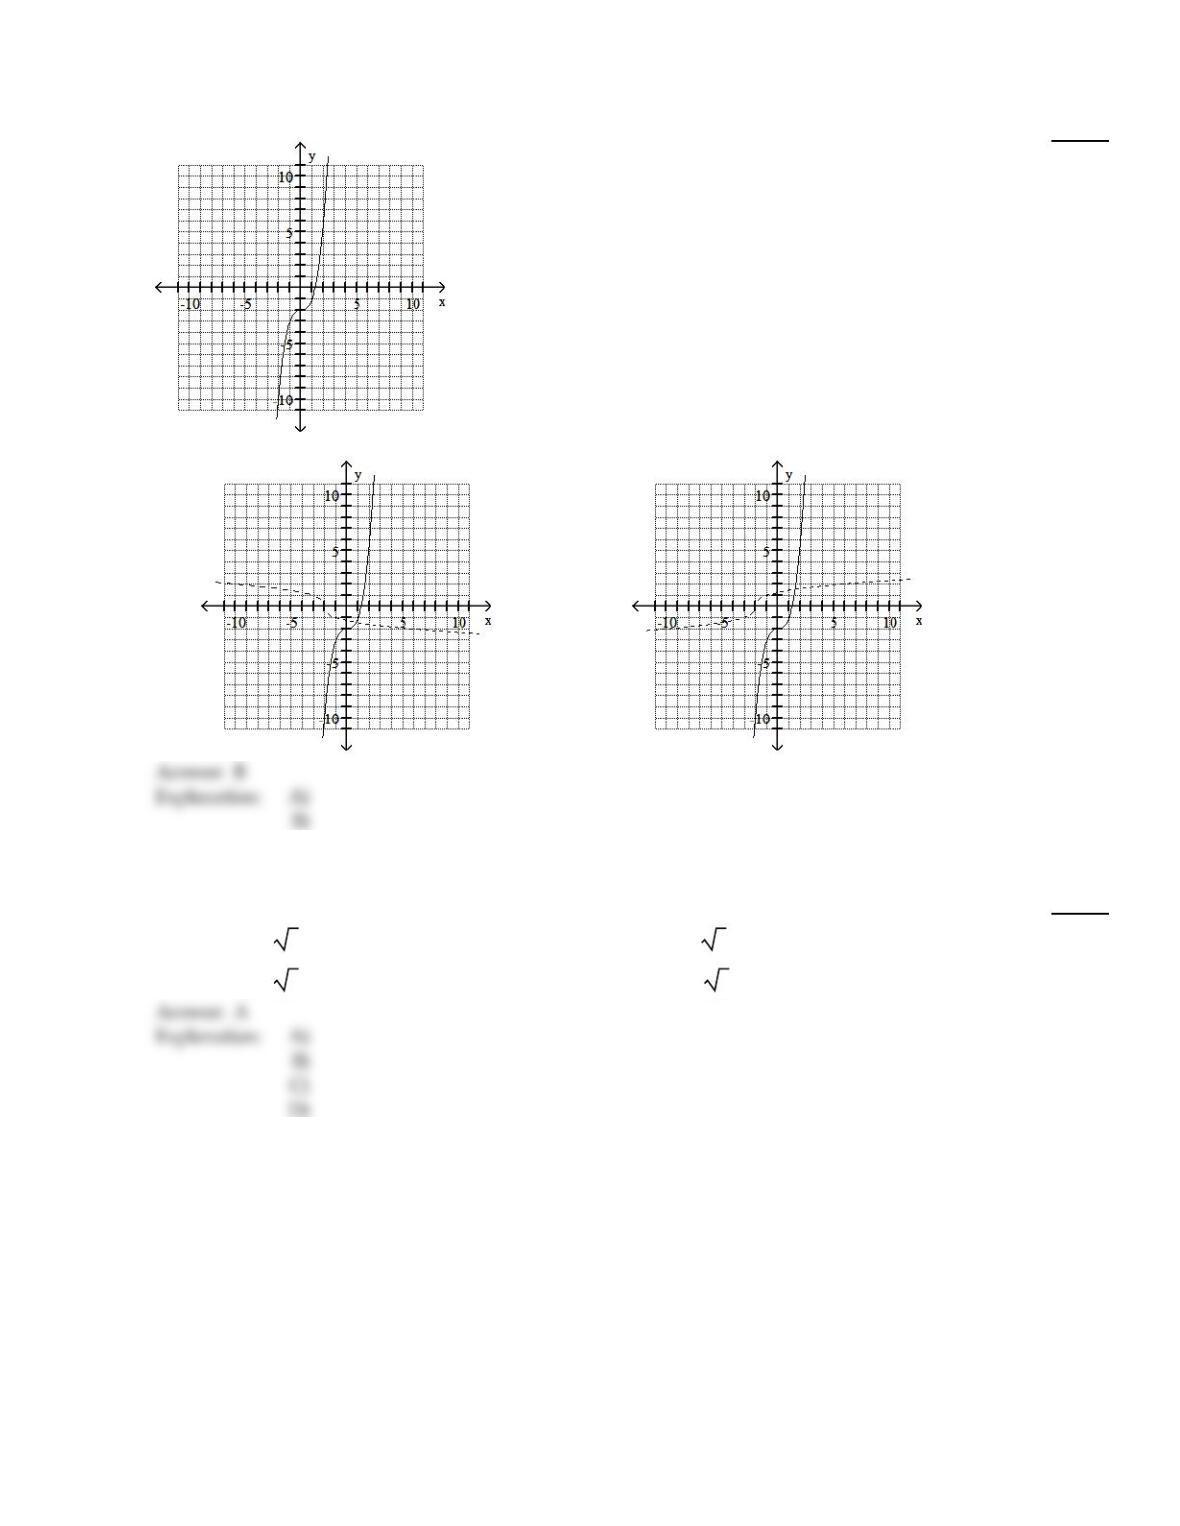
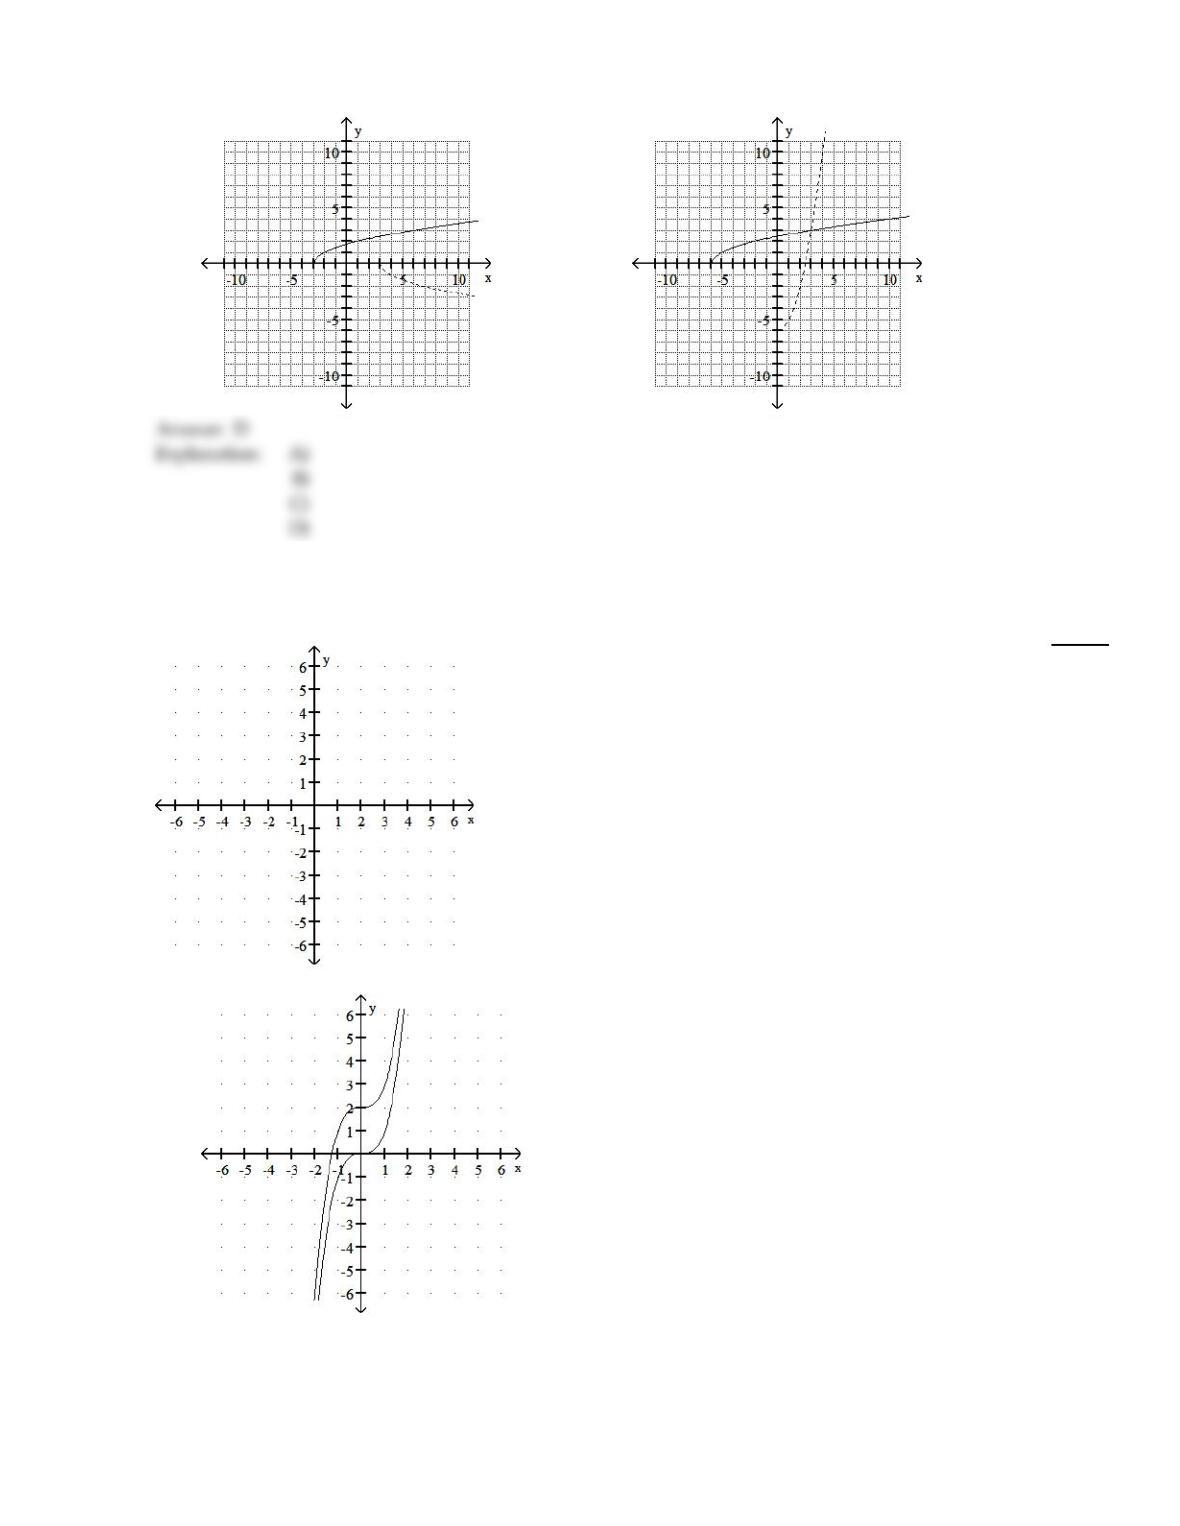
Graph f as a solid line and f–1 as a dashed line in the same rectangular coordinate space. Use interval notation to give the
domain and range of f and f–1.
96)
f(x) =3x –1
96)
A)
f domain = (–, ); range = (–, )
f–1 domain =(–, ); range = (–, )
B)
f domain = (–, ); range = (–, )
f–1 domain =(–, ); range = (–, )
47
C)
f domain = (–10, 10); range = (–10, 10)
f–1 domain =(–10, 10); range = (–10, 10)
D)
f domain = (–10, 10); range = (–10, 10)
f–1 domain =(–10, 10); range = (–10, 10)
Use the given conditions to write an equation for the line in the indicated form.
97)
Passing through (5, 4) and parallel to the line whose equation is y = – 1
6x +2;
slope–intercept form
97)
A)
y = – 6x – 29
B)
y = – 1
6x +29
6
C)
y =1
6x –29
6
D)
y = – 1
6x –29
6
B
Determine whether the equation defines y as a function of x.
98)
y = – x –9
98)
A)
y is a function of x
B)
y is not a function of x
A
Find the distance between the pair of points.
99)
(7, 3) and (–2, –7)
99)
A)
19
B)
90
C)
181
D)
–1
C
B
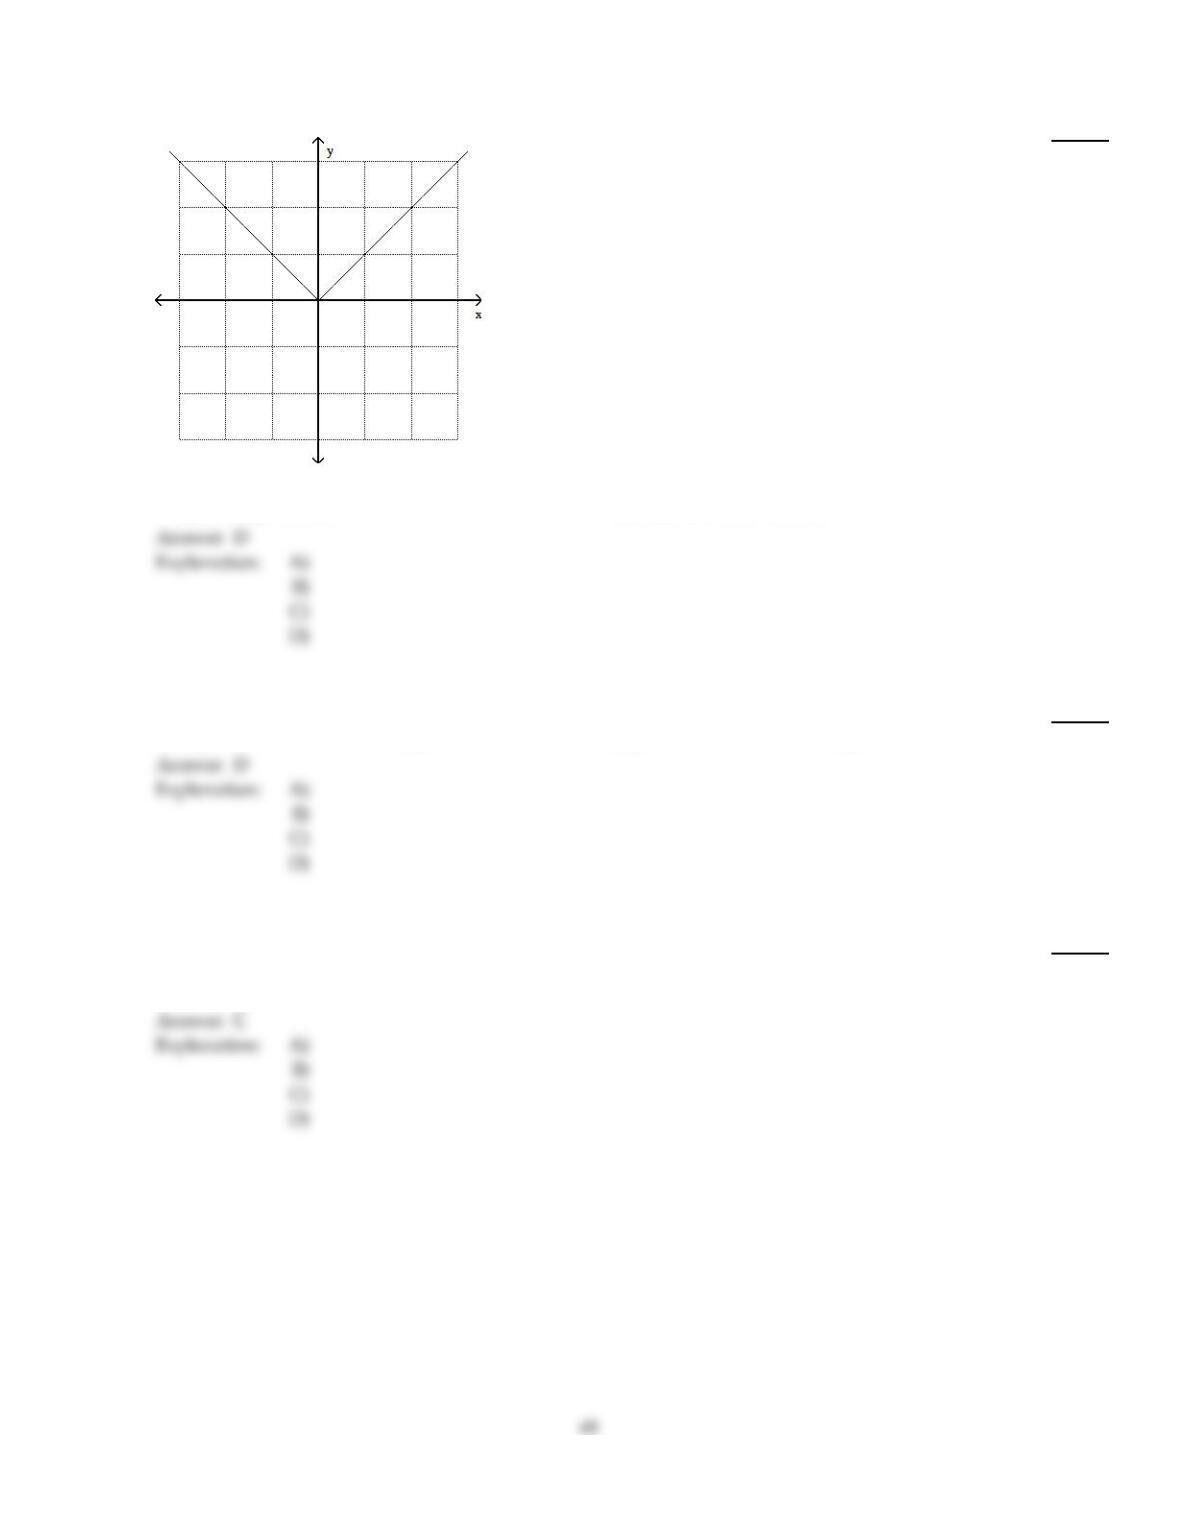
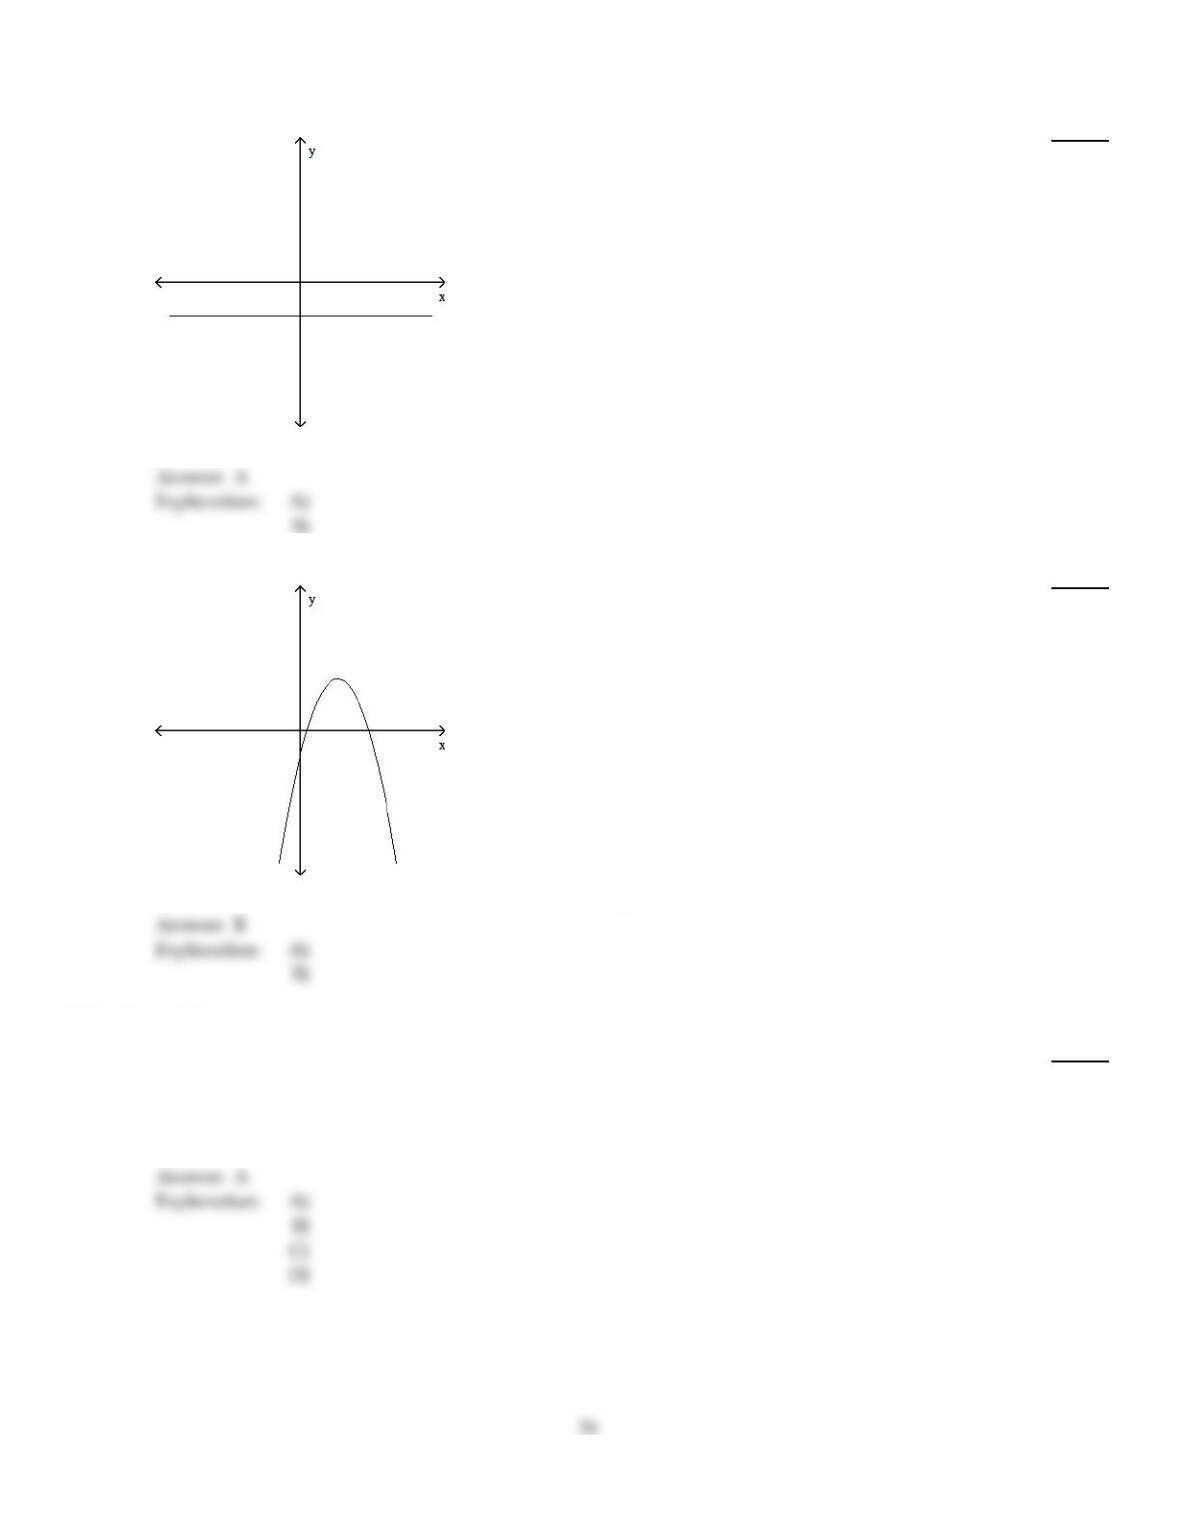
Use the shape of the graph to name the function.
100)
100)
A)
Standard cubic function
B)
Constant function
C)
Identity function
D)
Absolute value function
Use the given conditions to write an equation for the line in slope–intercept form.
101)
Slope =3, passing through (3, 8)
101)
A)
y =3x + 1
B)
y – 8 = x – 3
C)
y – 8 =3x – 3
D)
y =3x – 1
For the given functions f and g , find the indicated composition.
102)
f(x) =14x2– 10x, g(x) =7x – 8
(f
g)(9)
102)
A)
57,420
B)
34,500
C)
41,800
D)
7300
Find the inverse of the one–to–one function.
103)
f(x) =x – 8
103)
A)
f–1(x) =1
x2+ 8
B)
f–1(x) =x2– 8
C)
f–1(x) =x2+ 8
D)
f–1(x) = x + 8
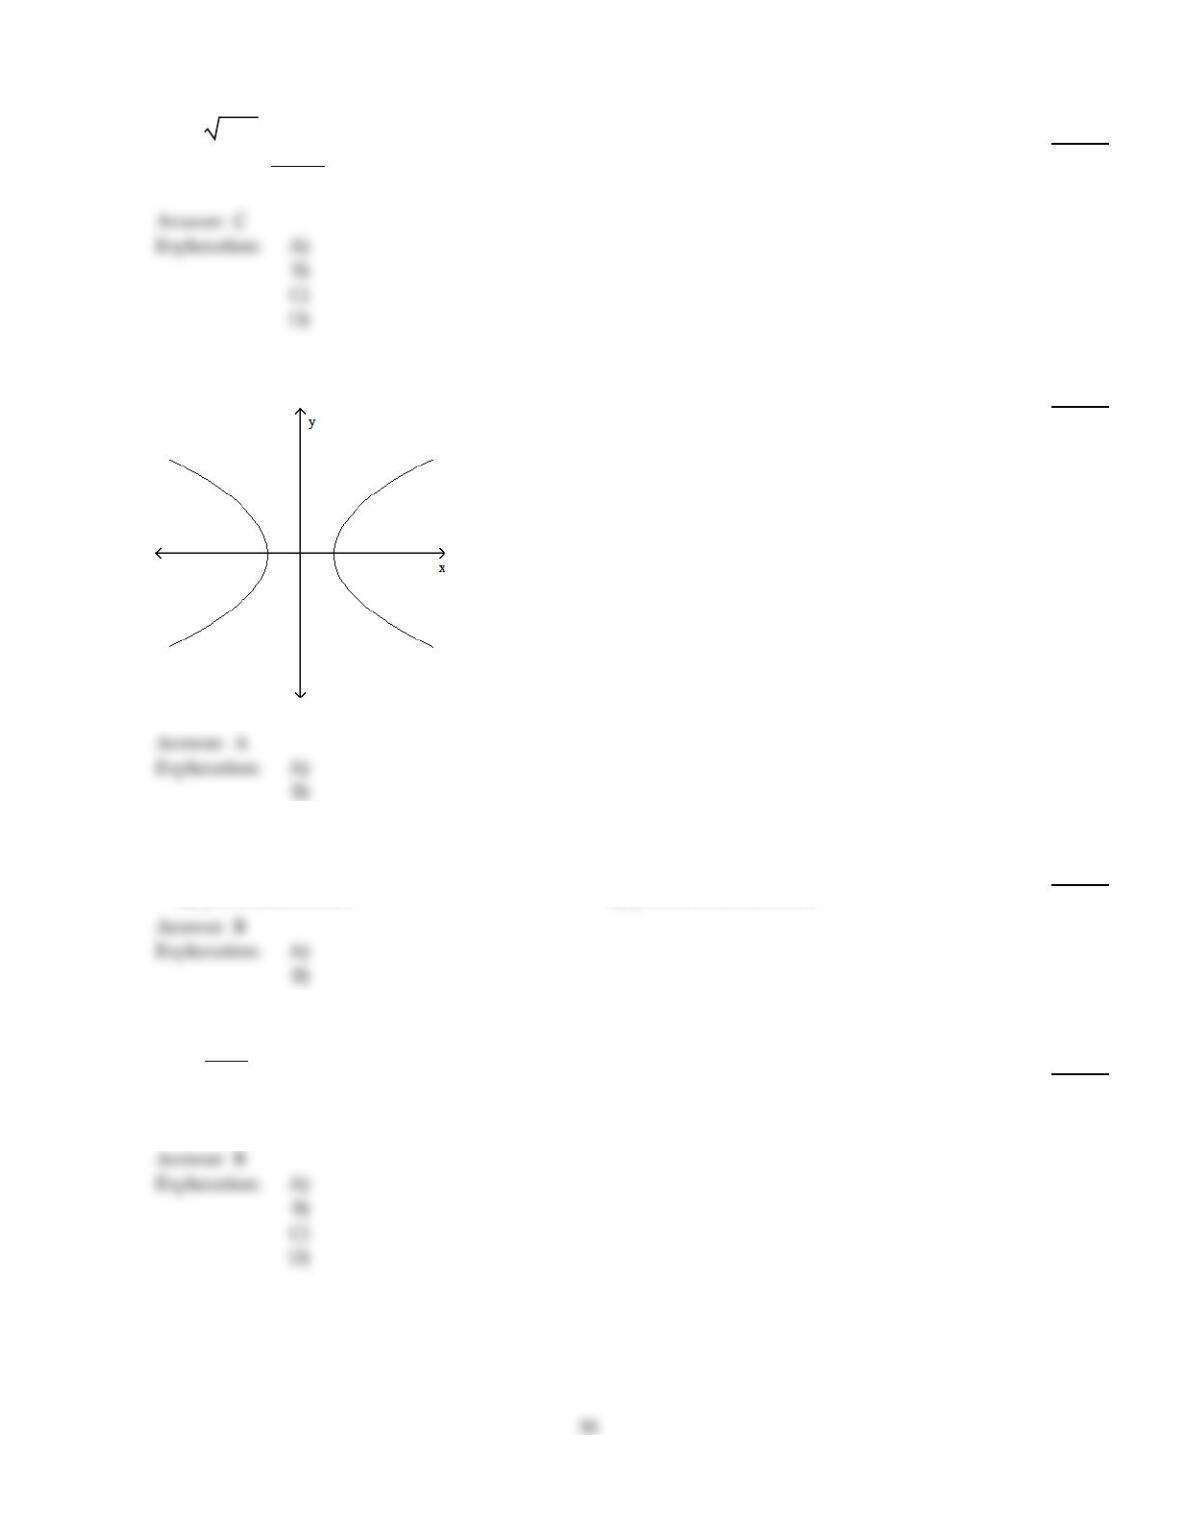
Use the vertical line test to determine whether or not the graph is a graph in which y is a function of x.
104)
104)
A)
not a function
B)
function
A
Determine whether the equation defines y as a function of x.
105)
x +y2=4
105)
A)
y is a function of x
B)
y is not a function of x
B
Find the domain of the composite function f
g.
106)
f(x) =6
x +8,g(x) = x +1
106)
A)
(–, )
B)
(–, –9) or (–9, )
C)
(–, –8) or (–8, )
D)
(–, –8) or (–8, –1) or (–1, )
B
C
Use the shape of the graph to name the function.
107)
107)
A)
Identity function
B)
Constant function
C)
Absolute value function
D)
Standard cubic function
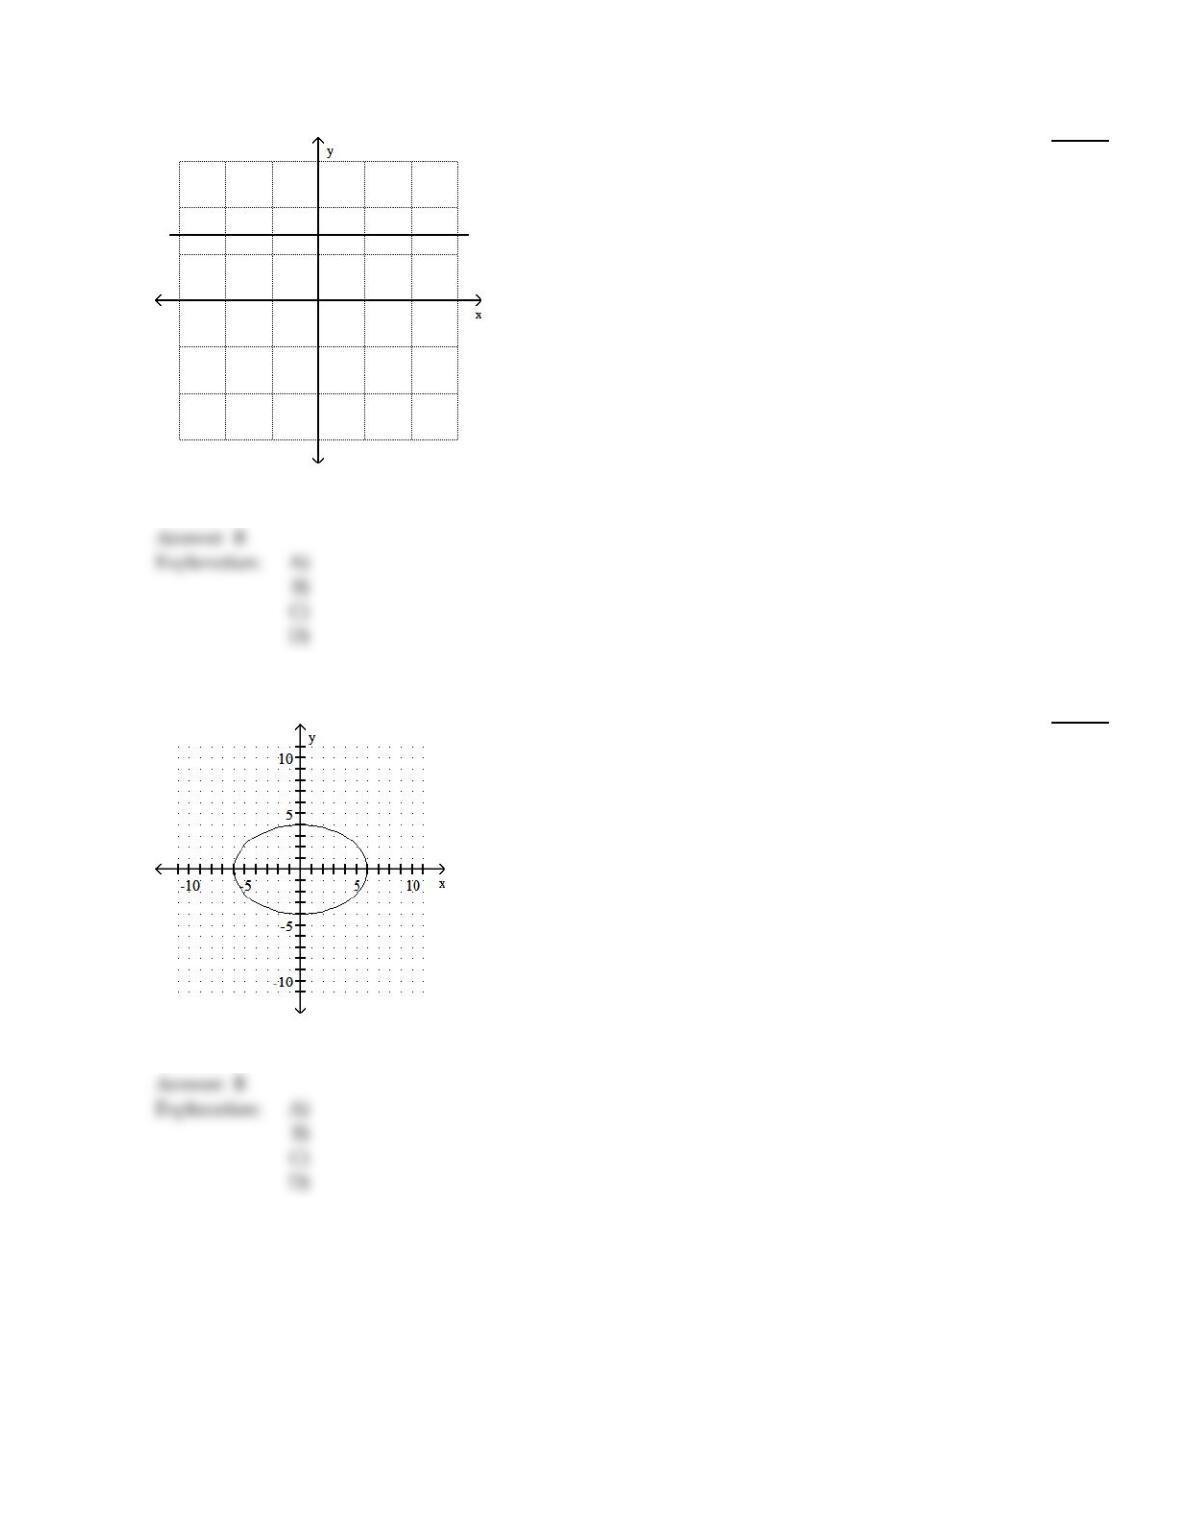
Identify the intercepts.
108)
108)
A)
(4, 0), (–4, 0), (0, 6), (0, –6)
B)
(6, 0), (–6, 0), (0, 4), (0, –4)
C)
(0, 4), (0, –4)
D)
(6, 0), (–6, 0)
B
Graph the given functions on the same rectangular coordinate system. Describe how the graph of g is related to the graph
of f.
51
B
109)
f(x) =x, g(x) =x+2
109)
A)
g shifts the graph of f vertically up 2units
B)
g shifts the graph of f vertically down 2units
52
C)
g shifts the graph of f vertically up 2units
D)
g shifts the graph of f vertically down 2units
53
Does the graph represent a function that has an inverse function?
110)
110)
A)
No
B)
Yes
111)
111)
A)
Yes
B)
No
Solve the problem.
112)
A salesperson gets a commission of $1400 for the first $10,000 of sales, and then $700 for each
additional $10,000 or partial of sales. Let S(x) represent the commission on x dollars of sales. Find
the value of
S(65,000).
112)
A)
$5600
B)
$4550
C)
$5250
D)
5950
Use the graph of f to draw the graph of its inverse function.
113)
113)
A)
B)
Find the inverse of the one–to–one function.
114)
f(x) =(x + 6)3
114)
A)
f–1(x) =
3x– 6
B)
f–1(x) =x– 6
C)
f–1(x) =
3x– 216
D)
f–1(x) =
3x+ 6
Graph the equation.
55
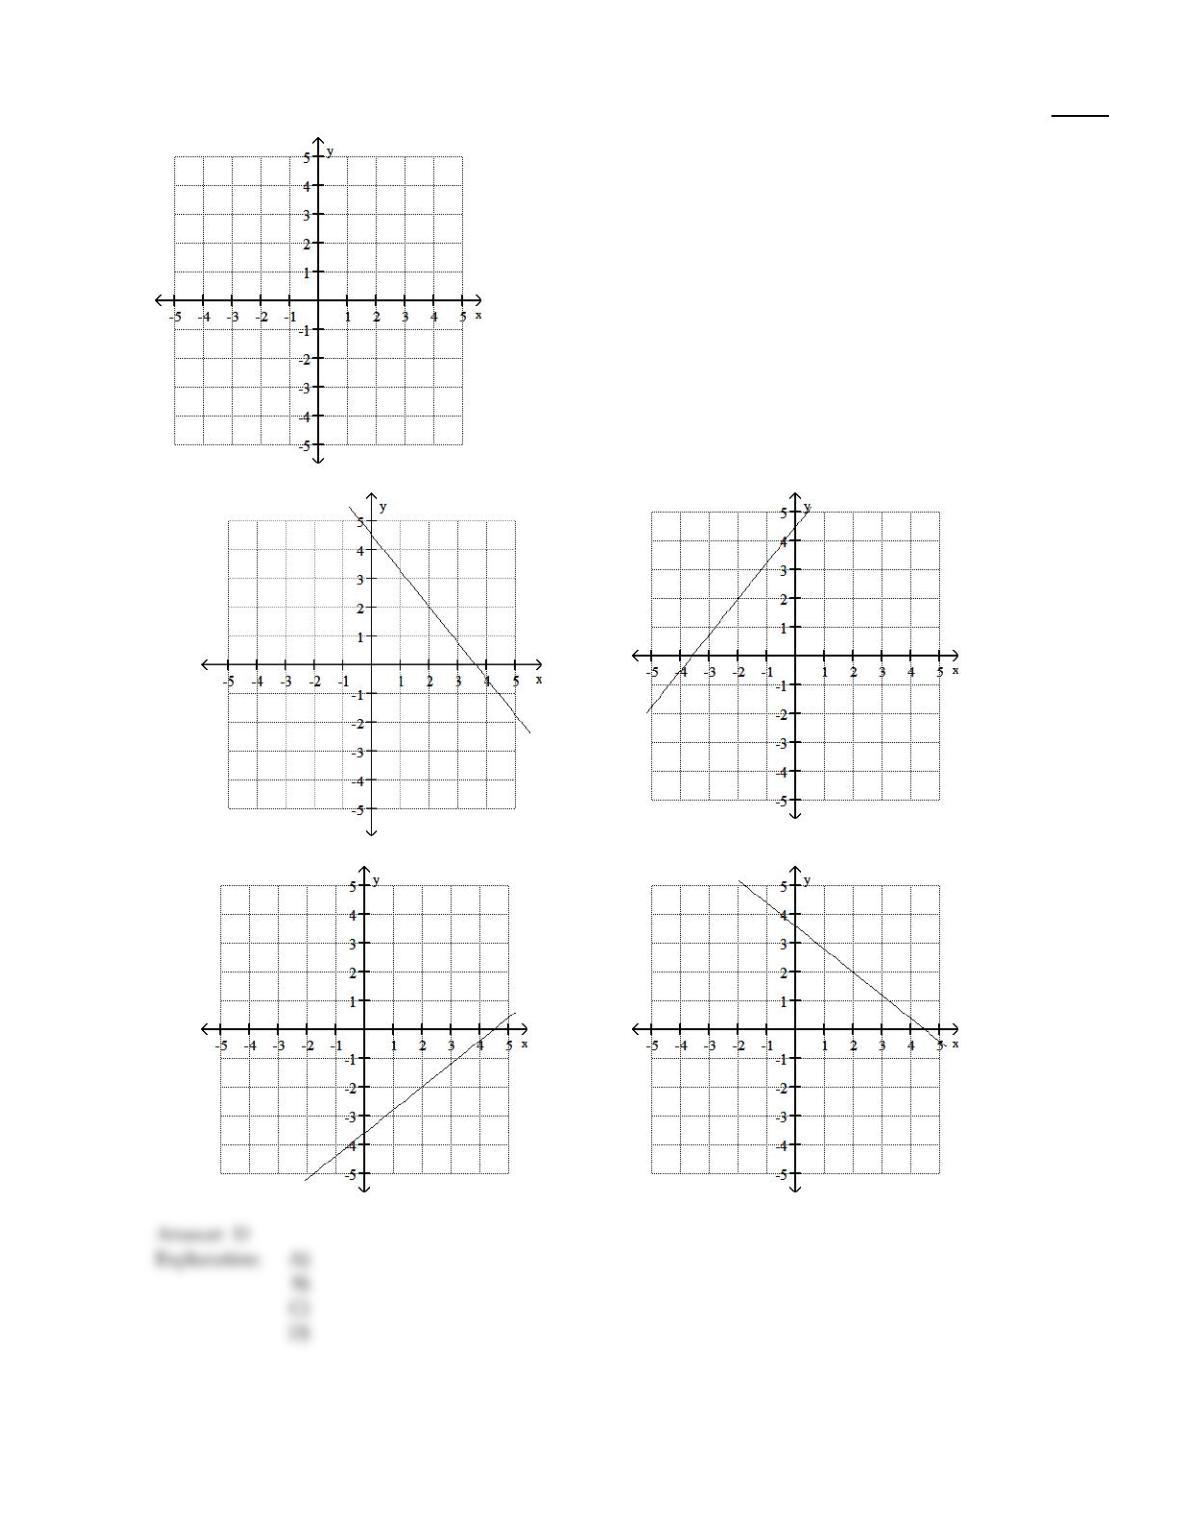
115)
4x + 5y – 18 = 0
115)
A)
B)
C)
D)
56
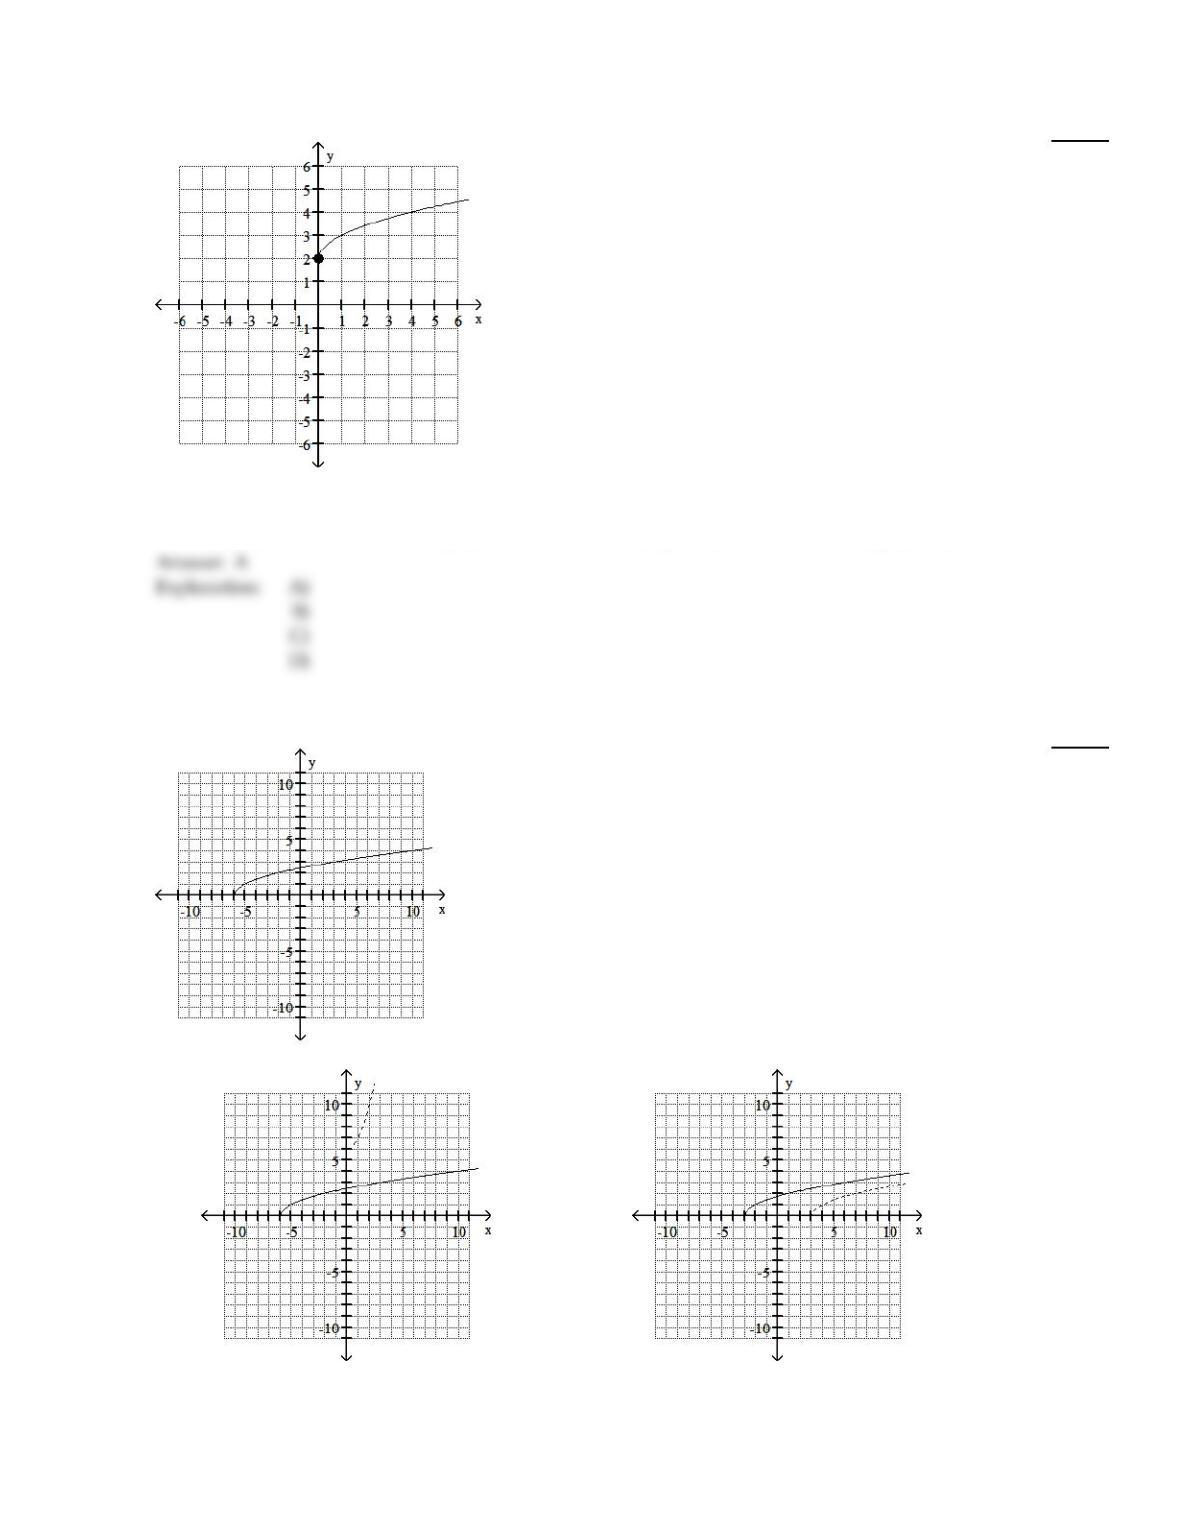
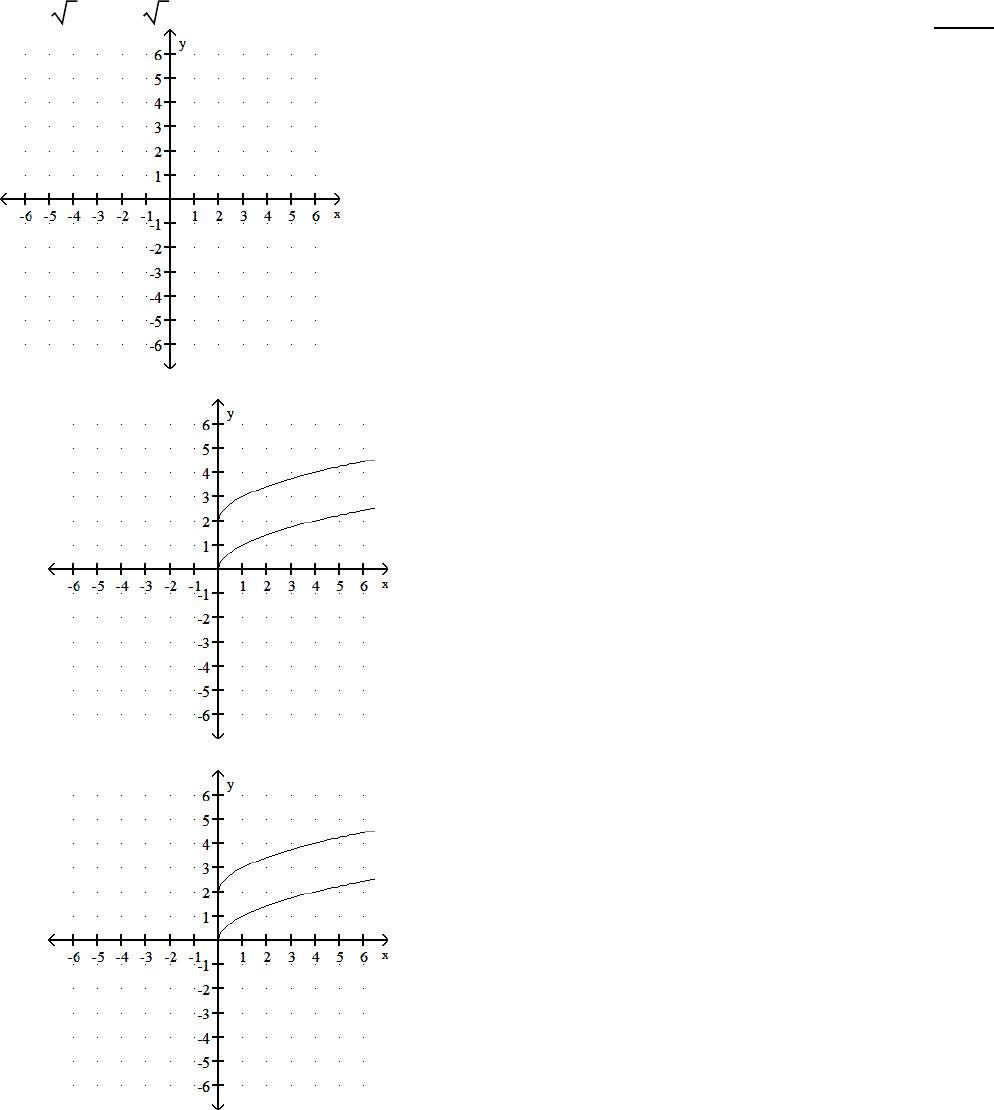
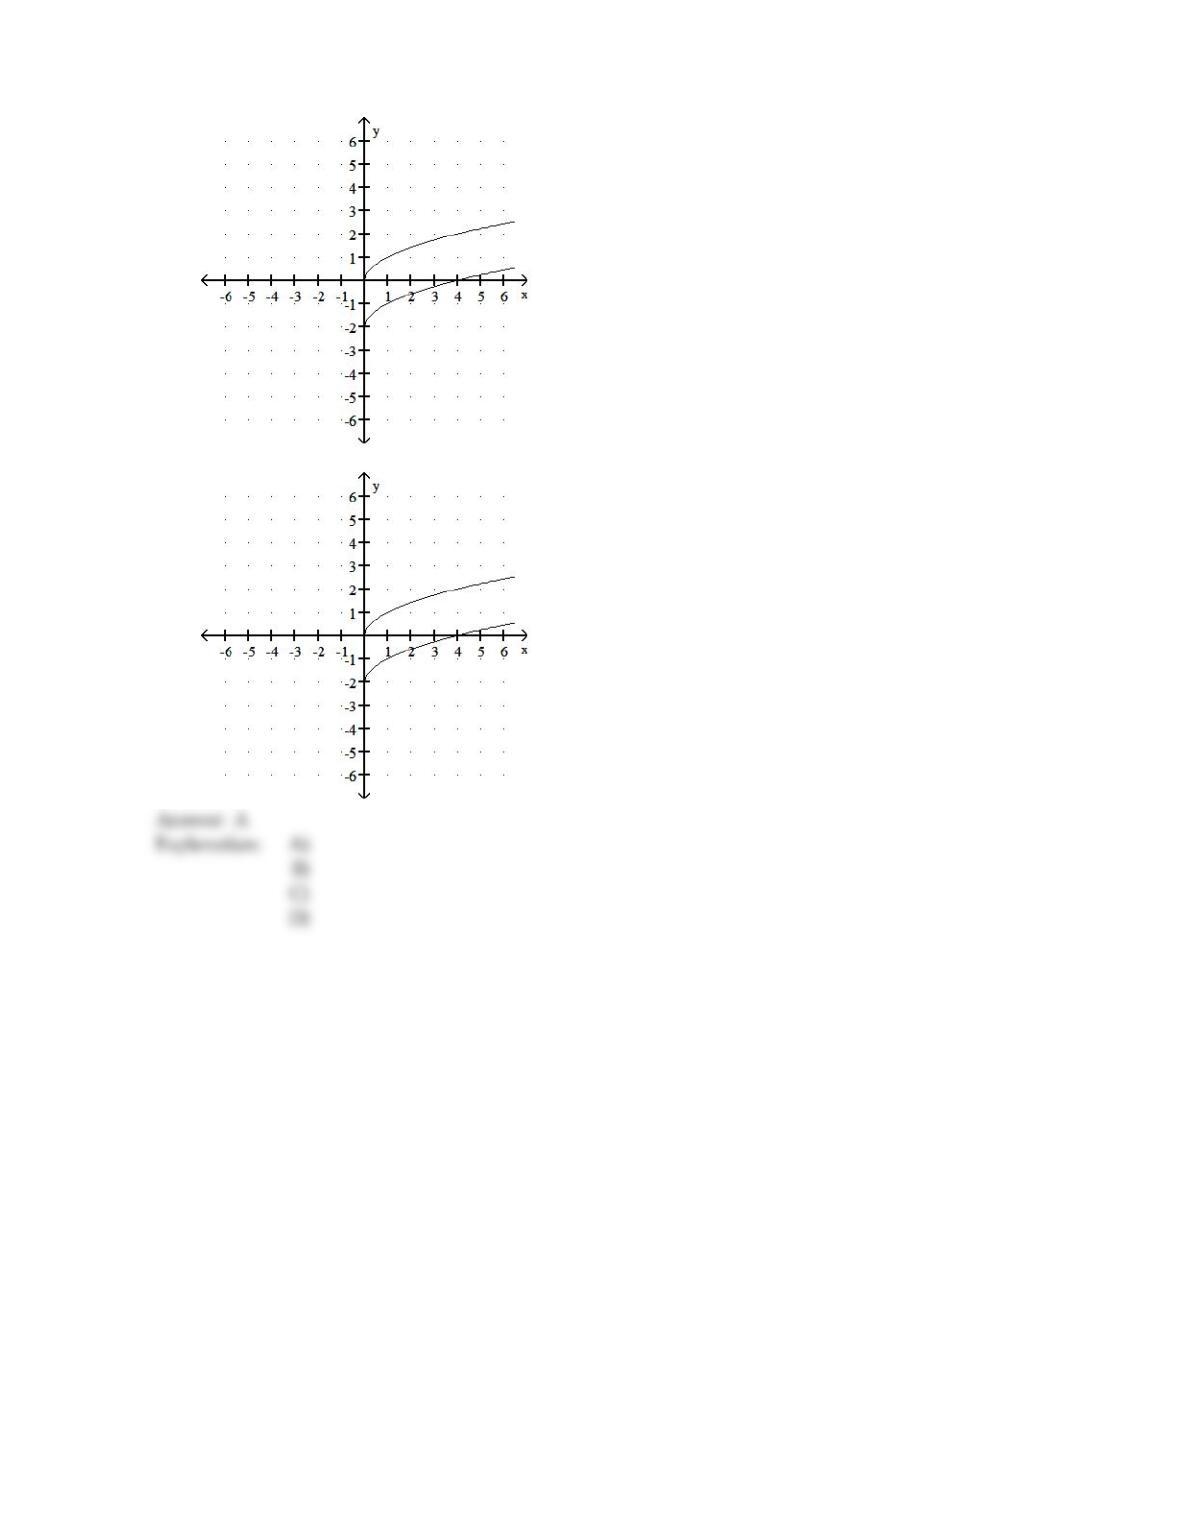
Use the graph to determine the function’s domain and range.
116)
116)
A)
domain: [0, )
range: [2, )
B)
domain: (–, )
range: [2, )
C)
domain: [0, )
range: (–, )
D)
domain: [0, )
range: [0, )
Use the graph of f to draw the graph of its inverse function.
117)
117)
A)
B)
57
C)
D)
Graph the given functions on the same rectangular coordinate system. Describe how the graph of g is related to the graph
of f.
118)
f(x) =x3, g(x) =x3+ 2
118)
A)
g shifts the graph of f vertically up 2 units
58
B)
g shifts the graph of f vertically up 2 units
C)
g shifts the graph of f vertically down 2 units
D)
g shifts the graph of f vertically down 2 units
59
Determine whether the equation defines y as a function of x.
119)
x2+ y =16
119)
A)
y is a function of x
B)
y is not a function of x
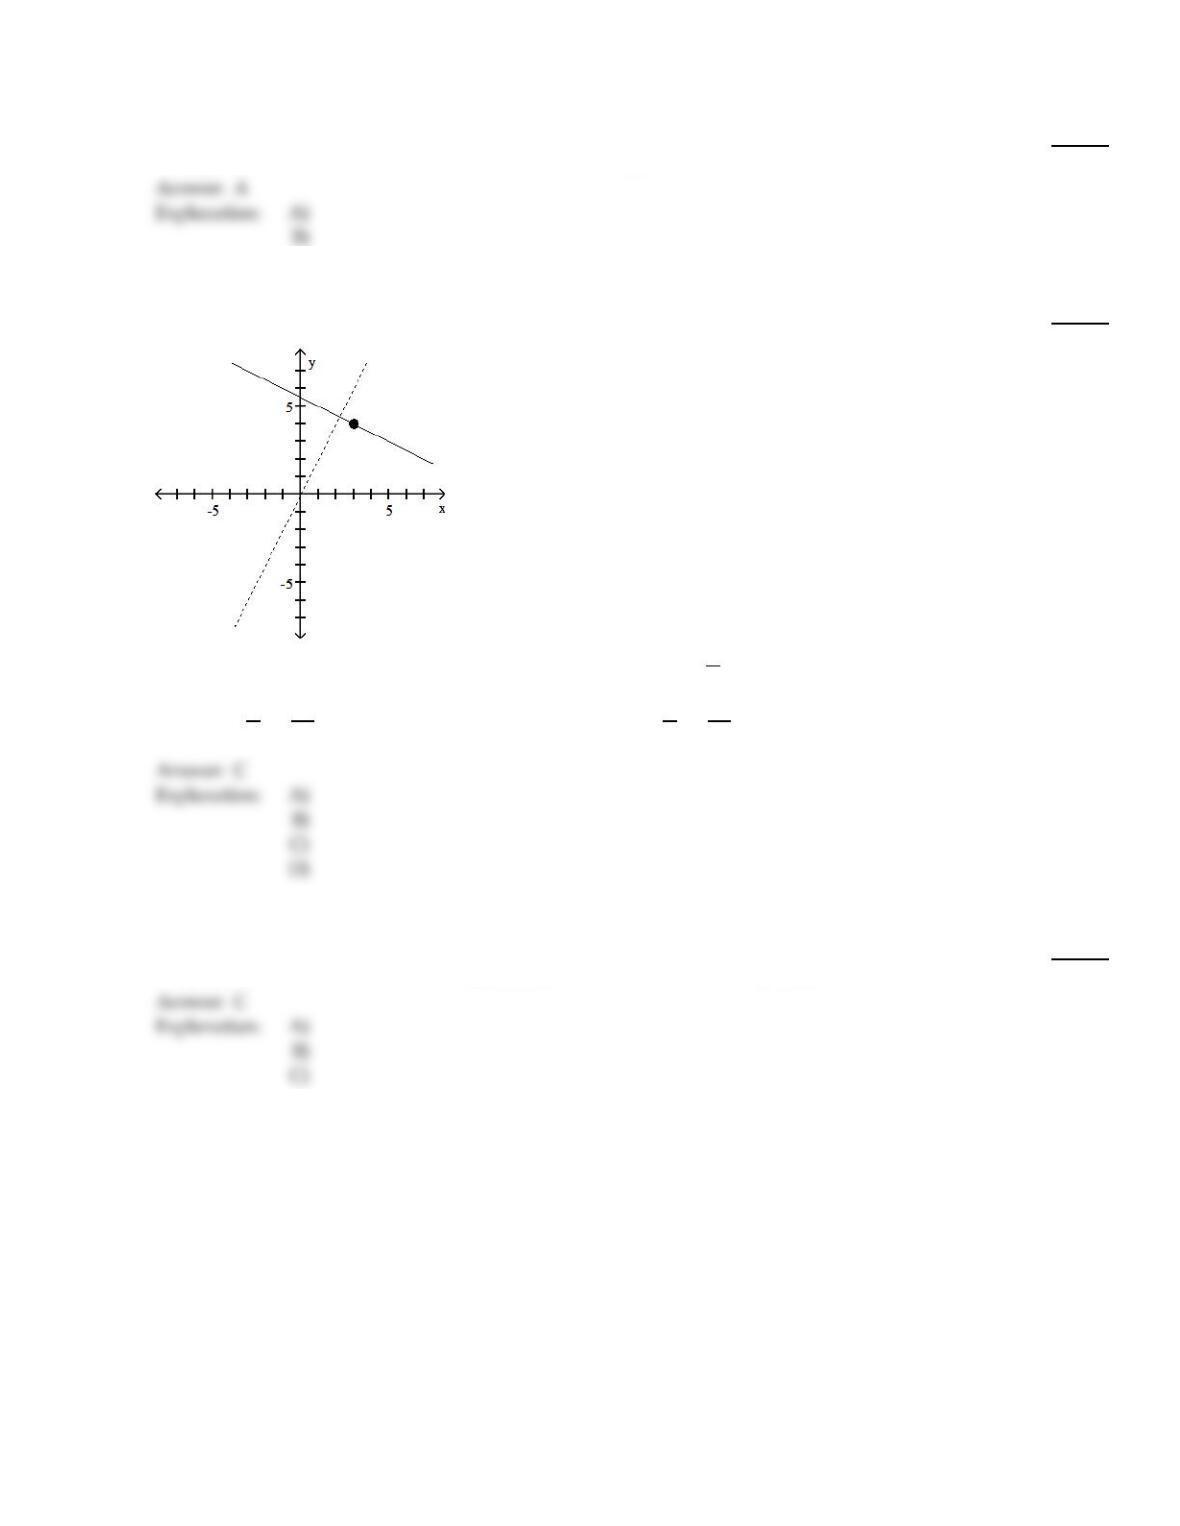
Find an equation for the line with the given properties.
120)
The solid line L contains the point (3, 4) and is perpendicular to the dotted line whose equation is
y =2x. Give the equation of line L in slope–intercept form.
120)
A)
y – 4 = 2(x – 3)
B)
y – 4 = – 1
2(x – 3)
C)
y = – 1
2x +11
2
D)
y =1
2x +11
2
Determine whether the given function is even, odd, or neither.
121)
f(x) = – 5x5+ x3
121)
A)
Even
B)
Neither
C)
Odd
Graph the linear function by plotting the x– and y–intercepts.
60