90. Figure 2-8.
Martin Company makes cell phones. The company controller wanted to calculate the fixed and variable costs
associated with electricity using in the factory. Data for the past four months were collected:
Month
Electricity cost
Machine hours
January
$ 7,560
570
February
8,220
625
March
7,480
546
April
7,186
518
Coefficients show by a regression program are:
Intercept
2,225
X Variable 1
9.75
See Figure 2-8: Using the results of regression, the cost formula for electricity cost was
91. Figure 2-8.
Martin Company makes cell phones. The company controller wanted to calculate the fixed and variable costs
associated with electricity using in the factory. Data for the past four months were collected:
Month
Electricity cost
Machine hours
January
$ 7,560
570
February
8,220
625
March
7,480
546
April
7,186
518
Coefficients show by a regression program are:
Intercept
2,225
X Variable 1
9.75
See Figure 2-8: Using the results of regression, what would be the total budgeted cost for electricity next month assuming that 640 machine hours
are budgeted.
92. Figure 2-9.
The following cost formula was developed using monthly data for a retail clothing store.
Total cost = $75,620 + ($242 ´ number of customers)
See Figure 2-9: The term $75,620
93. Figure 2-9.
The following cost formula was developed using monthly data for a retail clothing store.
Total cost = $75,620 + ($242 ´ number of customers)
See Figure 2-9: The term $242
94. Figure 2-9.
The following cost formula was developed using monthly data for a retail clothing store.
Total cost = $75,620 + ($242 ´ number of customers)
See Figure 2-9: The term “number of customers”
95. Figure 2-9.
The following cost formula was developed using monthly data for a retail clothing store.
Total cost = $75,620 + ($242 ´ number of customers)
See Figure 2-9: The term “total cost”
96. Figure 2-10.
The following cost formula was developed using the monthly data for an accounting firm.
Total cost = $87,100 + ($210 ´ number of tax returns)
See Figure 2-10: The term $87,100
97. Figure 2-10.
The following cost formula was developed using the monthly data for an accounting firm.
Total cost = $87,100 + ($210 ´ number of tax returns)
See Figure 2-10: The term “number of tax returns”
98. Figure 2-10.
The following cost formula was developed using the monthly data for an accounting firm.
Total cost = $87,100 + ($210 ´ number of tax returns)
See Figure 2-10: The term $210
99. Figure 2-10.
The following cost formula was developed using the monthly data for an accounting firm.
Total cost = $87,100 + ($210 ´ number of tax returns)
See Figure 2-10: The term “total cost”
100. Figure 2-11.
The following four months of data were collected on utility cost and the number of labor hours in a factory.
Month
Utility cost
Labor hours
January
$22,100
3,975
February
24,600
5,430
March
23,500
4,400
April
20,140
3,200
See Figure 2-11: Select the correct set of high and low months
High Low
101. Figure 2-11.
The following four months of data were collected on utility cost and the number of labor hours in a factory.
Month
Utility cost
Labor hours
January
$22,100
3,975
February
24,600
5,430
March
23,500
4,400
April
20,140
3,200
See Figure 2-11: Using the high-low method, compute the variable rate for the utility cost.
102. Figure 2-11.
The following four months of data were collected on utility cost and the number of labor hours in a factory.
Month
Utility cost
Labor hours
January
$22,100
3,975
February
24,600
5,430
March
23,500
4,400
April
20,140
3,200
See Figure 2-11: Using the high-low method, compute the fixed cost of electricity.
103. Figure 2-11.
The following four months of data were collected on utility cost and the number of labor hours in a factory.
Month
Utility cost
Labor hours
January
$22,100
3,975
February
24,600
5,430
March
23,500
4,400
April
20,140
3,200
See Figure 2-11: What would be the estimate of electricity cost if the factory incurred 4,700 labor hours next month?
104. The cost formula for monthly depreciation cost in a factory is:
Total cost = $10,000
This cost
105. Figure 2-12.
The method of least squares was used to develop a cost equation to predict the cost of monthly equipment
maintenance. The following computer output was received:
Intercept
32,000
Slope
25
The driver used was the number of machine hours.
See Figure 2-12: What was the cost formula for equipment maintenance?
106. Figure 2-12.
The method of least squares was used to develop a cost equation to predict the cost of monthly equipment
maintenance. The following computer output was received:
Intercept
32,000
Slope
25
The driver used was the number of machine hours.
See Figure 2-12: Using the cost formula for the equipment maintenance cost, what is the predicted cost of equipment maintenance for April
assuming that 5,000 machine hours will be incurred in April?
107. Figure 2-12.
The method of least squares was used to develop a cost equation to predict the cost of monthly equipment
maintenance. The following computer output was received:
Intercept
32,000
Slope
25
The driver used was the number of machine hours.
See Figure 2-12: What is the independent variable of the cost formula for equipment maintenance?
108. Figure 2-13.
The following six months of data were collected on electricity cost and the number of machine hours in a
factory.
Month
Electricity cost
Machine hours
June
$ 25,160
4,500
July
26,170
4,810
August
27,250
5,120
September
26,680
5,010
October
27,950
5,430
November
27,500
5,190
See Figure 2-13: Select the correct set of high and low months
High Low
109. Figure 2-13.
The following six months of data were collected on electricity cost and the number of machine hours in a
factory.
Month
Electricity cost
Machine hours
June
$ 25,160
4,500
July
26,170
4,810
August
27,250
5,120
September
26,680
5,010
October
27,950
5,430
November
27,500
5,190
See Figure 2-13: An independent-variable value used in calculating the cost line using the high-low method is:
110. Figure 2-13.
The following six months of data were collected on electricity cost and the number of machine hours in a
factory.
Month
Electricity cost
Machine hours
June
$ 25,160
4,500
July
26,170
4,810
August
27,250
5,120
September
26,680
5,010
October
27,950
5,430
November
27,500
5,190
See Figure 2-13: A dependent-variable value used in calculating the cost line using the high-low method is:
111. Figure 2-14.
Margolo Company makes cross-country skis. The company controller wants to calculate the fixed and variable
costs associated with janitorial services incurred by the factory. Data for the past six months were collected.
Month
Janitorial cost
Labor hours
January
$ 9,200
10,120
February
8,800
9,500
March
9,350
10,500
April
9,620
11,100
May
8,400
8,660
June
9,400
10,650
See Figure 2-14: Select the correct set of high and low months
High Low
112. Figure 2-14.
Margolo Company makes cross-country skis. The company controller wants to calculate the fixed and variable
costs associated with janitorial services incurred by the factory. Data for the past six months were collected.
Month
Janitorial cost
Labor hours
January
$ 9,200
10,120
February
8,800
9,500
March
9,350
10,500
April
9,620
11,100
May
8,400
8,660
June
9,400
10,650
See Figure 2-14: An independent-variable value used in calculating the cost line using the high-low method is:
113. Figure 2-14.
Margolo Company makes cross-country skis. The company controller wants to calculate the fixed and variable
costs associated with janitorial services incurred by the factory. Data for the past six months were collected.
Month
Janitorial cost
Labor hours
January
$ 9,200
10,120
February
8,800
9,500
March
9,350
10,500
April
9,620
11,100
May
8,400
8,660
June
9,400
10,650
See Figure 2-14: A dependent-variable value used in calculating the cost line using the high-low method is:
114. Figure 2-15.
Blacken Company manufactures motorcycles. The company’s management accountant wants to calculate the
fixed and variable costs associated with utility cost incurred by the factory. Data for the past five months were
collected.
Month
Utility cost
Machine hours
March
$30,255
2,200
April
32,750
2,525
May
34,712
2,710
June
31,850
2,410
July
30,720
2,290
See Figure 2-15: Using a linear regression program, the value of the intercept (rounded to the nearest penny) is
115. Figure 2-15.
Blacken Company manufactures motorcycles. The company’s management accountant wants to calculate the
fixed and variable costs associated with utility cost incurred by the factory. Data for the past five months were
collected.
Month
Utility cost
Machine hours
March
$30,255
2,200
April
32,750
2,525
May
34,712
2,710
June
31,850
2,410
July
30,720
2,290
See Figure 2-15: Using a linear regression program, the value of the X Variable 1 (rounded to the nearest penny) is
116. Figure 2-15.
Blacken Company manufactures motorcycles. The company’s management accountant wants to calculate the
fixed and variable costs associated with utility cost incurred by the factory. Data for the past five months were
collected.
Month
Utility cost
Machine hours
March
$30,255
2,200
April
32,750
2,525
May
34,712
2,710
June
31,850
2,410
July
30,720
2,290
See Figure 2-15: Using a linear regression program, the forecasted utility cost at 2,000 machine hours (rounded to the nearest dollar) is
117. Figure 2-15.
Blacken Company manufactures motorcycles. The company’s management accountant wants to calculate the
fixed and variable costs associated with utility cost incurred by the factory. Data for the past five months were
collected.
Month
Utility cost
Machine hours
March
$30,255
2,200
April
32,750
2,525
May
34,712
2,710
June
31,850
2,410
July
30,720
2,290
See Figure 2-15: Using a linear regression program, the forecasted utility cost at 3,000 machine hours (rounded to the nearest dollar) is
118. Figure 2-15.
Blacken Company manufactures motorcycles. The company’s management accountant wants to calculate the
fixed and variable costs associated with utility cost incurred by the factory. Data for the past five months were
collected.
Month
Utility cost
Machine hours
March
$30,255
2,200
April
32,750
2,525
May
34,712
2,710
June
31,850
2,410
July
30,720
2,290
See Figure 2-15: Using a linear regression program, the forecasted utility cost at 4,000 machine hours (rounded to the nearest dollar) is
119. Figure 2-15.
Blacken Company manufactures motorcycles. The company’s management accountant wants to calculate the
fixed and variable costs associated with utility cost incurred by the factory. Data for the past five months were
collected.
Month
Utility cost
Machine hours
March
$30,255
2,200
April
32,750
2,525
May
34,712
2,710
June
31,850
2,410
July
30,720
2,290
See Figure 2-15: Using a linear regression program, the yearly utility cost equation (with all variables to the nearest penny) is
120. Select the appropriate type of cost for each of the definitions below.
4. will increase in total in direct proportion to an increase in the
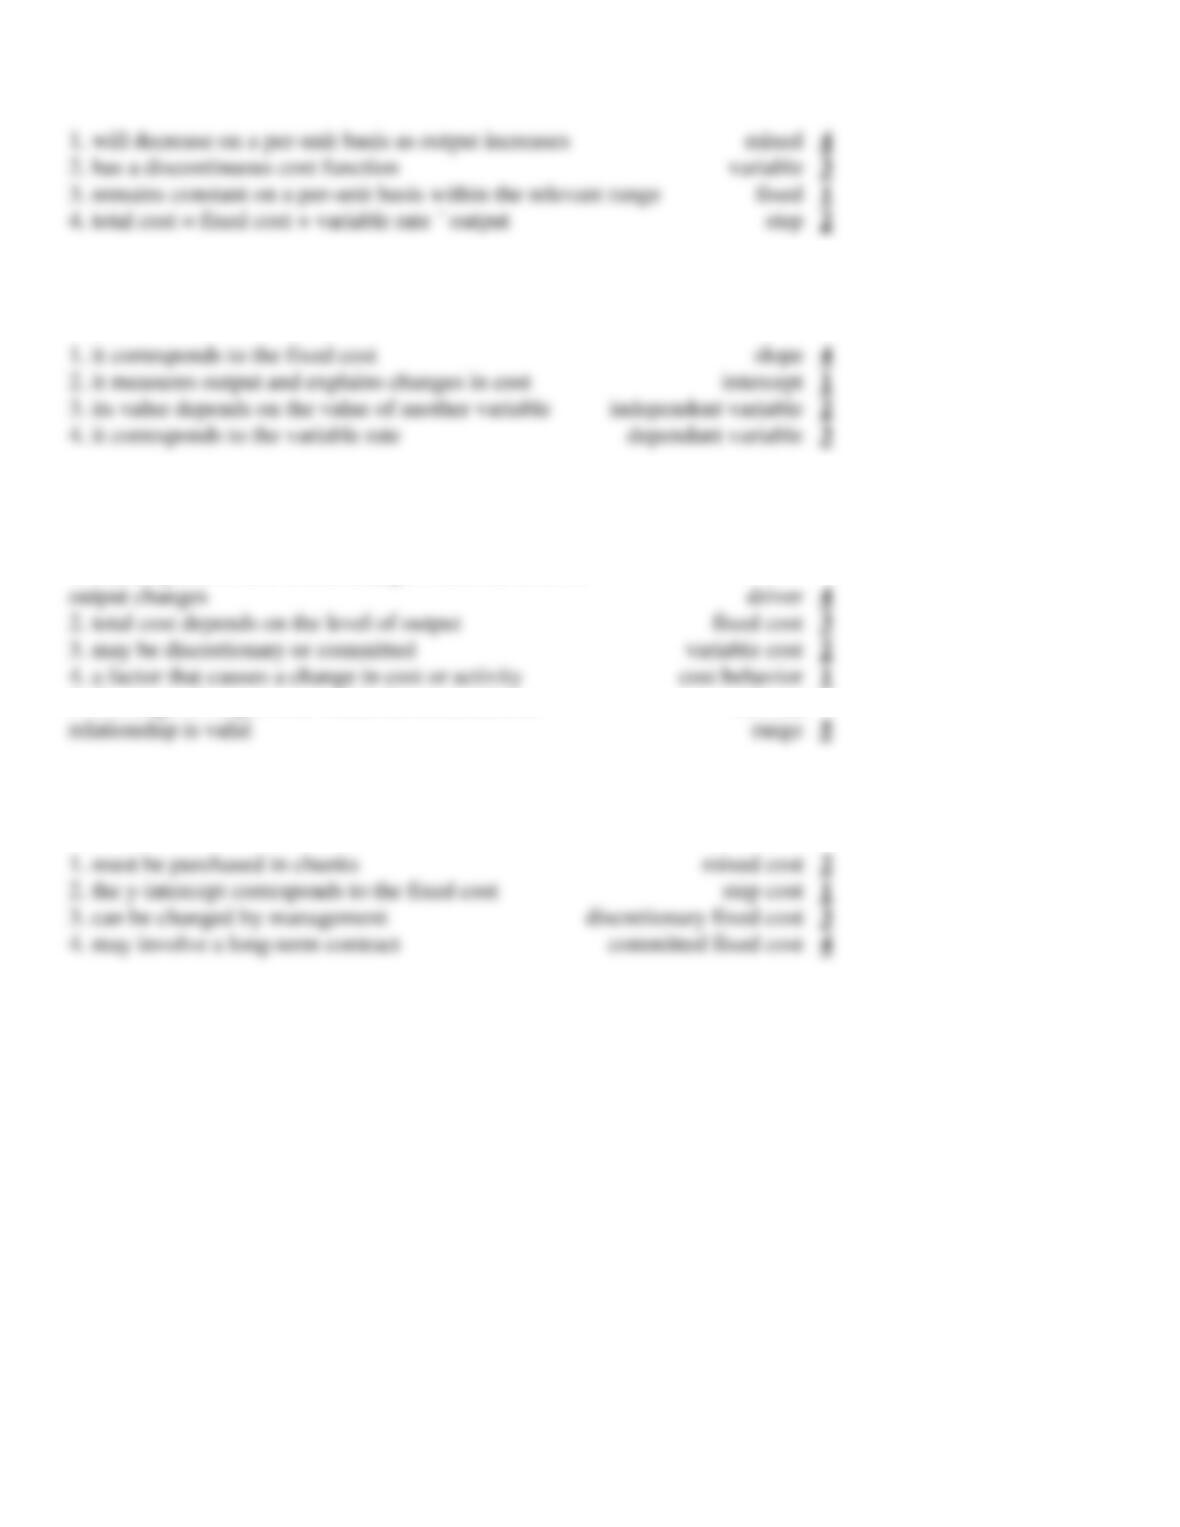
121. Select the appropriate type of cost for each of the definitions listed below.
122. Select the appropriate item for each of the definitions listed below.
123. Select the appropriate item for each of the definitions listed below.
1. a description of how a cost changes when the level of
5. the range of output over which the assumed cost
relevant
124. Select the appropriate item for each of the definitions listed below.
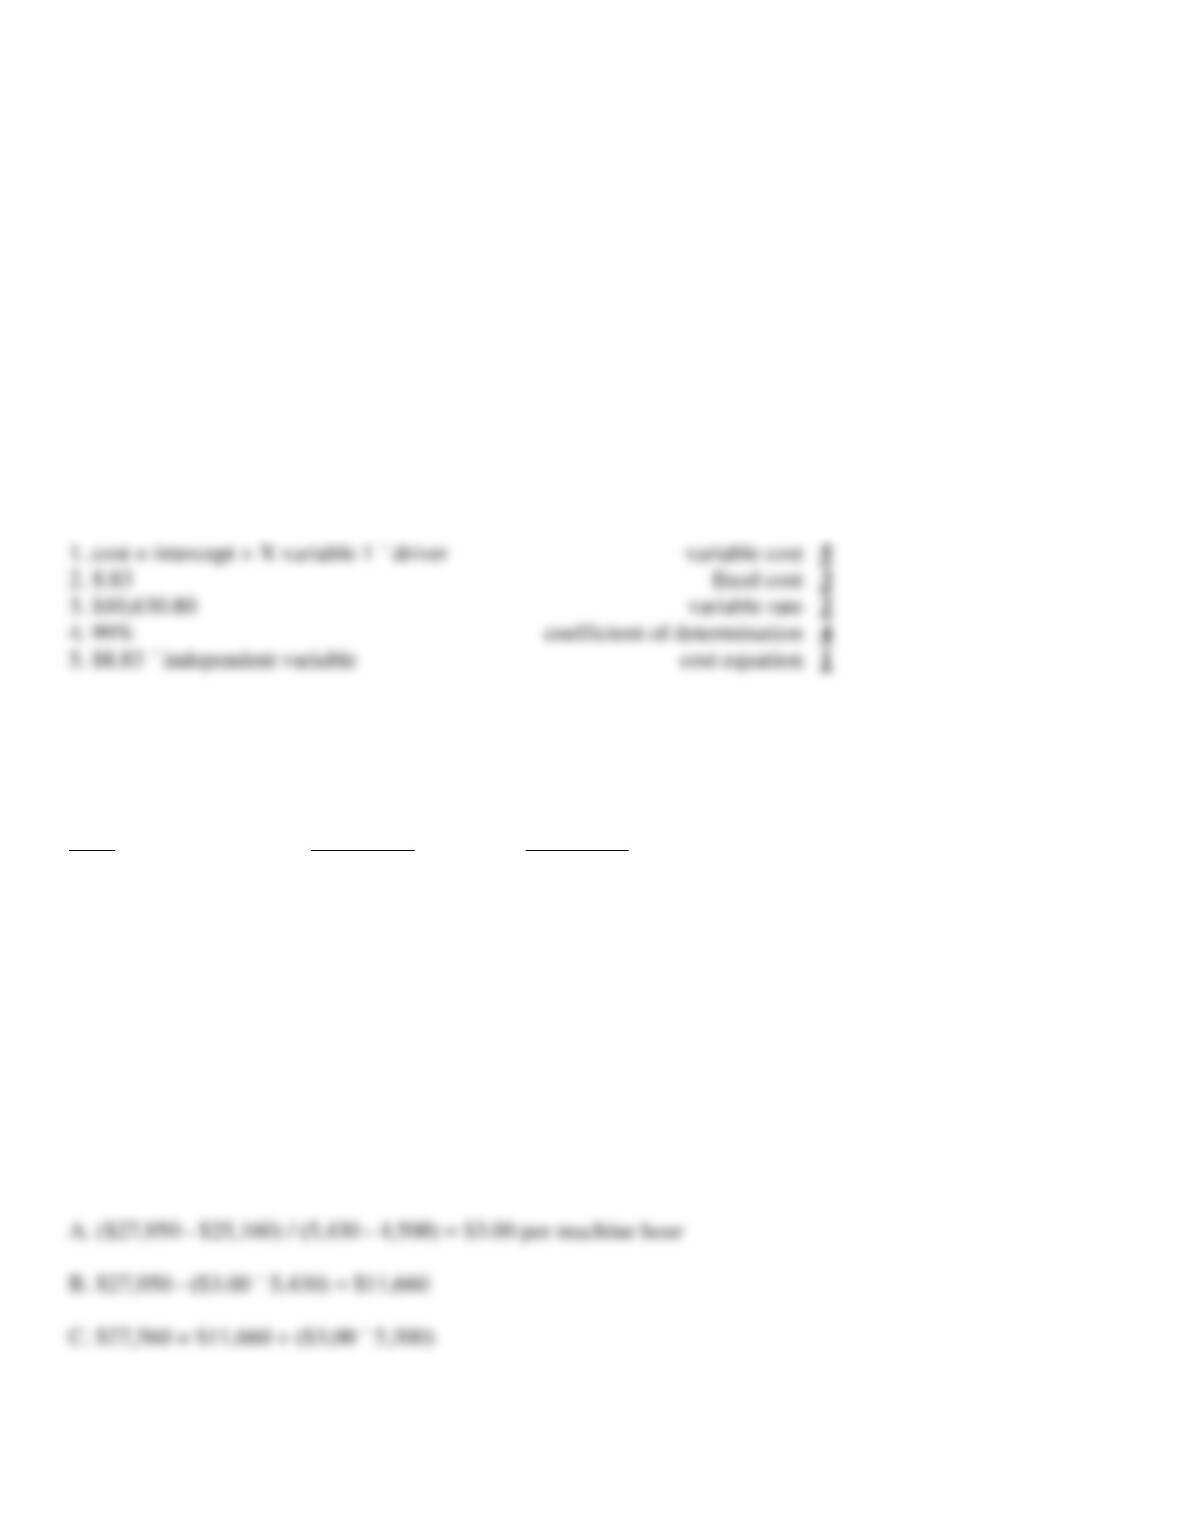
125. Select the best description for the following:
SUMMARY OUTPUT
Regression Statistics
Multiple R
1
R Square
0.99
Adjusted R Square
0.99
Standard Error
195.35
Observations
5
ANOVA
df
SS
MS
F
Significance F
Regression
1
12492415.96
12492415.96
327.37
0
Residual
3
114479.24
38159.75
Total
4
12606895.2
Lower
Upper
Lower
Upper
Coefficients
Standard Error
t Stat
P-value
95%
95%
95%
95.%
Intercept
10630.8
1187.44
8.95
0
6851.83
14409.76
6851.83
14409.76
X Variable 1
8.83
0.49
18.09
0
7.28
10.38
7.28
10.38
126. The following six months of data were collected on electricity cost and the number of machine hours in a
factory.
Month
Electricity cost
Machine hours
June
$ 25,160
4,500
July
26,170
4,810
August
27,250
5,120
September
26,680
5,010
October
27,950
5,430
November
27,500
5,190
Required:
A. Using the high-low method compute the variable rate for the electricity cost
B. Using the high-low method compute the fixed cost of electricity
C. Estimate the total electricity cost to be incurred in December if 5,300 machine hours are incurred.
127. Margolo Company makes cross-country skis. The company controller wants to calculate the fixed and
variable costs associated with janitorial services incurred by the factory. Data for the past six months were
collected.
Month
Janitorial cost
Labor hours
January
$ 9,200
10,120
February
8,800
9,500
March
9,350
10,500
April
9,620
11,100
May
8,400
8,660
June
9,400
10,650
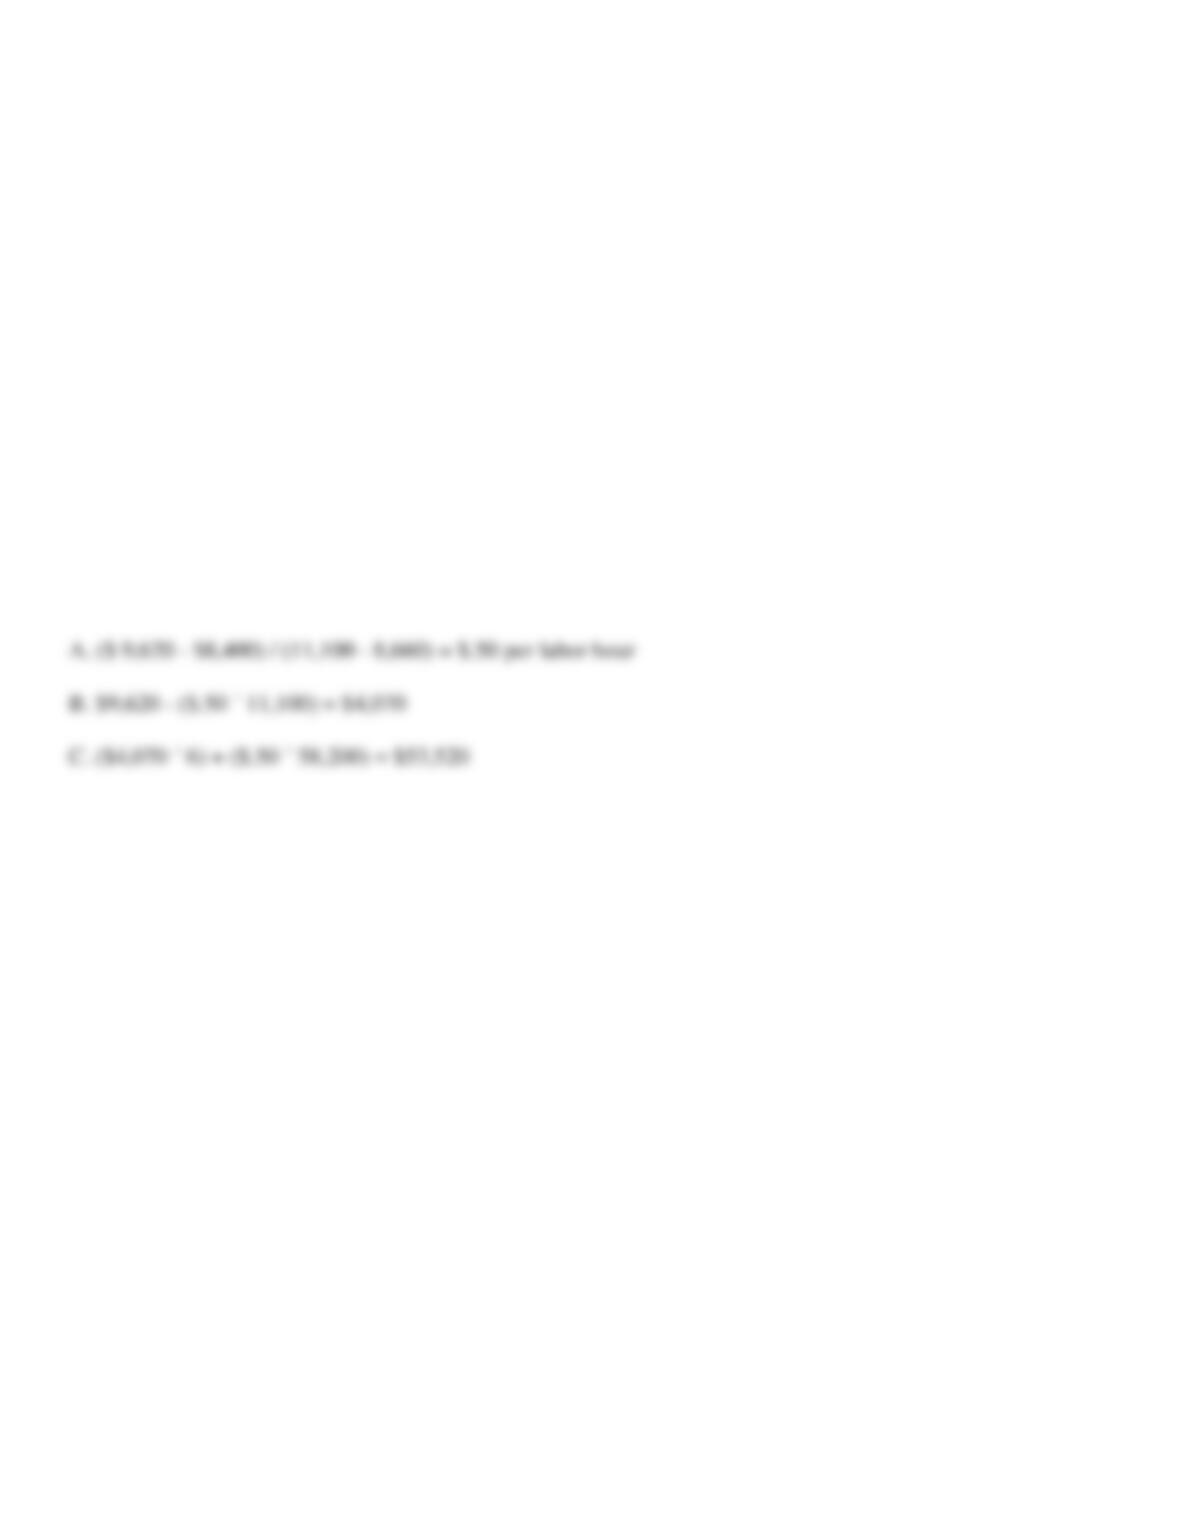
Required:
A.
Using the high-low method compute the variable rate of the janitorial cost
B.
Using the high-low method compute the fixed cost of janitorial services
C.
Compute the estimated janitorial cost to be incurred during the next six months assuming that 58,200 labor hours will be worked.