
2-18 Chapter 2 Displaying and Describing Categorical Data
Grocery stores serving less wealthy neighborhoods:
Months
Profit
Months Loss Total % months profit
Grocery A 2 2 4 50.0%
Grocery B 1 1 2 50.0%
What can be assumed about the profit of grocery stores?
A. Grocery Store B has more consistent profit overall.
B. It is clear that less wealthy neighborhoods will not yield these grocery store profits.
C. It is unclear how to predict the profit of these grocery stores based on the wealth of
neighborhoods.
D. Grocery Store A showed less profit overall but showed greater profit in wealthier
neighborhoods.
E. There is no difference in profit overall with grocery stores in either wealthier versus less
wealthy neighborhoods.
Quiz C 2-19
Chapter 2: Displaying and Describing Categorical Data – Quiz C – Key

2-20 Chapter 2 Displaying and Describing Categorical Data
Chapter 2: Displaying and Describing Categorical Data– Quiz D – Multiple Choice
Name_____________________________________
2.1.3 Create and use frequency and relative frequency distributions and their displays.
1. A restaurant uses comment cards to get feedback from its customers about newly
added items to the menu. It recently introduced homemade organic veggie burgers.
Customers who tried the new burger were asked if they would order it again. The data
are summarized in the table below. What percentage of customers would definitely order
the veggie burger again?
A. 10%
B. 15%
C. 20%
D. 40%
E. 77%
2.1.3 Create and use frequency and relative frequency distributions and their displays.
2. A restaurant uses comment cards to get feedback from its customers about newly
added items to the menu. It recently introduced homemade organic veggie burgers.
Customers who tried the new burger were asked if they would order it again. The data
are summarized in the table below. What percentage of customers would most likely or
definitely order the veggie burger again?
Response Frequency
Definitely would. 10
Most likely would. 40
Maybe 12
Definitely would not. 3
A. 10%
B. 15%
C. 40%
D. 50%
E. 77%
Response Frequency
Definitely would. 10
Most likely would. 40
Maybe 12
Definitely would not. 3
Quiz D 2-21
2.2.1 Determine if displays of data are appropriate.
3. A restaurant uses comment cards to get feedback from its customers about newly
added items to the menu. It recently introduced homemade organic veggie burgers.
Customers who tried the new burger were asked if they would order it again. Which of
the following would be an appropriate method for displaying the data shown in the table?
Response Frequency
Definitely would. 10
Most likely would. 40
Maybe 12
Definitely would not. 3
A. Contingency table.
B. Segmented bar chart.
C. Pie chart.
D. Both A and B.
E. Both B and C.
2.2.1 Determine if displays of data are appropriate.
4. In May, 2010, the Pew Research Center for the People & the Press carried out a
national survey to gauge opinion on the Arizona Immigration Law. Responses (Favor,
Oppose, Don’t Know) were examined according to groups defined by political party
affiliation (Democrat, Republican, Independent). Which of the following would be
appropriate for displaying these data?
A. Contingency table.
B. Pie charts.
C. Segmented bar chart.
D. Side by side bar chart.
E. All of the above.
2.1.3 Examine and use contingency tables.
5. A regional survey was carried out to gauge public opinion on the controversial
Arizona Immigration Law (results shown below). How many respondents are
Republican and favor the law?
Response Democrat Republican Independent
Favor 50 93 35
Oppose 85 45 60
Don’t Know 5 7 20
A. 93
B. 45
C. 145
D. 7
E. 85
2-22 Chapter 2 Displaying and Describing Categorical Data
2.2.3 Create and use frequency and relative frequency distributions and their displays.
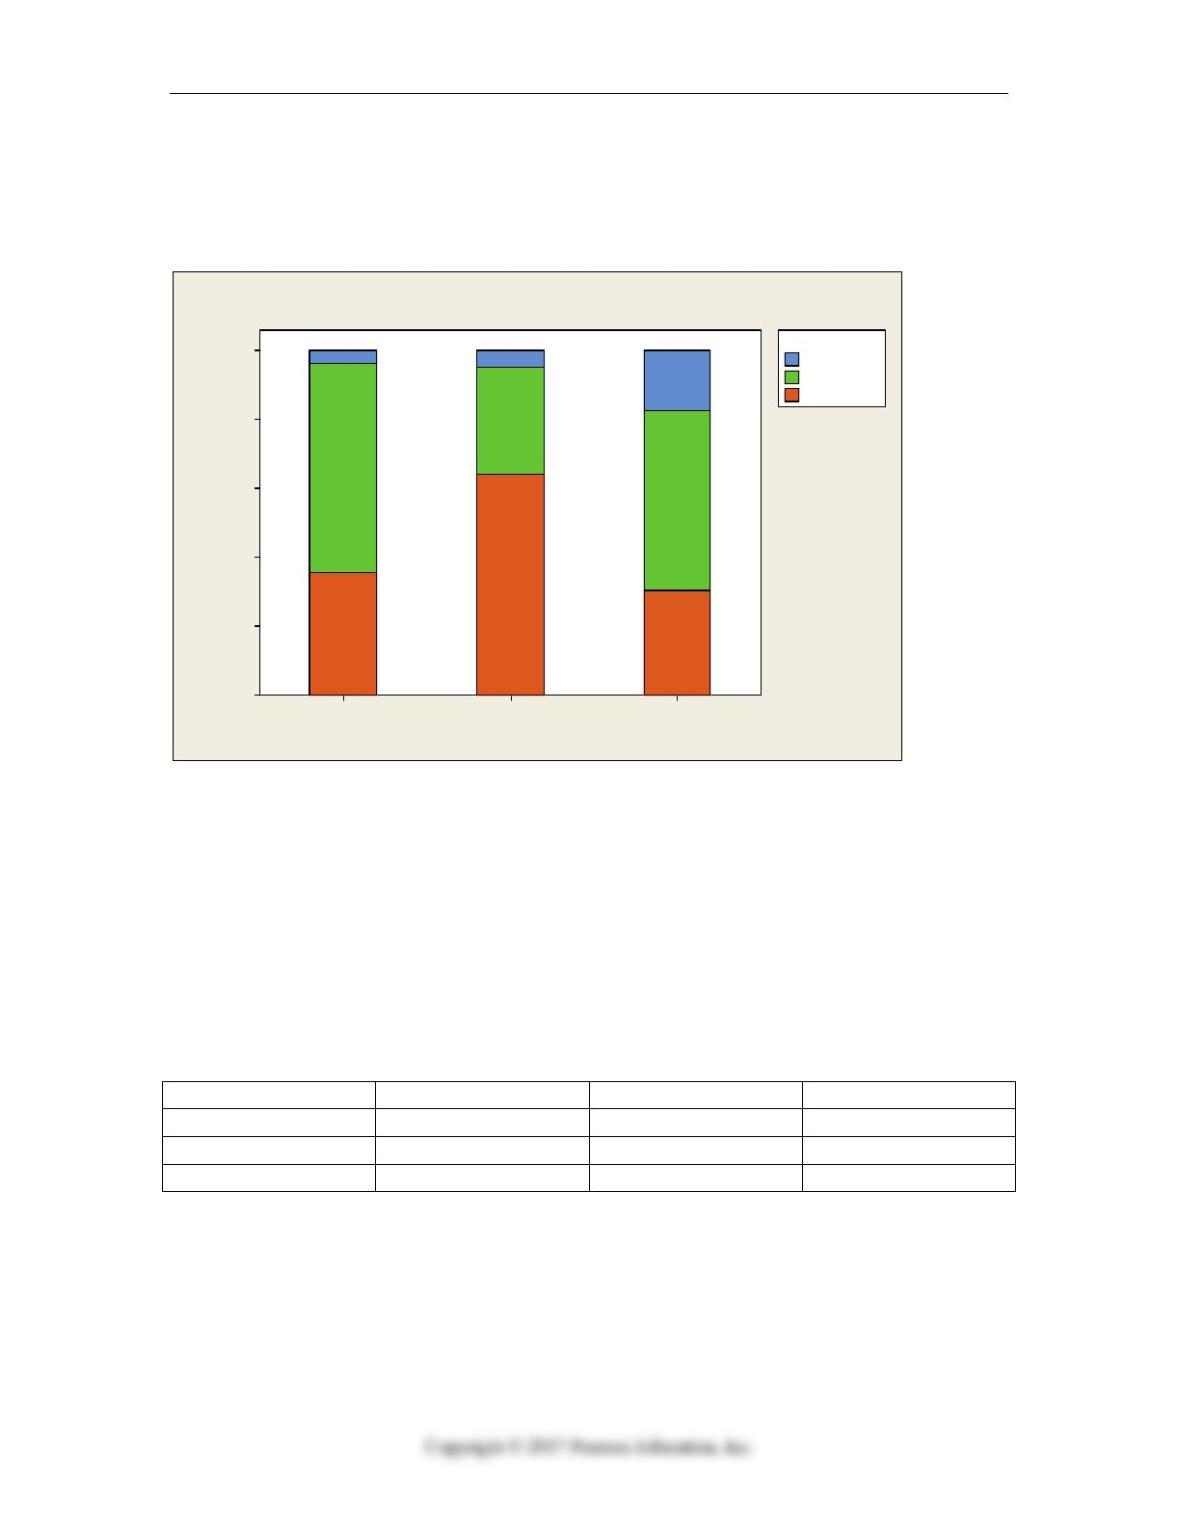
6. A regional survey was carried out to gauge public opinion on the controversial
Arizona Immigration Law. The results are displayed in the segmented bar chart below.
Which of the following statements is true?
IndependentRepublicanDemocrat
100
80
60
40
20
0
Data
Don‘t Know
Oppose
Favor
Response
Opinion of Arizona Immigration Law by Political Party
Percent within variables.
A. A greater percentage of Republicans oppose the law compared to Democrats.
B. A greater percentage of Republicans oppose the law compared to Independents.
C. Opinion about the law appears to be independent of political party affiliation.
D. A greater percentage of Democrats oppose the law compared to Republicans.
E. The segmented bar chart is not appropriate for these data.
2.1.4 Find conditional and marginal distributions and make comparisons.
7. A regional survey was carried out to gauge public opinion on the controversial
Arizona Immigration Law. Based on the results displayed in the table below, what
percent of respondents is Independent?
Response Democrat Republican Independent
Favor 50 93 35
Oppose 85 45 60
Don’t Know 5 7 20
A. 35%
B. 9%
C. 29%
D. 45%
E. 25%
Quiz D 2-23
2.1.4 Find conditional and marginal distributions and make comparisons.
8. A regional survey was carried out to gauge public opinion on the controversial
Arizona Immigration Law (results shown below). What percent oppose the law?
Response Democrat Republican Independent
Favor 50 93 35
Oppose 85 45 60
Don’t Know 5 7 20
A. 48%
B. 45%
C. 32%
D. 25%
E. 61%
2.1.4 Find conditional and marginal distributions and make comparisons.
9. A regional survey was carried out to gauge public opinion on the controversial
Arizona Immigration Law (results shown below). Of respondents who are Democrat,
what percent oppose the law?
Response Democrat Republican Independent
Favor 50 93 35
Oppose 85 45 60
Don’t Know 5 7 20
A. 13%
B. 35%
C. 22%
D. 45%
E. 61%
2.1.4 Find conditional and marginal distributions and make comparisons.
10. A regional survey was carried out to gauge public opinion on the controversial
Arizona Immigration Law (results shown below). Of respondents who oppose the law,
what percent is Democrat?
Response Democrat Republican Independent
Favor 50 93 35
Oppose 85 45 60
Don’t Know 5 7 20
A. 13%
B. 35%
C. 22%
D. 45%
E. 6
2-24 Chapter 2 Displaying and Describing Categorical Data
Chapter 2: Displaying and Describing Categorical Data – Quiz D – Key

Quiz E 2-25
Chapter 2: Displaying and Describing Categorical Data– Quiz E – Multiple Choice
Name_____________________________________
2.1.3 Create and use frequency and relative frequency distributions and their displays.
1. A clothing store uses comment cards to get feedback from its customers about newly
added items. It recently introduced plus size fashion wear. Customers who purchased
the items were asked to fill out an online comment survey giving 10% off the next
purchase. The data are summarized in the table below. What percentage of customers
were at least satisfied with the item(s) purchased (Satisfied or Very satisfied)?
A. 49.2%
B. 73.8%
C. 24.6%
D. 26.2%
E. 68.9%
2.1.3 Create and use frequency and relative frequency distributions and their displays.
2. A clothing store uses comment cards to get feedback from its customers about newly
added items. It recently introduced plus size fashion wear. Customers who purchased
the items were asked to fill out an online comment survey giving 10% off the next
purchase. The data are summarized in the table below. What percentage of customers
would be less likely to purchase another item (Less or Not fully satisfied)?
Response Frequency
Very satisfied. 15
Satisfied. 30
Less than fully satisfied. 12
Not satisfied. 4
A. 10%
B. 15%
C. 40%
D. 50%
E. 77%
Response Frequency
Very satisfied. 15
Satisfied. 30
Less than fully satisfied. 12
Not satisfied. 4
2-26 Chapter 2 Displaying and Describing Categorical Data
2.2.1 Determine if displays of data are appropriate.
3. A clothing store uses comment cards to get feedback from its customers about newly
added items. It recently introduced plus size fashion wear. Customers who purchased
the items were asked to fill out an online comment survey giving 10% off the next
purchase. The data are summarized in the table below. Which of the following would be
an appropriate method for displaying the data shown in the table?
Response Frequency
Very satisfied. 15
Satisfied. 30
Less than fully satisfied. 12
Not satisfied. 4
A. Contingency table.
B. Segmented bar chart.
C. Pie chart.
D. Both A and B.
E. Both B and C.
2.2.1 Determine if displays of data are appropriate.
4. Accenture, a consulting firm, conducted an online survey of 500 US consumers in
September 2013. Based on their response to the question “What is your motive for
shopping late in the season?” which of the following would be an appropriate method for
displaying the data shown in the table?
A. Contingency table.
B. Pie charts.
C. Segmented bar chart.
D. Side by side bar chart.
E. All of the above.
Response Male Female
Too busy to shop earlier 115 75
More time to save for gifts 50 80
Better discounts available 65 20
Part of the holiday tradition 15 5
None of the above 120 60
Quiz E 2-27
2.3. Examine a contingency table.
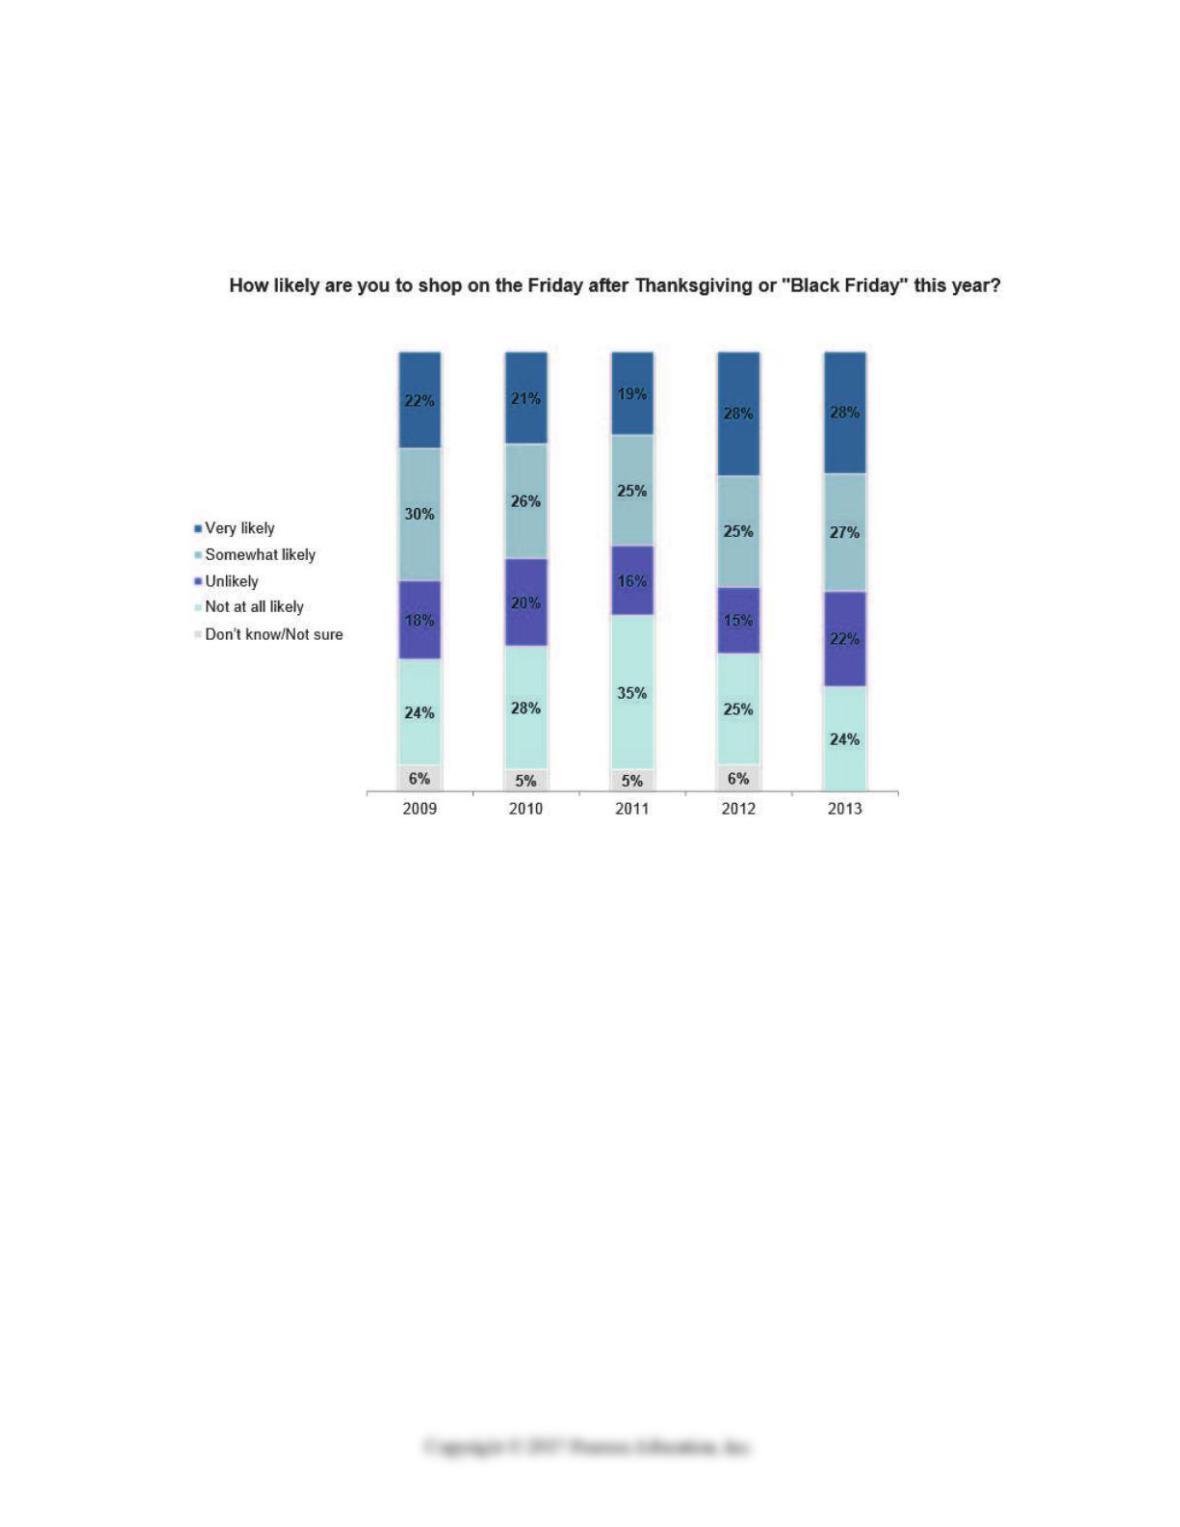
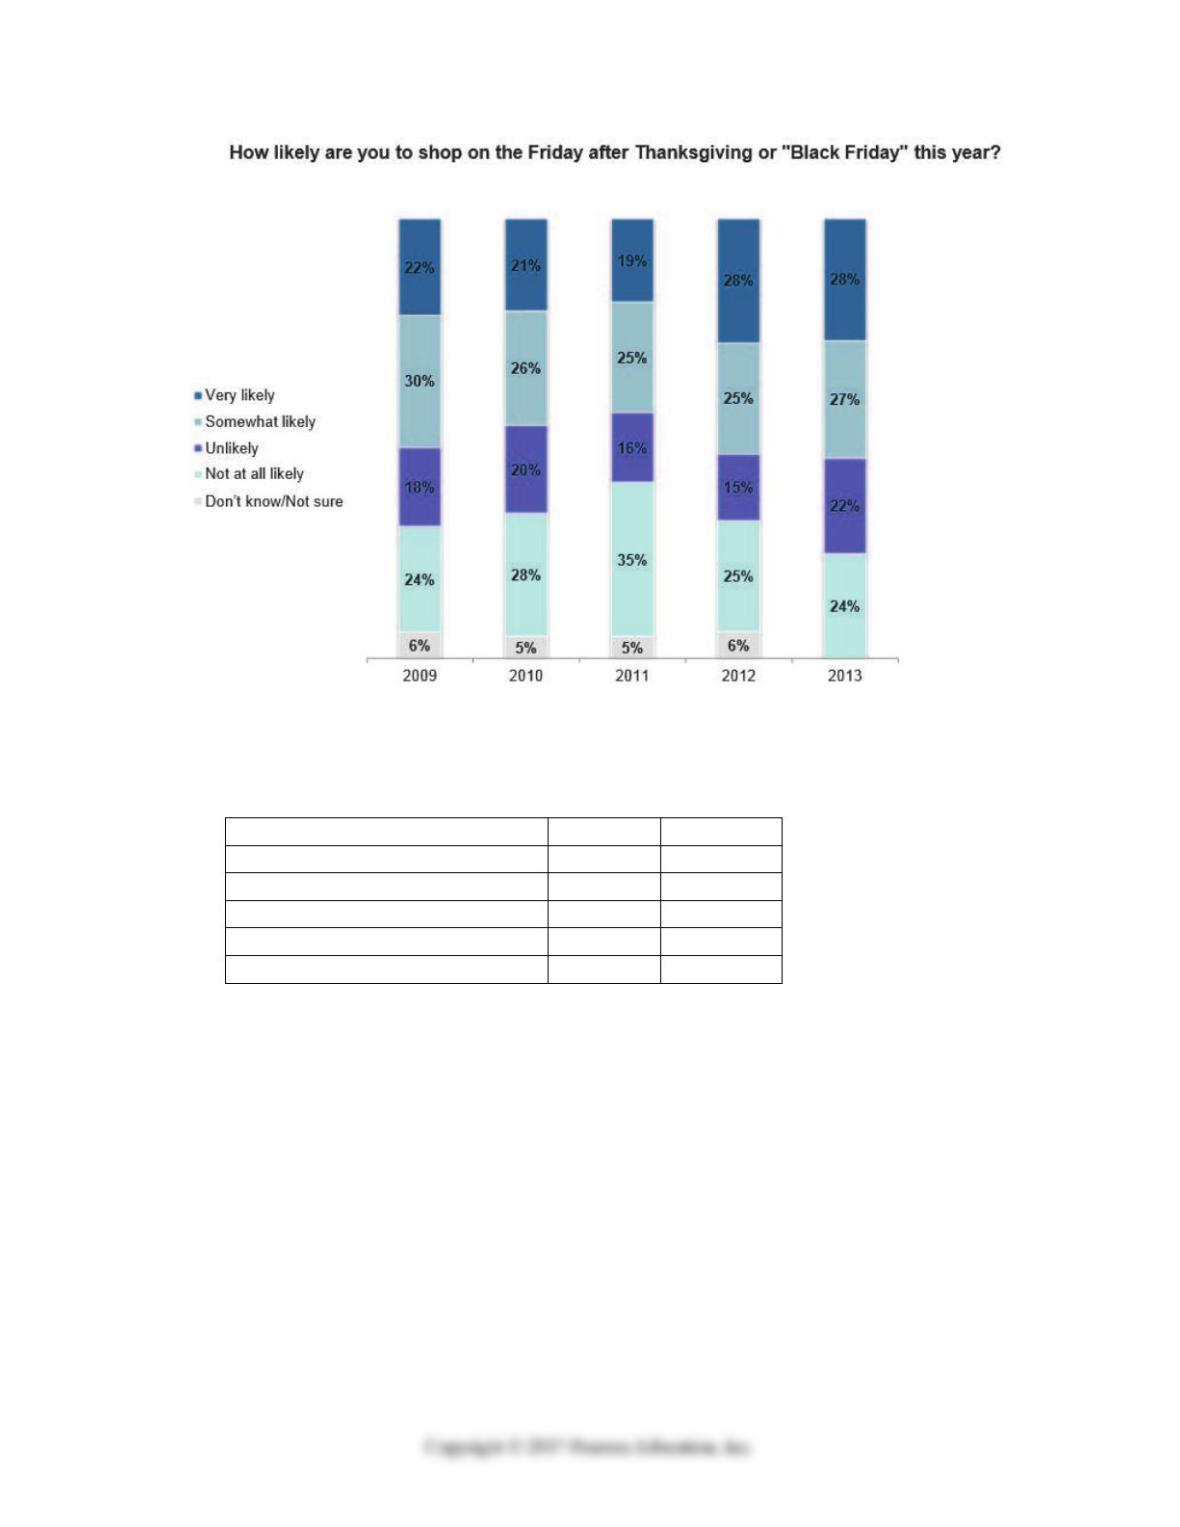
5. Accenture, a consulting firm, conducted an online survey of 500 US consumers from
2009 to 2013. The results are displayed in the segmented bar chart below. How many
respondents in 2012 are at least somewhat likely to shop on “Black Friday”?
A. 265
B. 275
C. 140
D. 230
E. 95
2.2. Determine if a display of data is appropriate.
6. Accenture, a consulting firm, conducted an online survey of 500 US consumers from
2009 to 2013. The results are displayed in the segmented bar chart below. Which of the
following statement(s) is (are) true?
A. A smaller percentage of shoppers over the past 5 years are undecided about shopping
on “Black Friday”.
B. In 2013, there was an increase in Very likely to shop on “Black Friday” over 2012.
C. From 2011 to 2013, there was a decrease in Not at all likely to shop on “Black
Friday”.
D. A greater percentage of shoppers over the past 5 years are at least somewhat likely to
shop on “Black Friday”.
E. The segmented bar chart is not appropriate for these data.
2-28 Chapter 2 Displaying and Describing Categorical Data
2.1.4 Find conditional and marginal distributions and make comparisons.
7. Accenture, a consulting firm, conducted an online survey of 500 US consumers from
in 2013.
What percentage of men were felt that better discounts were available on “Black Friday”?
A. 26.5%
B. 65%
C. 20%
D. 17.8%
E. 5.5%
Response Male Female
Too busy to shop earlier 115 75
More time to save for gifts 50 80
Better discounts available 65 20
Part of the holiday tradition 15 5
None of the above 120 60
Quiz E 2-29
2.1.4 Find conditional and marginal distributions and make comparisons.
8. Accenture, a consulting firm, conducted an online survey of 500 US consumers from
in 2013.
What percentage of those who thought that better discounts were available on “Black
Friday” were female?
A. 81.3%
B. 33.3%
C. 11.1%
D. 47.2%
E. 23.5%
2.1.4 Find conditional and marginal distributions and make comparisons.
9. Accenture, a consulting firm, conducted an online survey of 500 US consumers in
September 2013. Based on their response to the question “What is your motive for
shopping late in the season?” which of the following would be appropriate method(s) for
displaying the male only data shown in the table?
A. Contingency table.
B. Pie chart.
C. Segmented bar chart.
D. Side by side bar chart.
E. All of the above.
Response Male Female
Too busy to shop earlier 115 75
More time to save for gifts 50 80
Better discounts available 65 20
Part of the holiday tradition 15 5
None of the above 120 60
Response Male Female
Too busy to shop earlier 115 75
More time to save for gifts 50 80
Better discounts available 65 20
Part of the holiday tradition 15 5
None of the above 120 60
2-30 Chapter 2 Displaying and Describing Categorical Data
2.1.4 Find conditional and marginal distributions and make comparisons.
10. Accenture, a consulting firm, conducted an online survey of 500 US consumers in
September, 2013.
What percentage of consumers thought that shopping on “Black Friday” is part of the
holiday tradition?
A. 8.3%
B. 33.3%
C. 11.1%
D. 12.5%
E. 75.0%
Response Male Female
Too busy to shop earlier 115 75
More time to save for gifts 50 80
Better discounts available 65 20
Part of the holiday tradition 15 5
None of the above 120 60
Quiz E 2-31
Chapter 2: Displaying and Describing Categorical Data – Quiz E – Key