49) The opportunity cost of taking a semester-long economics class is
A) the cost of tuition and fees only.
B) the value of the time spent in the classroom.
C) zero because there is no admission charged if you are enrolled in the course.
D) equal to the highest value of an alternative use of the time and money spent on the class.
E) the knowledge and enjoyment you receive from attending the class.
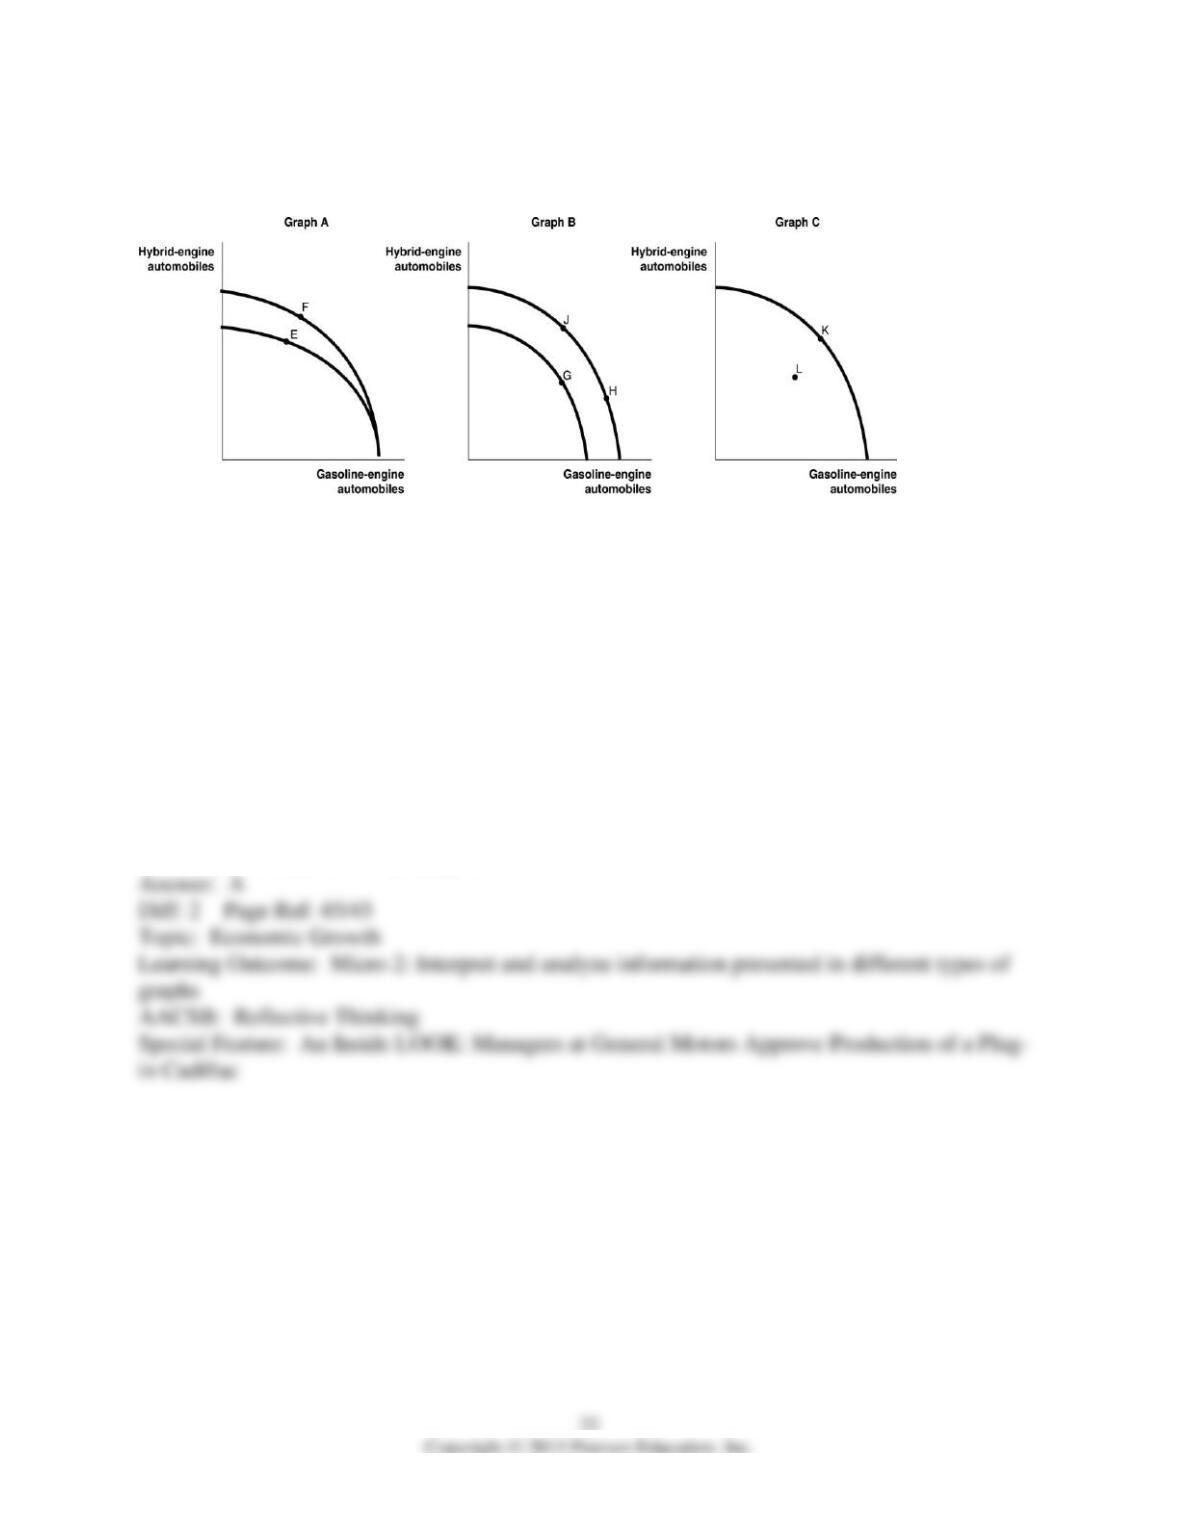
Figure 2-6
General Motors recently approved for production the Cadillac Converj, an electric car based on
its Chevy Volt. The Converj will feature a “Generation 1.5 Voltec” powertrain, with a hybrid
engine that runs on a combination of electricity and gasoline. Assume GM chooses to produce
both hybrid-engine vehicles and gasoline-engine vehicles for its Cadillac brand. Figure 2-6
shows changes to its production possibilities frontier in response to new developments and
different strategic production decisions.
50) Refer to Figure 2-6. Assume a technological advancement greatly reduces the cost to
produce hybrid-engine vehicles. This is best represented by the
A) movement from E to F in Graph A.
B) movement from G to H in Graph B.
C) movement from K to L in Graph C.
D) movement from H to J in Graph B.
51) Refer to Figure 2-6. In response to changing consumer demands, GM has cut back on the
production of hybrids and increased its production of gasoline-powered vehicles. This strategy is
best represented by the
A) movement from F to E in Graph A.
B) movement from G to J in Graph B.
C) movement from L to K in Graph C.
D) movement from J to H in Graph B.
52) Refer to Figure 2-6. Assume that in 2011, GM was able to reopen one of its factories after
an extensive remodelling which now allows for the production of both types of vehicles. This is
best represented by the
A) movement from E to F in Graph A.
B) movement from H to J in Graph B.
C) movement from L to K in Graph C.
D) movement from J to G in Graph B.
53) The U.S. government provides health care to about 30 percent of the population through
programs such as Medicare and Medicaid. The Congressional Budget Office estimates that as the
U.S. population ages and medical costs continue to rise, federal government spending on
Medicare will
A) cause the federal government to go bankrupt within the next 5 years.
B) leave no funds for Medicaid, which will virtually eliminate this program.
C) more than double over the next 10 years.
D) start to decrease, since Medicare will be funded by social security contributions beginning in
2012.
54) A decrease in the unemployment rate may be represented as a movement from a point on the
production possibilities frontier to a point outside the frontier.
55) If a country is producing efficiently and is on the production possibilities frontier, the only
way to produce more of one good is to produce less of the other.
56) Consider a country that produces only two goods: kayaks and coconuts. Suppose it is
possible for this country to increase its production of kayaks without producing fewer coconuts.
In this case, its current output combination is efficient.
57) Any output combination outside a production possibility frontier is associated with unused or
underutilized resources.
58) An increase in the labor force shifts the production possibility frontier inwards over time.
59) If additional units of a good could be produced at a constant opportunity cost, the production
possibility frontier would be bowed outward (concave).
60) On a diagram of a production possibility frontier, opportunity cost is represented by the
production possibility frontier shifting outward.
61) To increase gas mileage, automobile manufacturers make cars small and light. Large cars
absorb more of the impact of an accident than small cars but yield lower gas mileage. These facts
suggest that a negative relationship exists between safety and gas mileage.
62) What is a production possibilities frontier? What do points along the frontier represent? What
do points inside and outside the frontier represent?
63) What shape does a production possibilities frontier take if it displays increasing opportunity
costs? What shape does a production possibilities frontier take if it displays constant opportunity
costs? Which shape is most common in production situations?
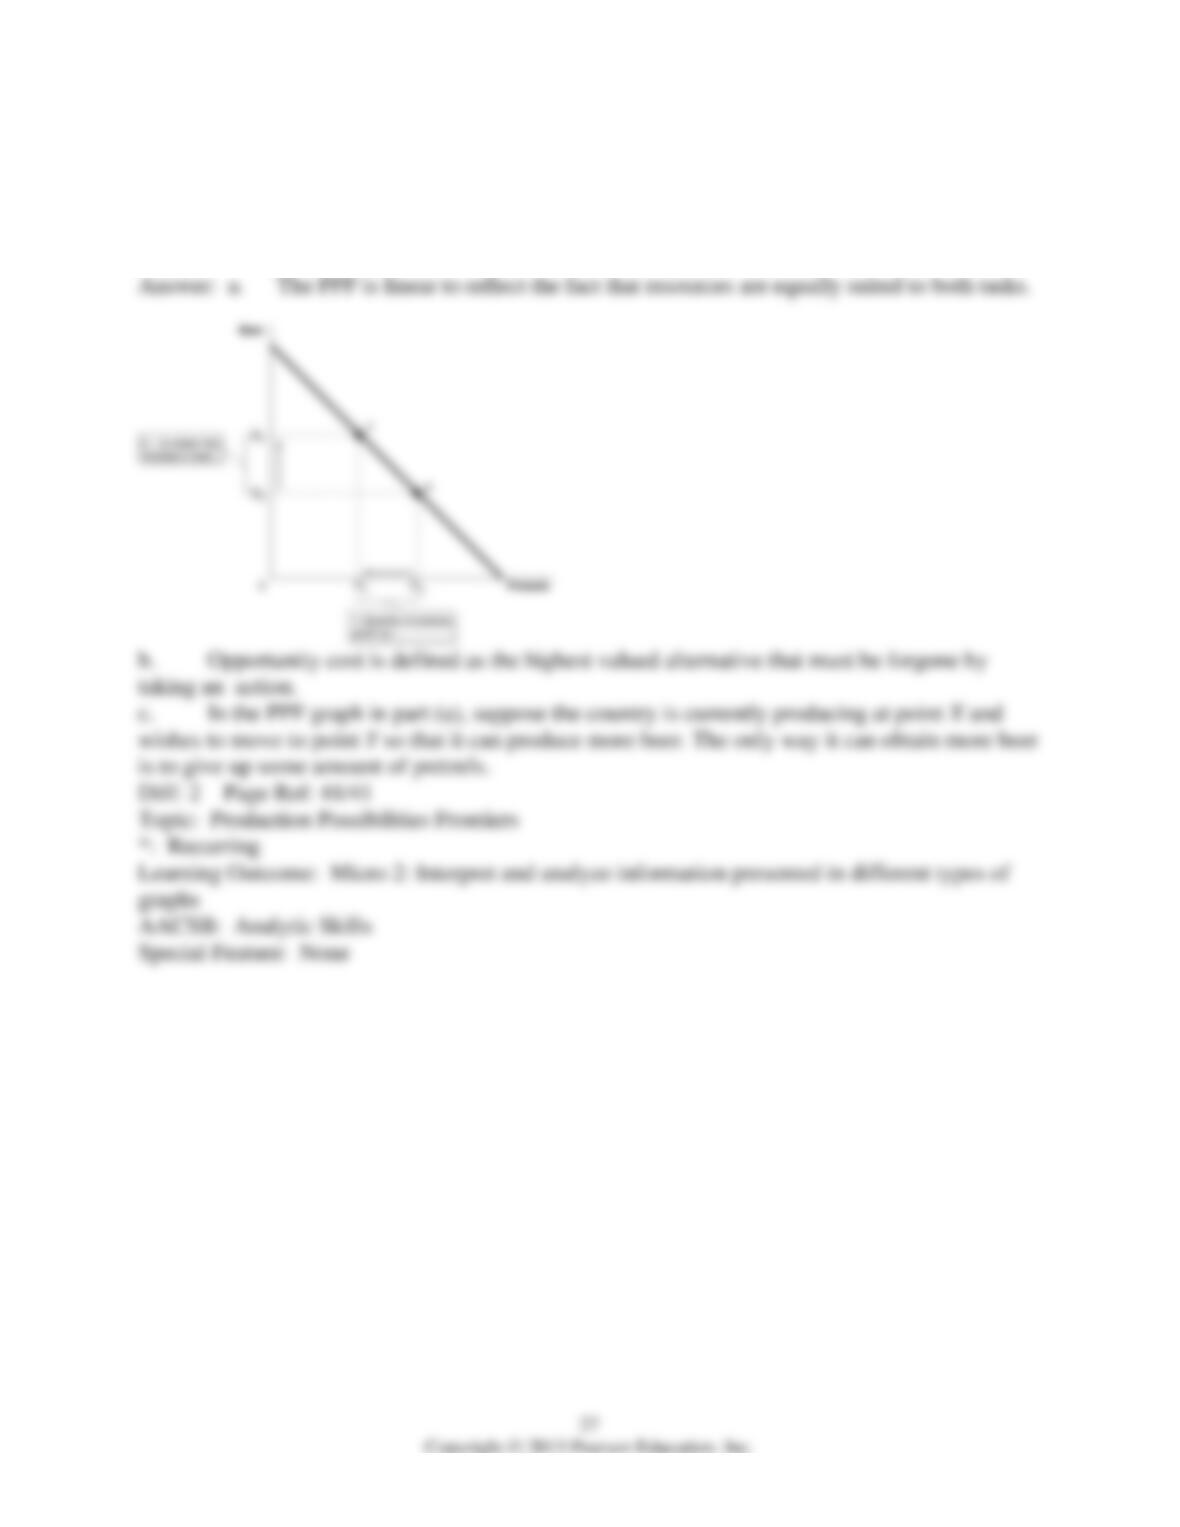
64) a. Draw a production possibilities frontier for a country that produces two goods, beer and
pretzels. Assume that resources are equally suited to both tasks.
b. Define opportunity costs.
c. Use your production possibilities frontier graph to demonstrate the principle of opportunity
costs.
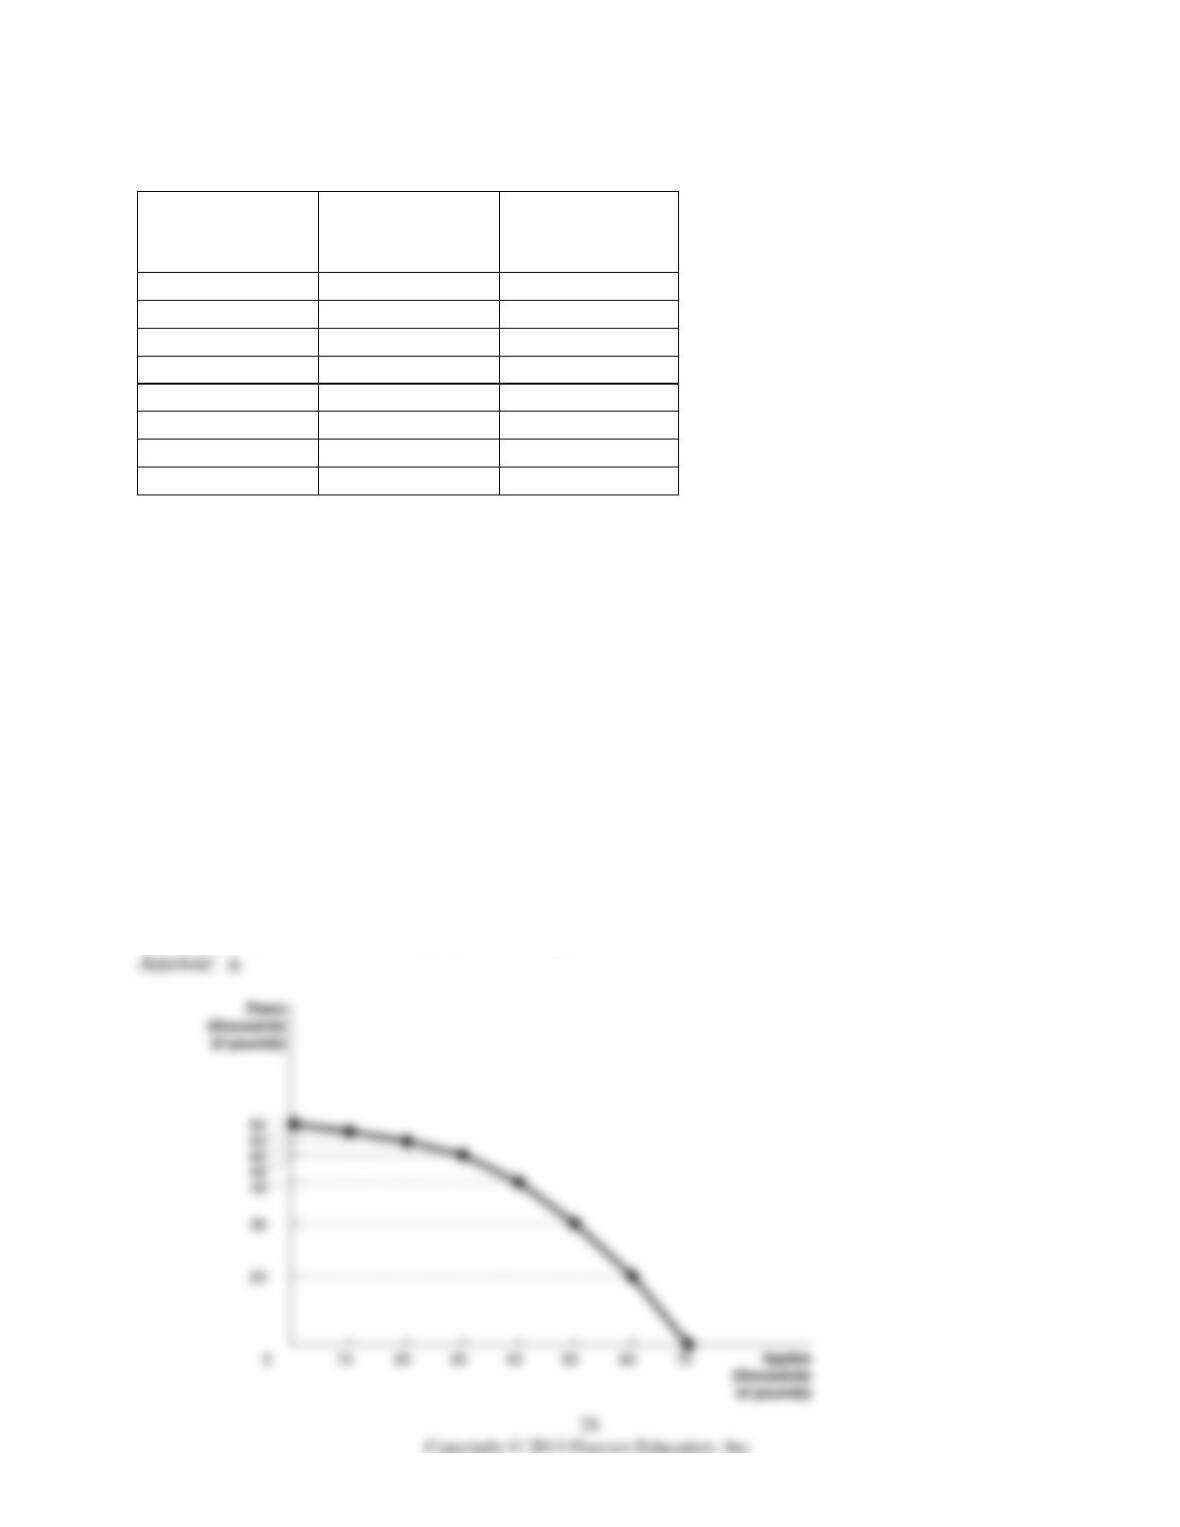
Table 2-2
Possible Output
Combinations
Apples
(thousands of
pounds)
Pears
(thousands of
pounds)
A
70
0
B
60
20
C
50
36
D
40
48
E
30
56
F
20
60
G
10
63
H
0
65
65) Refer to Table 2-2. The Fruit Farm produces only apples and pears. The table above shows
the maximum possible output combinations of the two fruits using all resources and currently
available technology.
a. Graph The Fruit Farm’s production possibilities frontier. Put apples on the horizontal axis
and pears on the vertical axis. Be sure to identify the output combination points on your diagram.
b. Suppose The Fruit Farm is currently producing at point D. What is the opportunity cost of
producing an additional 8,000 pounds of pears?
c. Suppose The Fruit Farm is currently producing at point D. What happens to the opportunity
cost of producing more and more pears? Does it increase, decrease or remain constant? Explain
your answer.
d. Suppose The Fruit Farm is currently producing at point G. What happens to the opportunity
cost of producing more and more apples? Does it increase, decrease or remain constant? Explain
your answer.
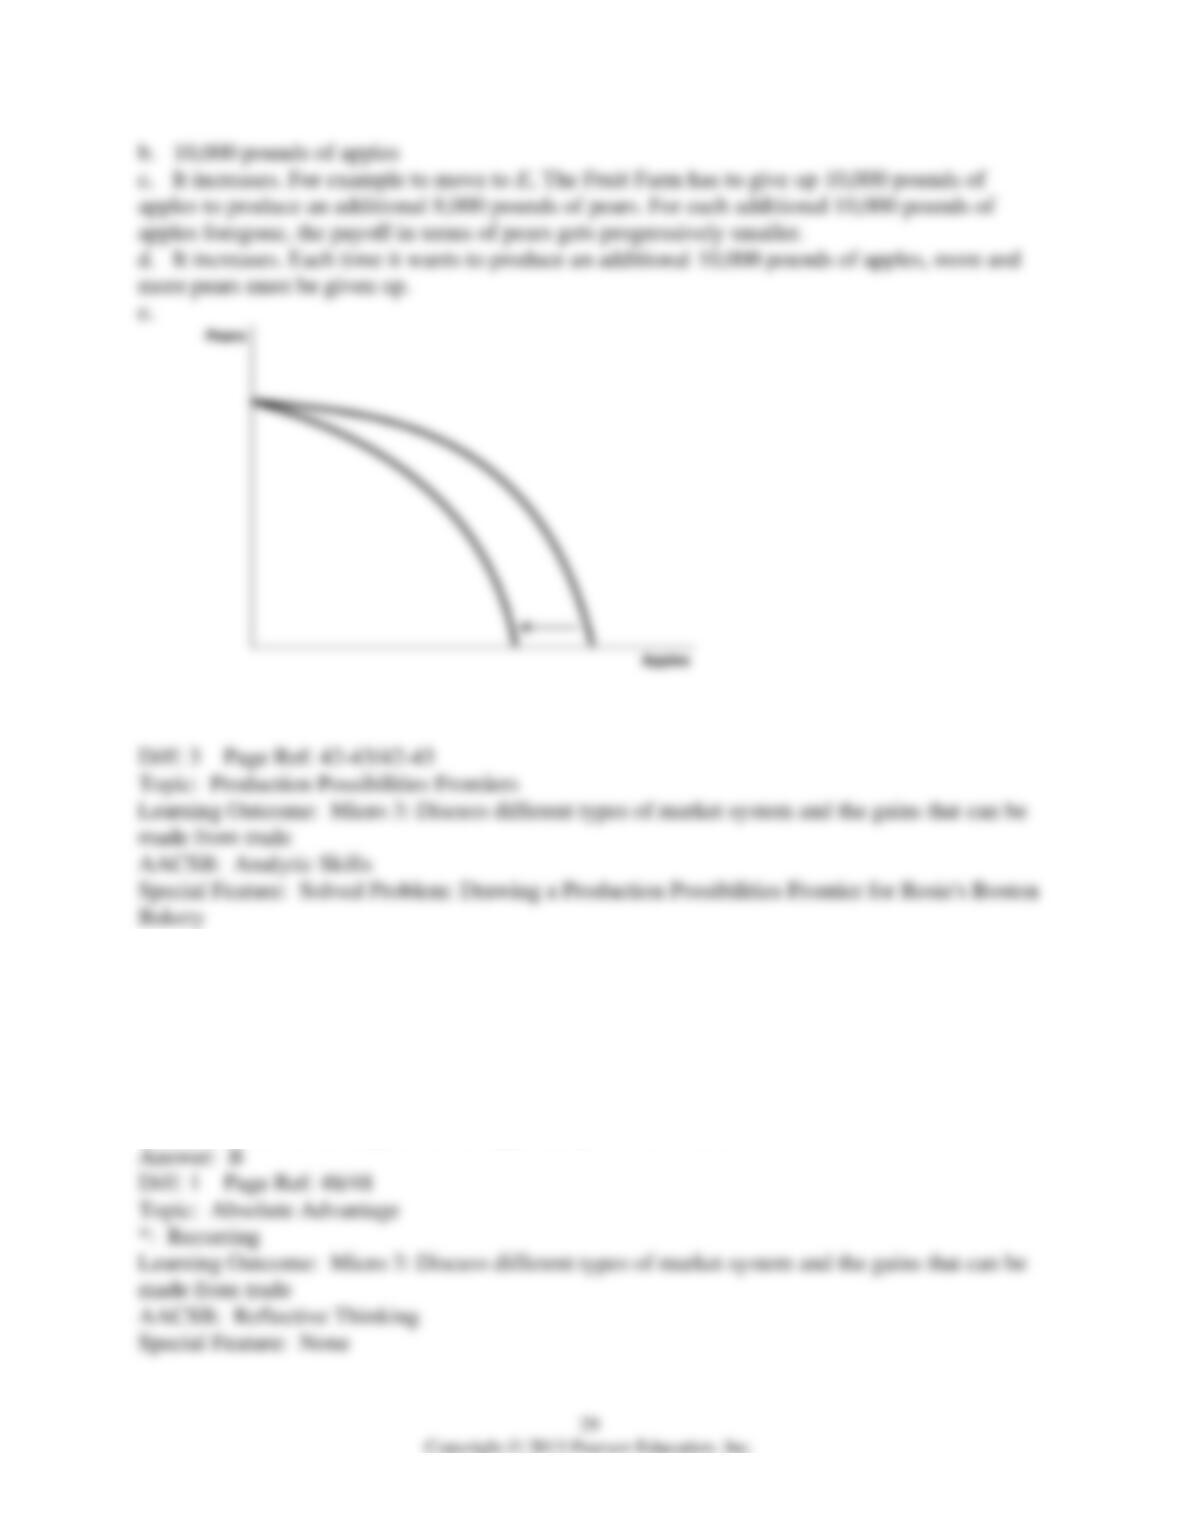
e. Suppose The Fruit Farm is plagued by the apple maggot infestation which destroys apple
trees but not pears. Show in a graph what happens to its PPF.
2.2 Comparative Advantage and Trade
1) You have an absolute advantage whenever you
A) are better educated than someone else.
B) can produce more of something than others with the same resources.
C) prefer to do one particular activity.
D) can produce something at a lower opportunity cost than others.
Table 2-3
Serena
Haley
Bracelets
8
9
Necklaces
16
12
Table 2-3 shows the output per week of two jewelers, Serena and Haley. They can either devote
their time to making bracelets or making necklaces.
2) Refer to Table 2-3. Which of the following statements is true?
A) Haley has an absolute advantage in making both products.
B) Serena has an absolute advantage in making both products.
C) Haley has an absolute advantage in making bracelets and Serena in making necklaces.
D) Haley has an absolute advantage in making necklaces and Serena in making bracelets.
3) Refer to Table 2-3. What is Haley’s opportunity cost of making a bracelet?
A) 3/4 of a bracelet
B) 3 bracelets
C) 1 1/3 necklaces
D) 2 necklaces
4) Refer to Table 2-3. What is Haley’s opportunity cost of making a necklace?
A) 3/4 of a bracelet
B) 3 bracelets
C) 1 1/3 necklaces
D) 2 necklaces
5) Refer to Table 2-3. What is Serena’s opportunity cost of making a bracelet?
A) 2 necklaces
B) 1/2 of a bracelet
C) 1/2 of a necklace
D) 3/4 of a bracelet
6) Refer to Table 2-3. What is Serena’s opportunity cost of making a necklace?
A) 2 necklaces
B) 1/2 of a bracelet
C) 1/2 of a necklace
D) 3/4 of a bracelet
7) Refer to Table 2-3. Which of the following statements is true?
A) Haley has a comparative advantage in making both products.
B) Serena has a comparative advantage in making both products.
C) Haley has a comparative advantage in making bracelets and Serena in making necklaces.
D) Haley has a comparative advantage in making necklaces and Serena in making bracelets.
8) Comparative advantage means the ability to produce a good or service
A) at a lower selling price than any other producer.
B) at a lower opportunity cost than any other producer.
C) of a higher quality than any other producer.
D) at a higher profit level than any other producer.
9) Specializing in the production of a good or service in which one has a comparative advantage
enables a country to do all of the following except
A) engage in mutually beneficial trade with other nations.
B) increase the variety of products that it can consume with no increase in resources.
C) consume a combination of goods that lies outside its own production possibilities frontier.
D) produce a combination of goods that lies outside its own production possibilities frontier.
10) For each bottle of wine that Italy produces, it gives up the opportunity to make 10 pounds of
cheese. France can produce 1 bottle of wine for every 25 pounds of cheese it produces. Which of
the following is true about the comparative advantage between the two countries?
A) Italy has the comparative advantage in cheese.
B) Italy has the comparative advantage in wine.
C) France has the comparative advantage in wine and cheese.
D) France has the comparative advantage in wine.
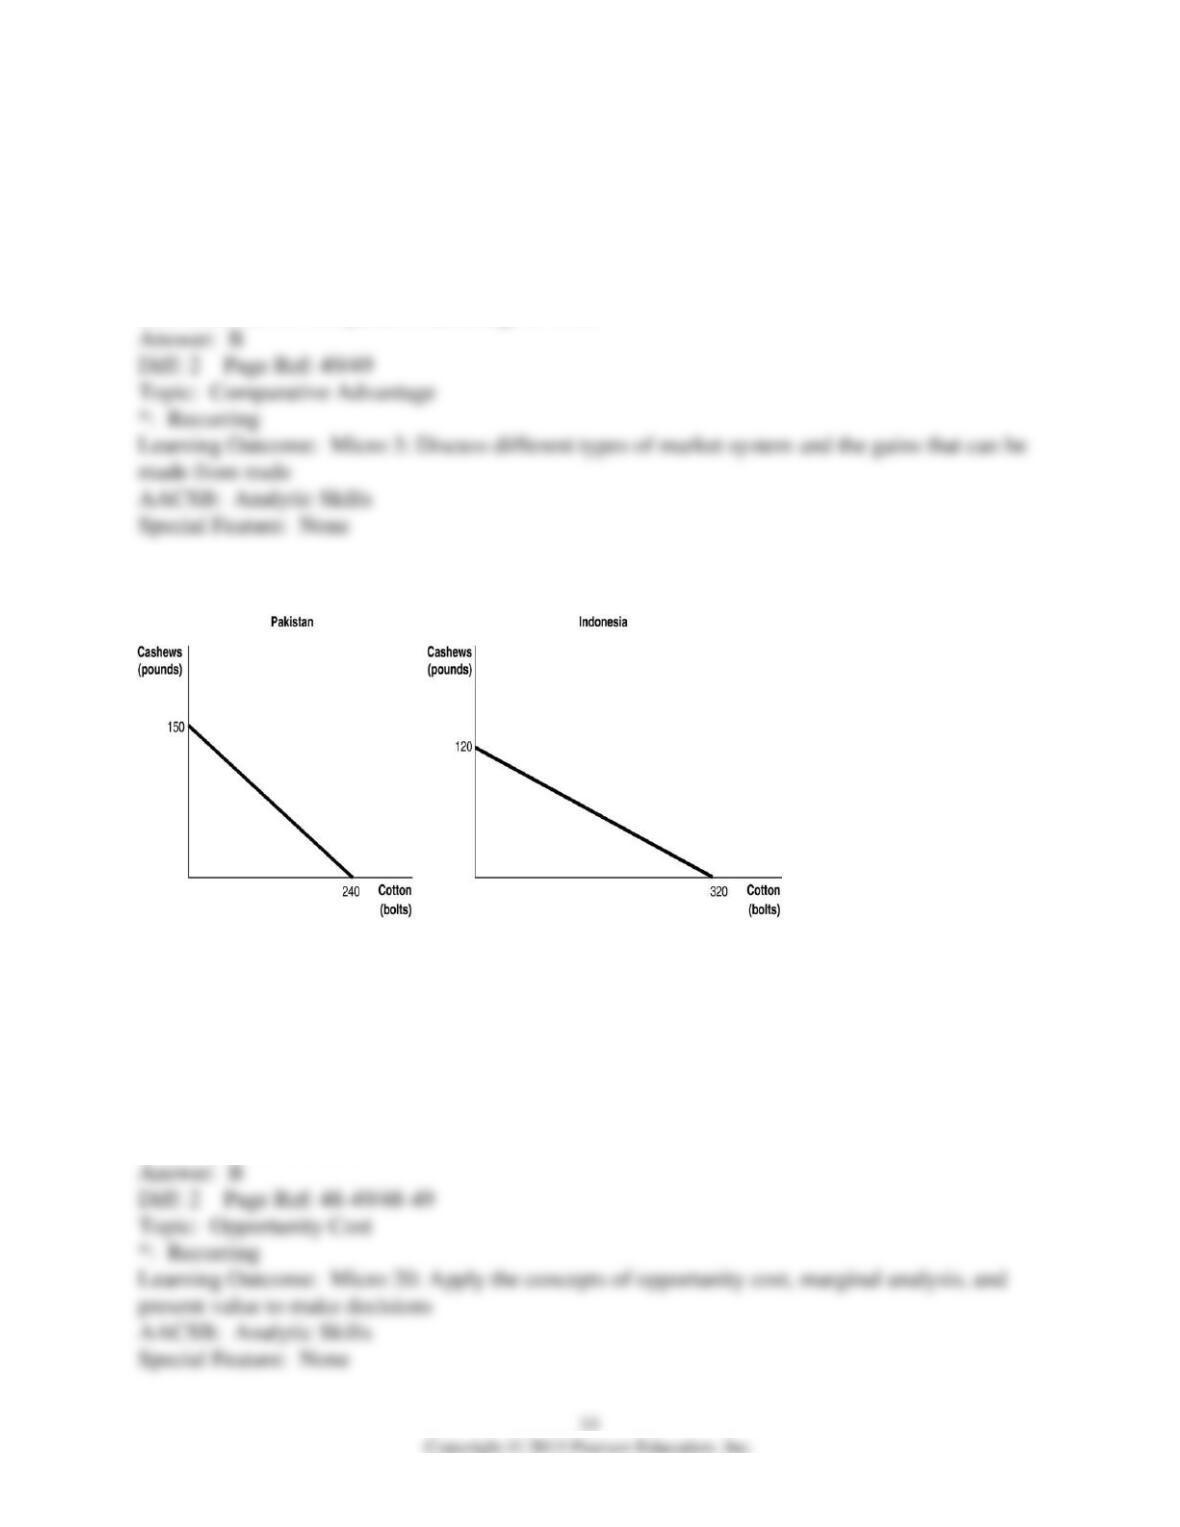
Figure 2-7
Figure 2-7 shows the production possibilities frontiers for Pakistan and Indonesia. Each country
produces two goods, cotton and cashews.
11) Refer to Figure 2-7. What is the opportunity cost of producing 1 bolt of cotton in Pakistan?
A) 3/8 of a pound of cashews
B) 5/8 of a pound of cashews
C) 1 3/5 pounds of cashews
D) 150 pounds of cashews
12) Refer to Figure 2-7. What is the opportunity cost of producing 1 bolt of cotton in Indonesia?
A) 3/8 of a pound of cashews
B) 5/8 of a pound of cashews
C) 2 2/3 pounds of cashews
D) 120 pounds of cashews
13) Refer to Figure 2-7. What is the opportunity cost of producing 1 pound of cashews in
Pakistan?
A) 3/8 of a bolt of cotton
B) 5/8 of a bolt of cotton
C) 1 3/5 bolts of cotton
D) 240 bolts of cotton
14) Refer to Figure 2-7. What is the opportunity cost of producing 1 pound of cashews in
Indonesia?
A) 3/8 of a bolt of cotton
B) 5/8 of a bolt of cotton
C) 2 2/3 bolts of cotton
D) 320 bolts of cotton
15) Refer to Figure 2-7. Which country has a comparative advantage in the production of
cotton?
A) Indonesia
B) They have equal productive abilities.
C) Pakistan
D) neither country
16) Refer to Figure 2-7. Which country has a comparative advantage in the production of
cashews?
A) Indonesia
B) They have equal productive abilities.
C) Pakistan
D) neither country
17) Refer to Figure 2-7. If the two countries have the same amount of resources and the same
technological knowledge, which country has an absolute advantage in the production of cotton?
A) Indonesia
B) They have the same advantage.
C) Pakistan
D) cannot be determined
18) Which of the following statements is true?
A) Individuals who have never been the best at doing anything cannot have a comparative
advantage in producing any product.
B) Individuals who have never been the best at doing anything can still have a comparative
advantage in producing some product.
C) Individuals who have never been the best at doing anything perform all tasks at a higher
opportunity cost than others.
D) Individuals who have never been the best at doing anything must have an absolute advantage
in at least ones task.
Table 2-4
One Digital
Camera
Wheat (per pound)
China
100 hours
4 hours
South Korea
60 hours
3 hours
Table 2-4 shows the number of labor hours required to produce a digital camera and a pound of
wheat in China and South Korea.
19) Refer to Table 2-4. Does either China or South Korea have an absolute advantage and if so,
in what product?
A) South Korea has an absolute advantage in wheat.
B) China has an absolute advantage in wheat.
C) South Korea has an absolute advantage in both products.
D) China has an absolute advantage in digital cameras.
20) Refer to Table 2-4. What is China’s opportunity cost of producing one digital camera?
A) 0.04 pounds of wheat
B) 4 pounds of wheat
C) 25 pounds of wheat
D) 40 pounds of wheat
21) Refer to Table 2-4. What is South Korea’s opportunity cost of producing one digital camera?
A) 0.05 pounds of wheat
B) 20 pounds of wheat
C) 25 pounds of wheat
D) 60 pounds of wheat
22) Refer to Table 2-4. What is China’s opportunity cost of producing one pound of wheat?
A) 0.04 units of a digital camera
B) 4 digital cameras
C) 25 digital cameras
D) 40 digital cameras
23) Refer to Table 2-4. What is South Korea’s opportunity cost of producing one pound of
wheat?
A) 60 digital cameras
B) 20 digital cameras
C) 5 digital cameras
D) 0.05 units of a digital camera
24) Refer to Table 2-4. China has a comparative advantage in the production of
A) wheat.
B) digital cameras.
C) both products.
D) neither product.
25) Refer to Table 2-4. South Korea has a comparative advantage in the production of
A) wheat.
B) digital cameras.
C) both products.
D) neither product.
26) Refer to Table 2-4. If the two countries specialize and trade, who should export wheat?
A) There is no basis for trade between the two countries.
B) China
C) South Korea
D) They should both be exporting wheat.
27) Refer to Table 2-4. If the two countries specialize and trade, who should export digital
cameras?
A) There is no basis for trade between the two countries.
B) China
C) South Korea
D) They should both be importing digital cameras.
28) If the best surgeon in town is also the best at cleaning swimming pools, then according to
economic reasoning, this person should
A) should pursue the activity he enjoys more.
B) specialize in cleaning swimming pools because it is more labor-intensive.
C) split his time evenly between being a surgeon and cleaning swimming pools.
D) specialize in being a surgeon because its opportunity cost is lower.
29) Rayburn Reed is a highly talented photographer. He has chosen to specialize in photography
because of all of the following except
A) he obviously has a comparative advantage in photography.
B) his opportunity cost of pursuing another career is very low.
C) for him, this is the most lucrative way to purchase the products that he wants to consume.
D) his photographs are highly esteemed by art lovers who are willing to pay very high prices.
30) If Sanjaya can shuck more oysters in one hour than Tatiana, then Sanjaya has a comparative
advantage in shucking oysters.
31) The basis for trade is comparative advantage, not absolute advantage.
32) If a country produces only two goods, it is possible to have a comparative advantage in the
production of both those goods.