Chapter 19—Chi-Square
MULTIPLE CHOICE QUESTIONS
19.1 The chi-square test is used when we have
19.2+ When we sort subjects only into those who improved their performance over time,
worsened their performance over time, and stayed the same, we have
19.3 If we run a chi-square test on a one-way classification, a significant result tells us
that
19.4+ When our emphasis is on sorting outcomes into categories of data, we are
concerned with
19.5 With categorical data, the primary piece of data is
19.6 A goodness-of-fit test is used with
Chapter 19
19.7+ A typical null hypothesis with a goodness-of-fit test as presented in the text might
be
19.8 A significant result with a goodness-of-fit test might suggest to us that
19.9 A goodness-of-fit test is
19.10+ Which of the following is the formula for a standard chi-square test?
19.11+ You should be careful about using a chi-square test when
19.12 The denominator in chi-square is there to
Test Bank
382
19.13 The chi-square distribution is
19.14+ The critical value of 2
19.15 For a goodness-of-fit chi-square test, the degrees of freedom are equal to
19.16+ The most common level of when running a goodness-of-fit chi-square is
19.17 When using the chi-square tables, we reject the null hypothesis when
19.18+ An example of data that would be analyzed with a chi-square is
19.19+ The null hypothesis for the previous example which used a chi-square is
Chapter 19
383
19.20 The multicategory goodness-of-fit case for chi-square is
19.21 With several categories in a goodness-of-fit test, a significant result means
19.22 A contingency table involves
For the next several questions, assume that we had the following contingency table:
Agree
Disagree
Total
Females
25
36
61
Males
12
9
21
Total
37
45
82
19.23 Which of the following are marginal totals?
19.24 Which of the following are the cell totals?
19.25+ In the table above, the expected frequency in the Male/Disagree cell is closest to
Test Bank
384
19.26 With a two-way contingency table the degrees of freedom are
19.27+ In the contingency table shown above, the degrees of freedom would equal
19.28+ The text mentions a correction for continuity and suggests that
19.29+ The correction for continuity is known as
19.30 The difference between the chi-square test for a 2
2 table and one for a larger
table is
19.31 The chi-square test can run into trouble if
19.32+ If we want to use the chi-square test to test the difference between means we
should
Chapter 19
385
19.33 If we want to use the chi-square test to test the difference between two
proportions, we should
19.34+ If we want to test proportions, one wrong way to do so is to
19.35 We can only use a chi-square test with frequency data if
19.36 In a chi-square test the expected frequency is
TRUE/FALSE QUESTIONS
with predicted frequencies.
observations in a cell if the alternative hypothesis is true.
categorized into one of 4 possible categories, the df = 26.
in multiple cells.
every cell have expected frequencies greater than or equal to 10.
other with 3 categories, the df = 6.

Test Bank
386
19.45 [TRUE] A marginal total is the sum of the level of one variable across all of the
levels of the other variable.
represented by this formula:
N
CR ji
ij =
OPEN-ENDED QUESTIONS
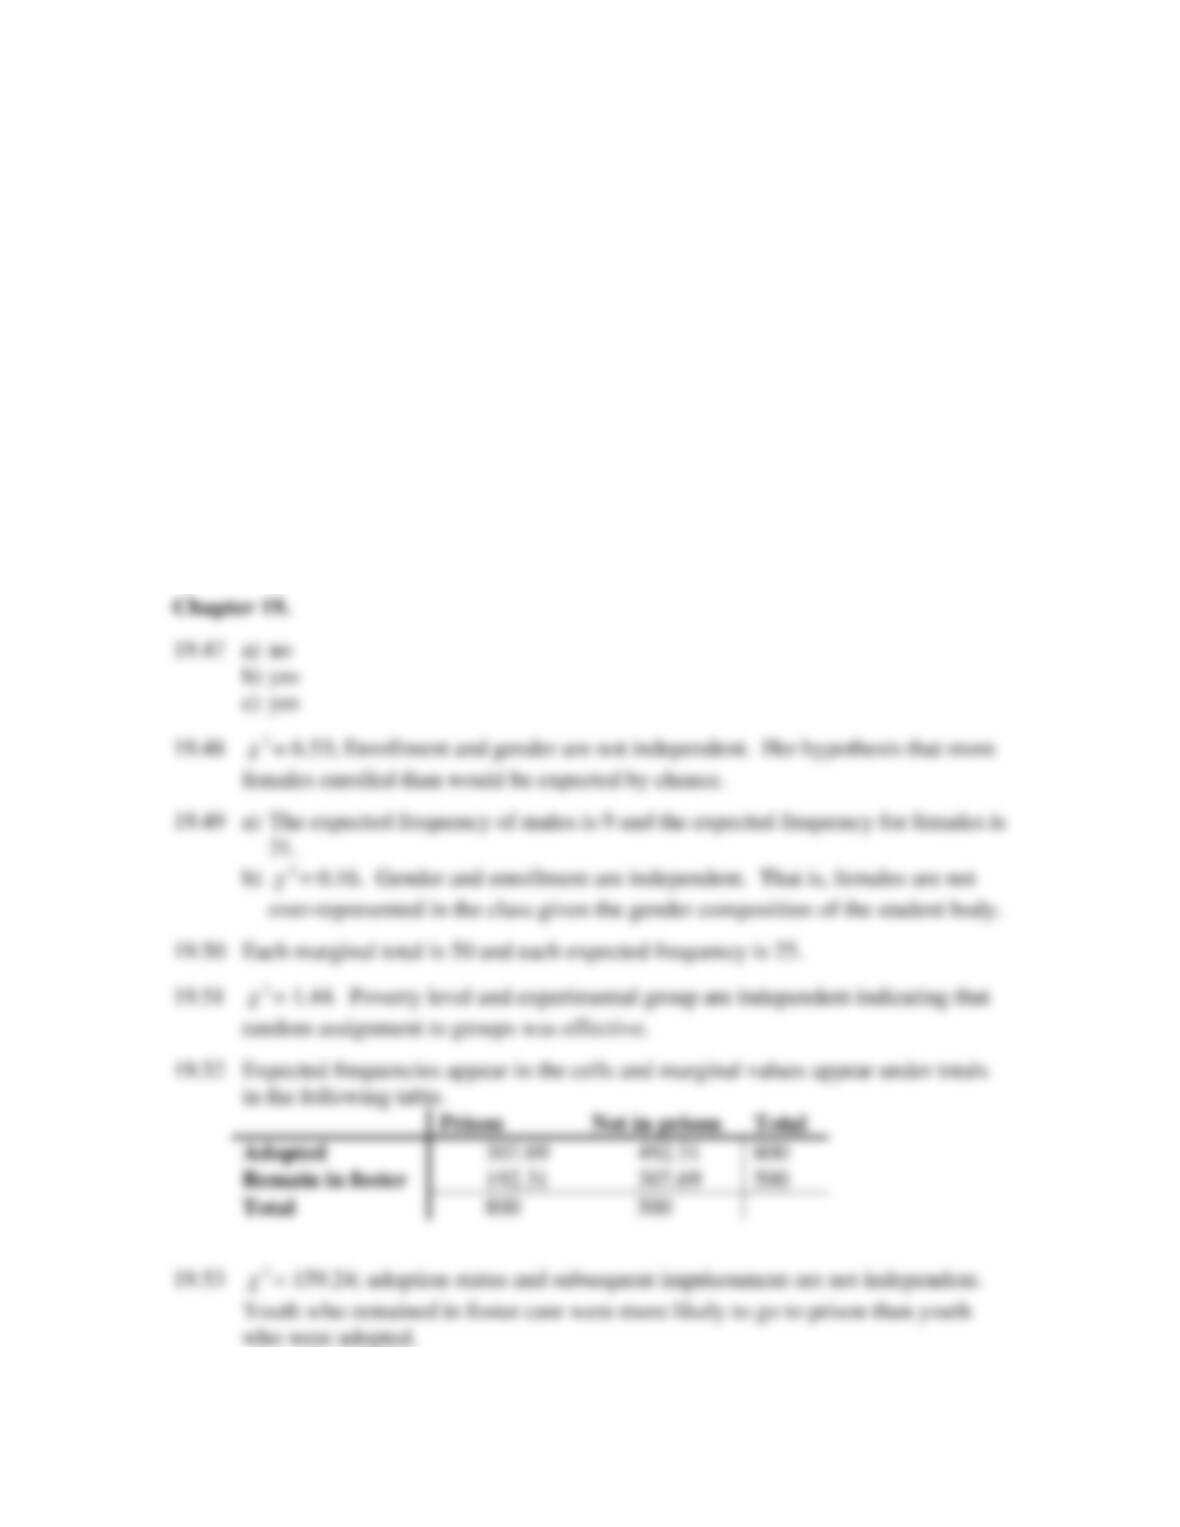
19.47 Indicate whether or not the following Chi-square statistics are significant:
a)
=
2
2.75; k =2
b)
=
2
11.00; k =5
c)
=
2
12.40; df = 6
19.48 A professor believes that a greater proportion of females than males have enrolled
in her class. Assuming an equal number of males and females in the student
body, calculate Chi-square, and evaluate her hypothesis based on the following
data.
Males Enrolled
Females Enrolled
10
20
19.49 Assuming the student body in the previous example is 30% male and 70% female,
a) What are the expected values
b) Calculate and interpret Chi-square
19.50 A researcher wants to be sure that her random assignment to groups has been
working. She wants to be sure that socio-economic status and treatment group are
independent. Ideally, given her particular sample, there would be an equal
number of people in each category. Calculate the marginal totals and the
expected frequencies for each cell.
Experimental Group
Control Group
Below poverty line
22
28
Above Poverty line
28
22
19.51 Calculate and interpret Chi-square for the previous example.
19.52 A social worker has been asked to testify before her state legislature about the
impact of long-term foster care on child outcomes and government spending. She
knows that 60% of children who remained in the foster care system without being
adopted ended up in prison. The figure for foster care children who were
eventually adopted was 25%. These data were based on 500 children who
remained in foster care and 800 children who were eventually adopted. Create the
appropriate contingency table.
Chapter 19
387
19.53 Calculate and interpret Chi-square based on the contingency table you created.
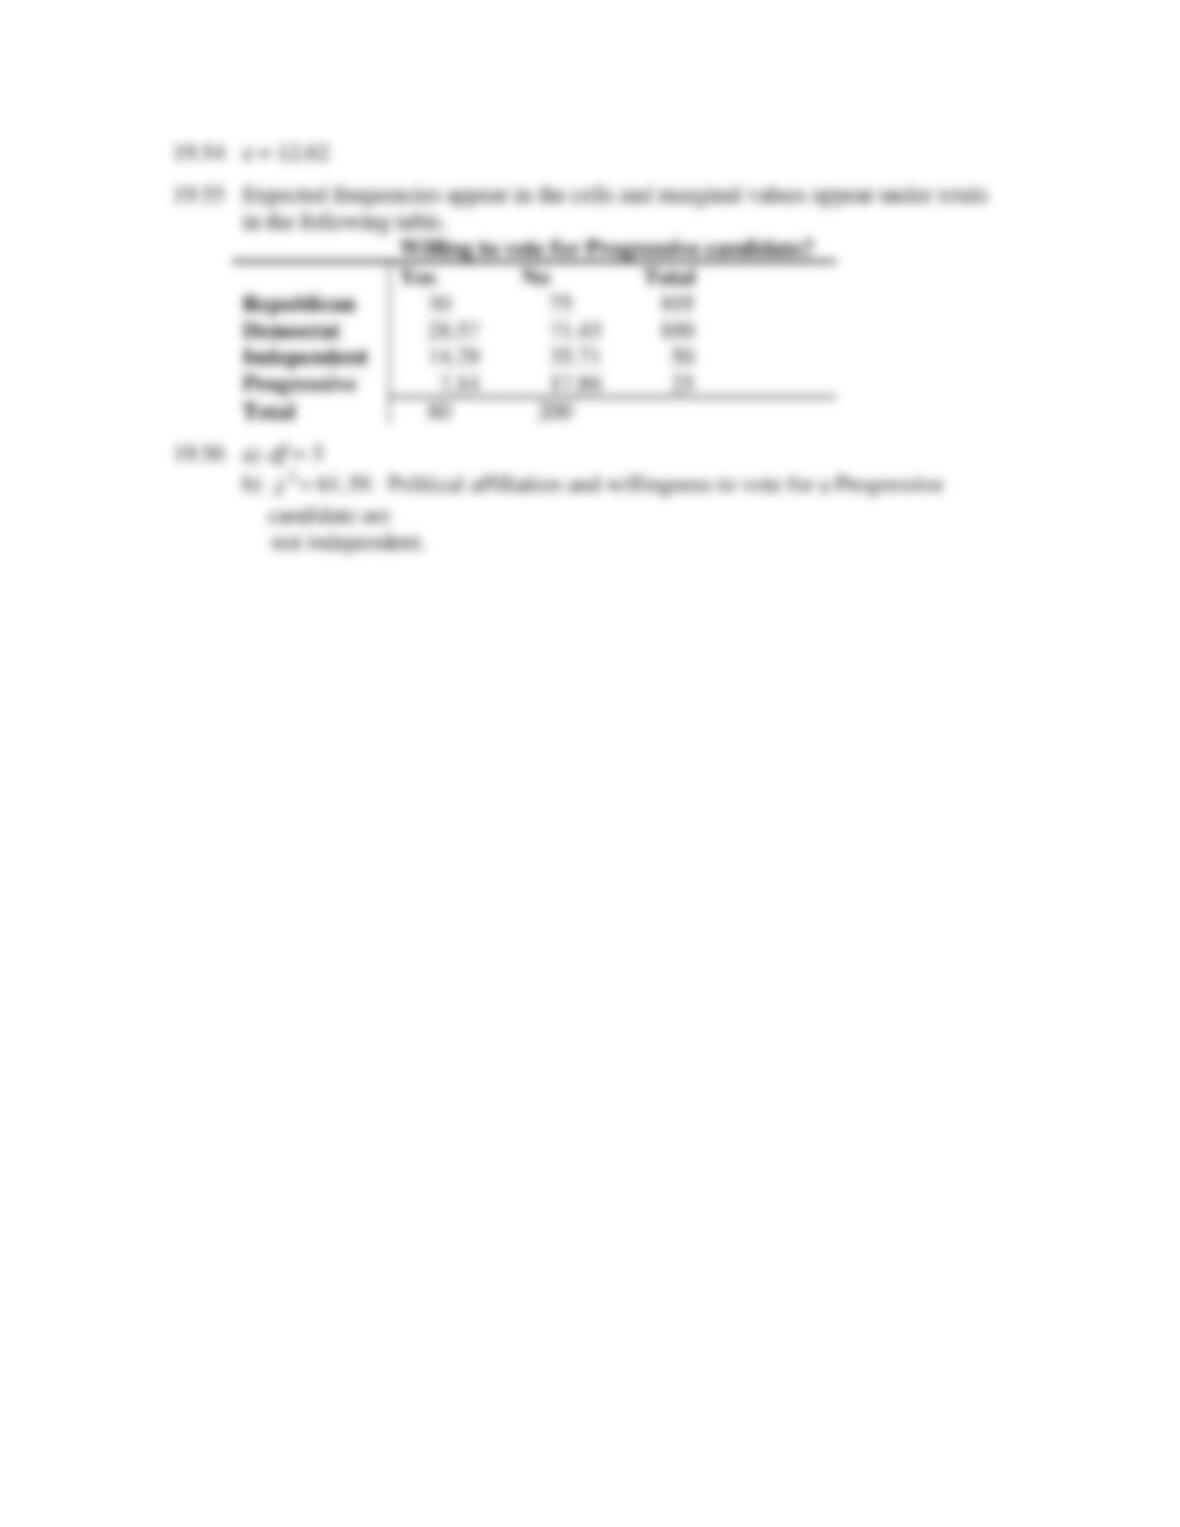
19.54 Calculate and interpret the z score based on the proportion of youth who end up in
prison using the data from the previous example.
19.55 A political science student did a survey to see if the political affiliation of voters
was related to whether or not they would consider voting for a progressive
candidate in the upcoming gubernatorial race. How would you calculate the
marginals and expected frequencies for each cell.
19.56 Based on the previous example:
a) What are the df?
b) Calculate and interpret Chi-square.
Answers to Open-ended Questions
Test Bank
388