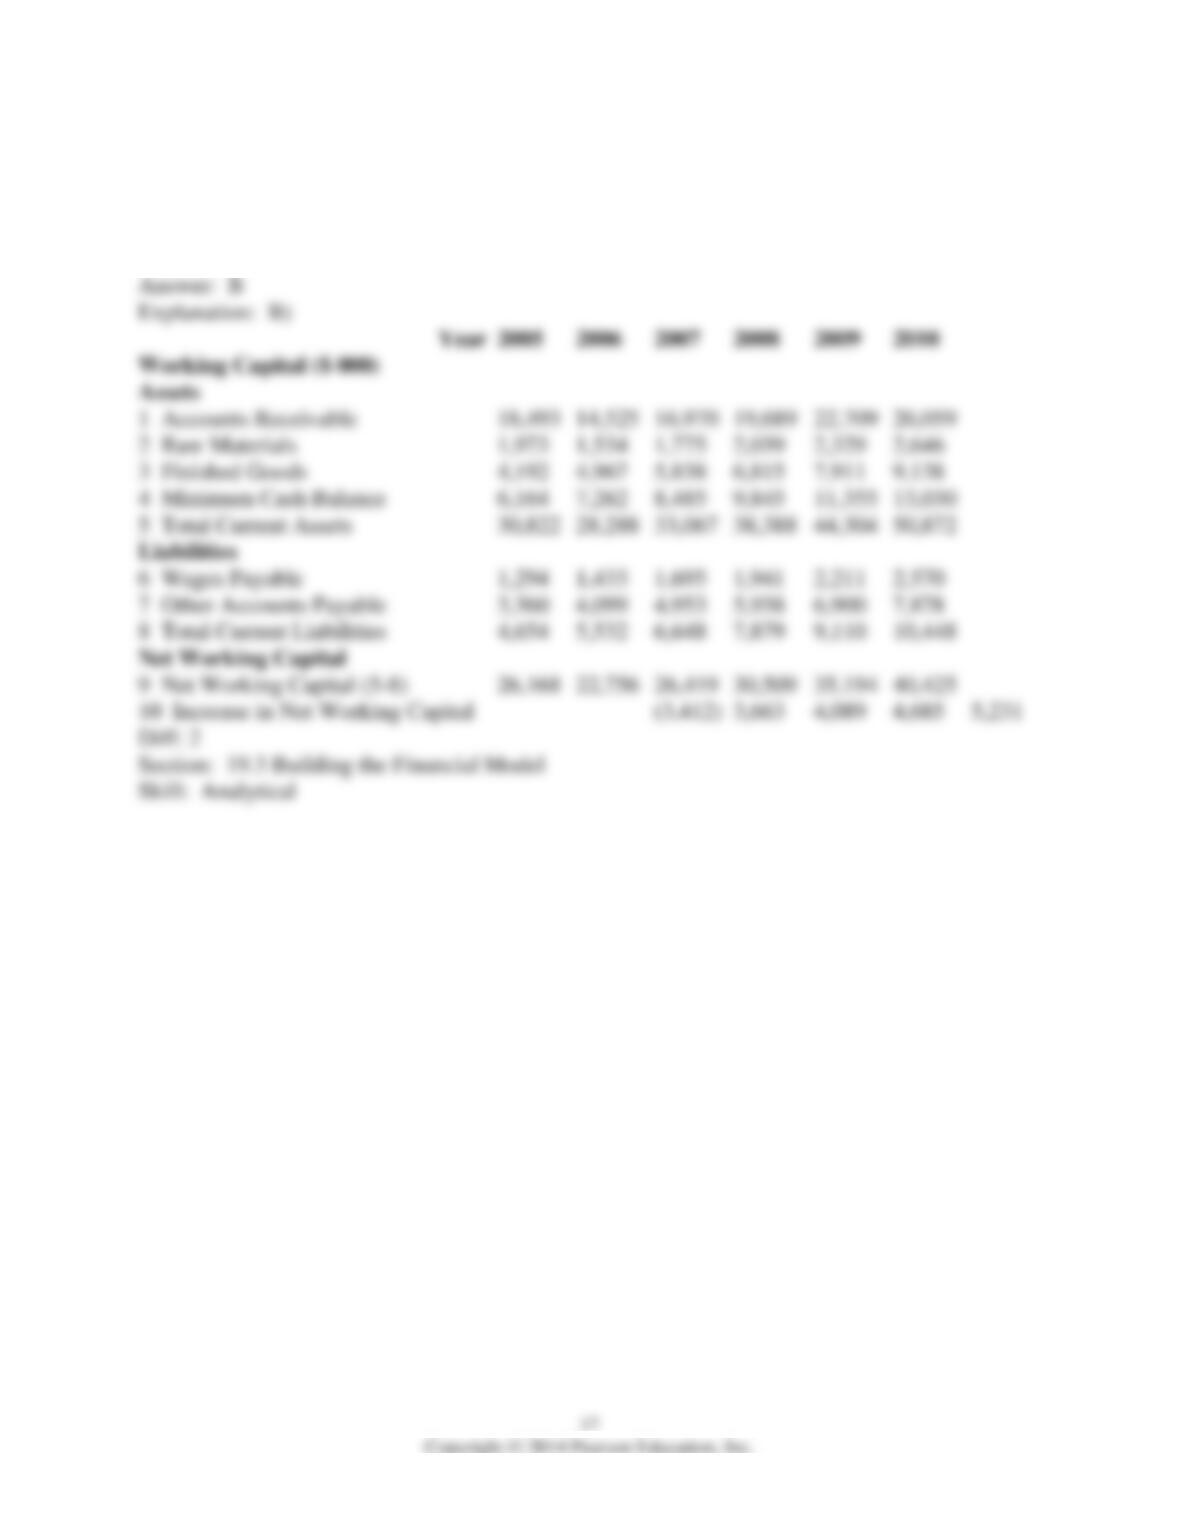
11) The amount of net working capital for Ideko in 2007 is closest to:
A) $30,510
B) $26,420
C) $22,170
D) $35,195
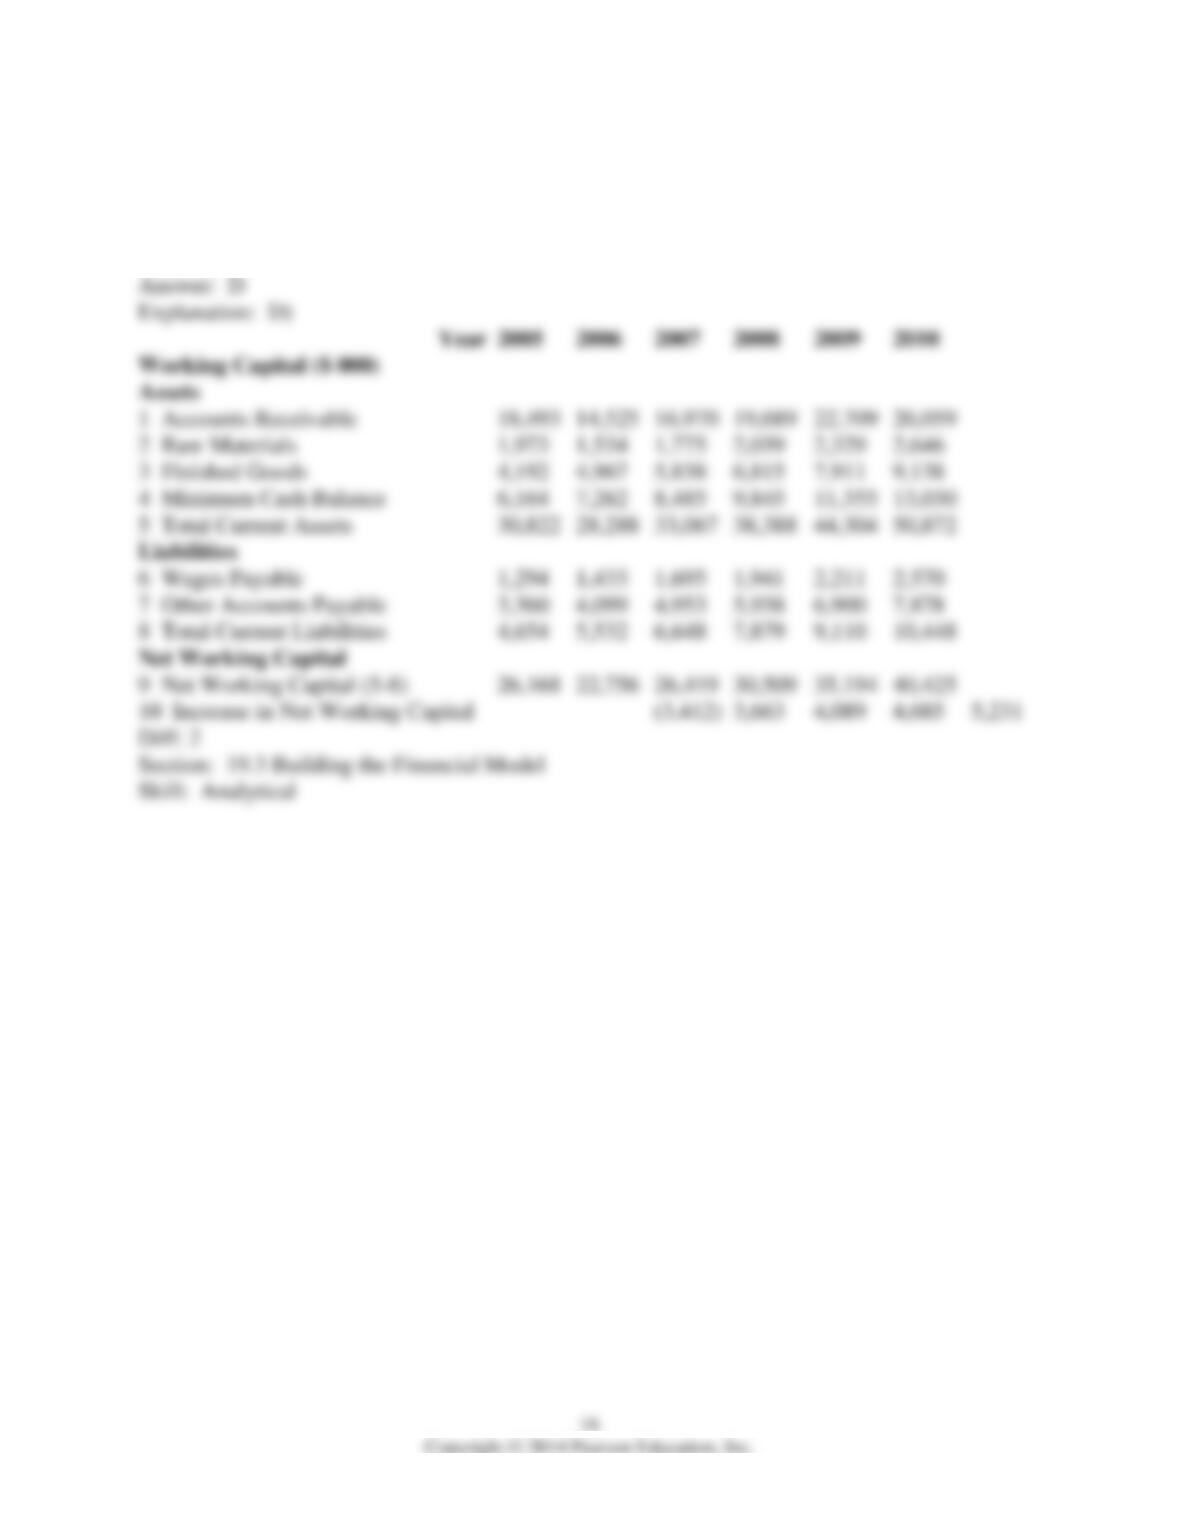
12) The amount of net working capital for Ideko in 2008 is closest to:
A) $35,195
B) $26,420
C) $22,170
D) $30,510
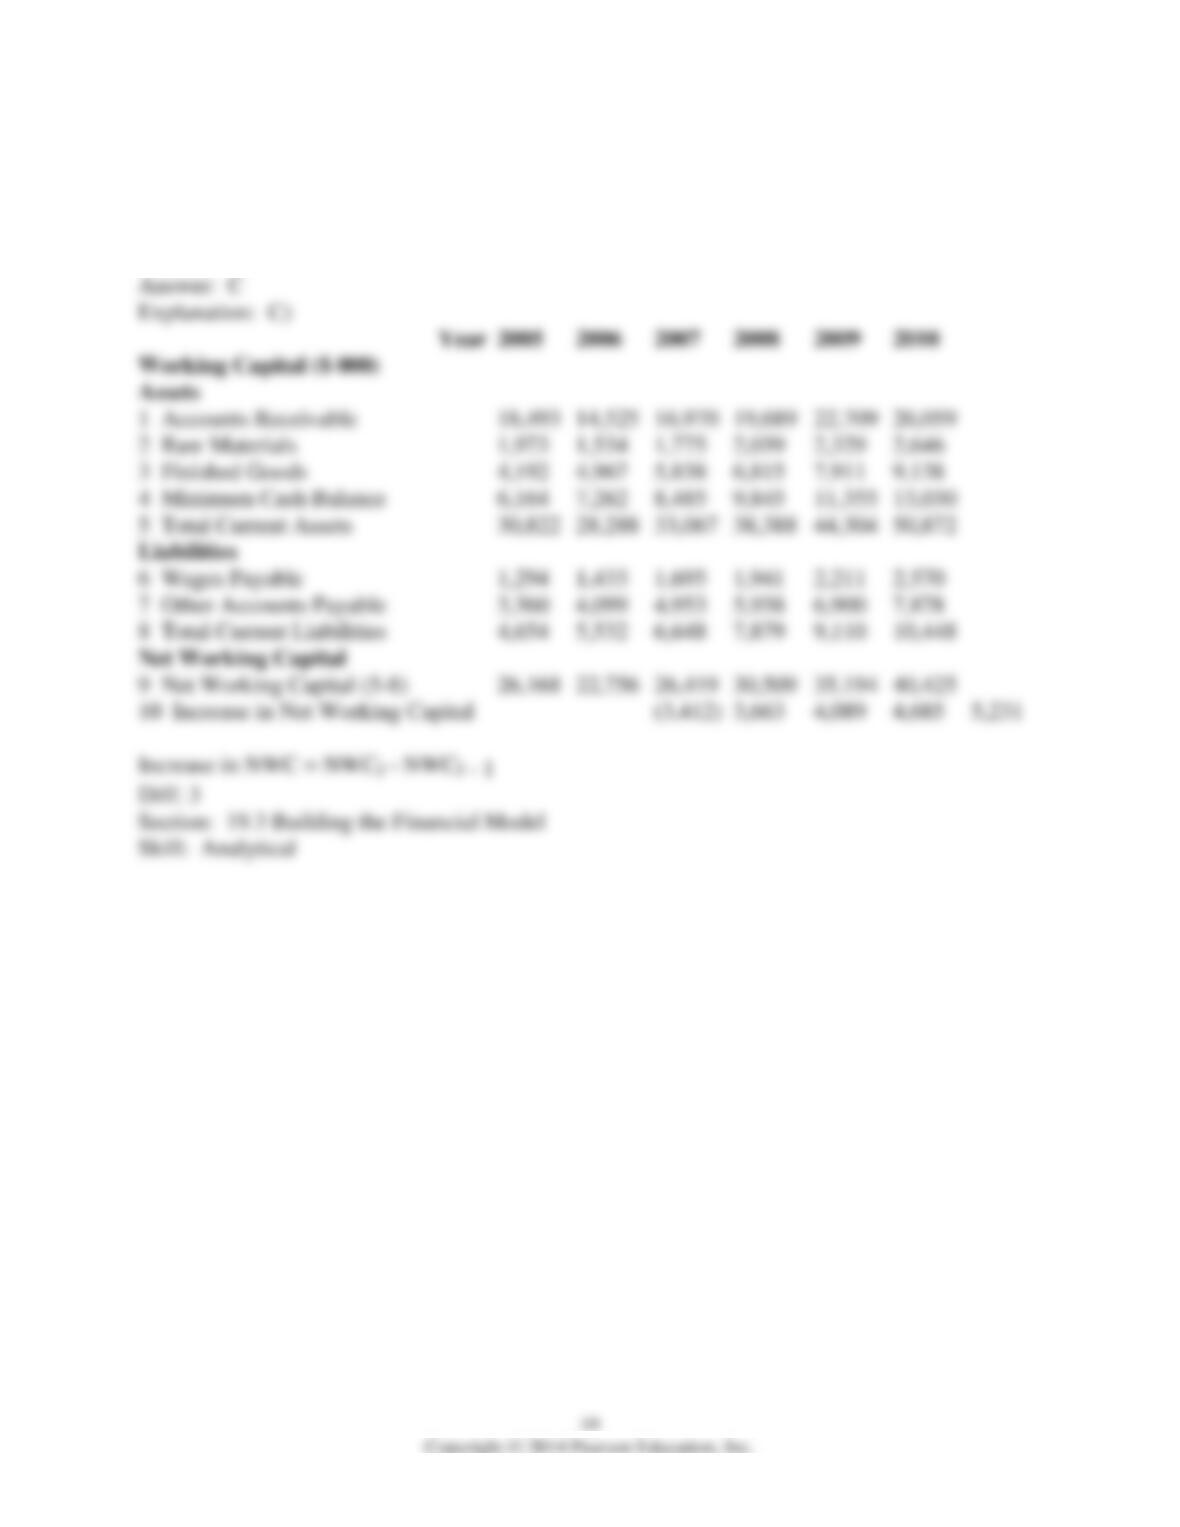
13) The amount of the increase in net working capital for Ideko in 2007 is closest to:
A) $4,090
B) $4,685
C) $3,665
D) $5,230
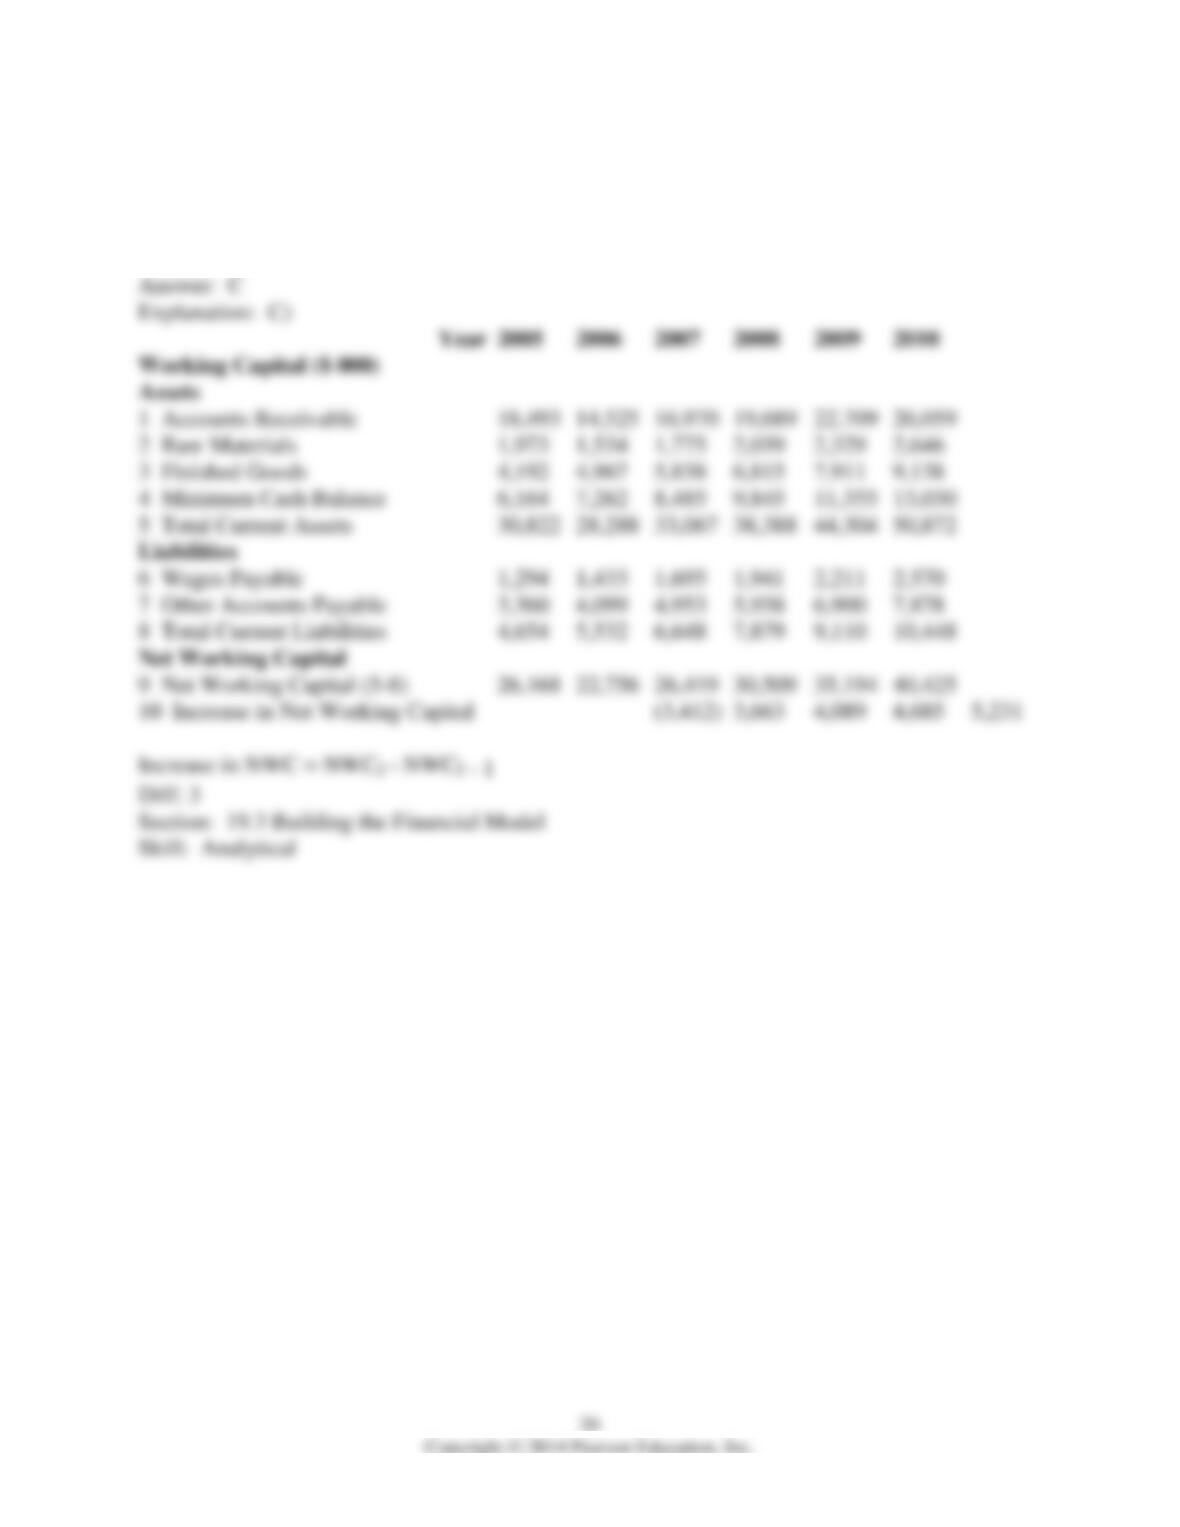
14) The amount of the increase in net working capital for Ideko in 2008 is closest to:
A) $4,685
B) $3,665
C) $4,090
D) $5,230
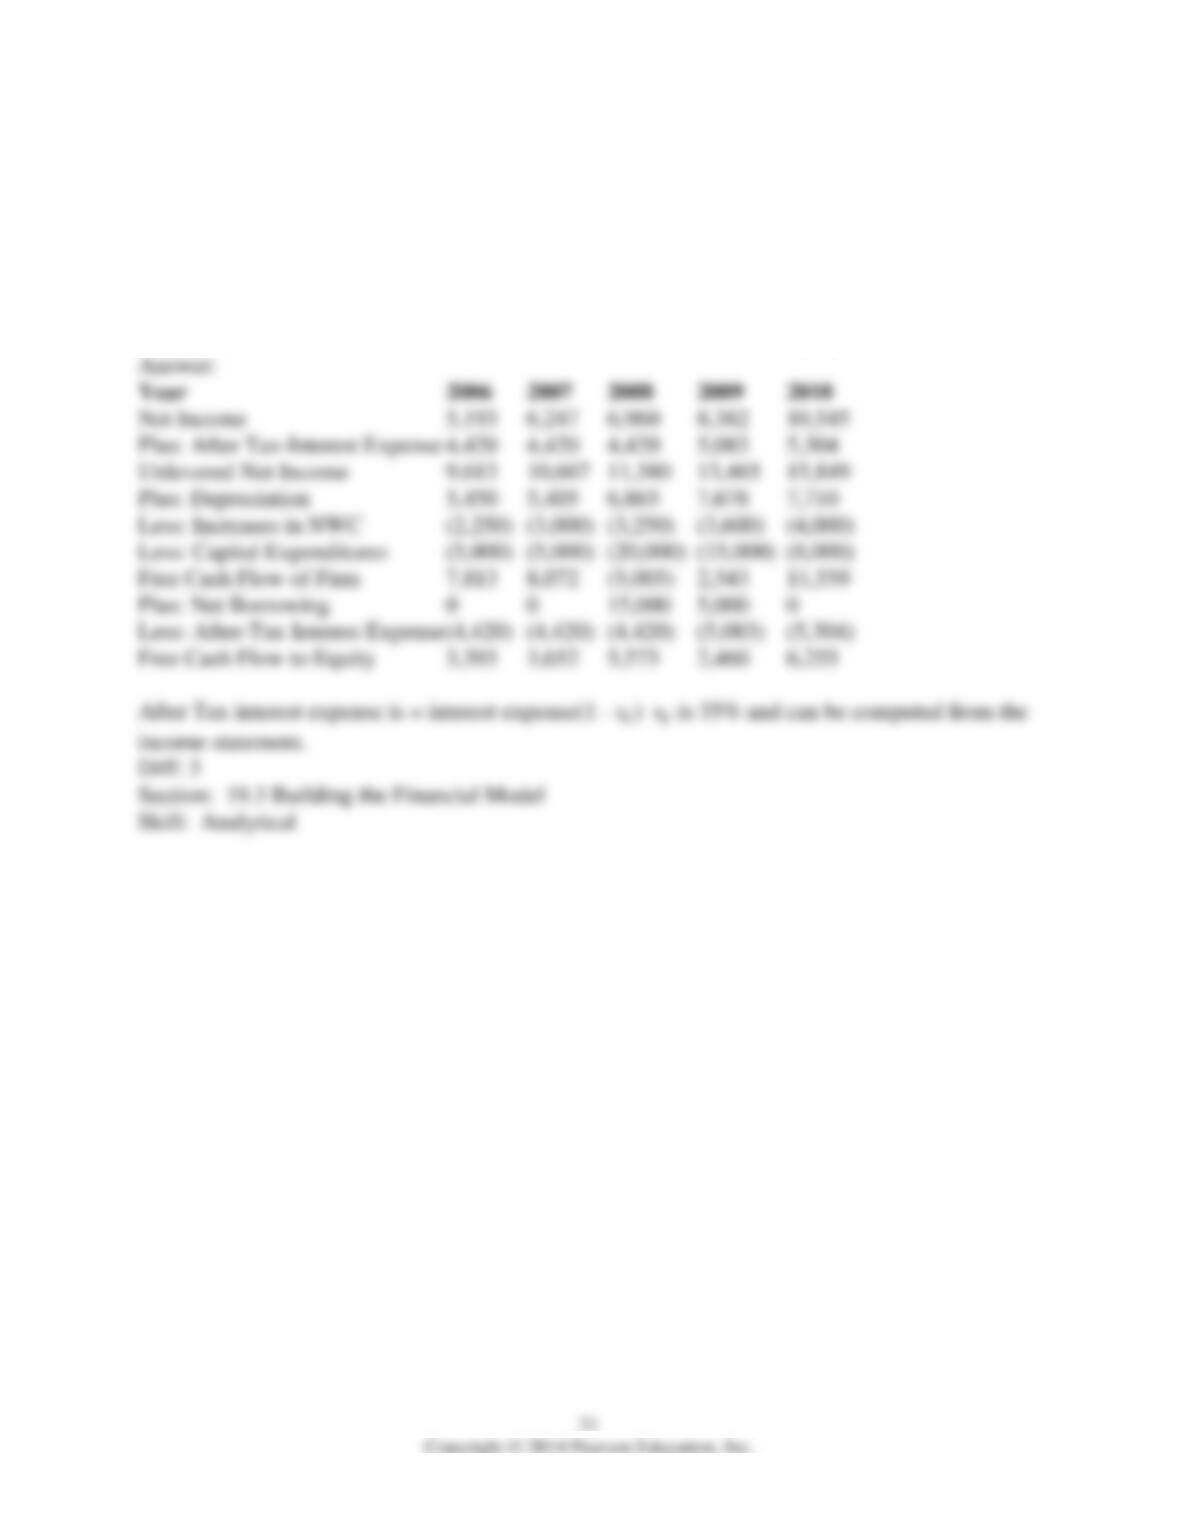
15) Using the income statement above and the following information:
Year 2006 2007 2008 2009 2010
Increases in NWC 2,250 3,000 3,250 3,600 4,000
Capital Expenditures5,000 5,000 20,000 15,000 8,000
Net Borrowing 0 0 15,000 5,000 0
Calculate Ideko’s Free Cash Flow to the Firm and Free Cash Flow to Equity in 2007.
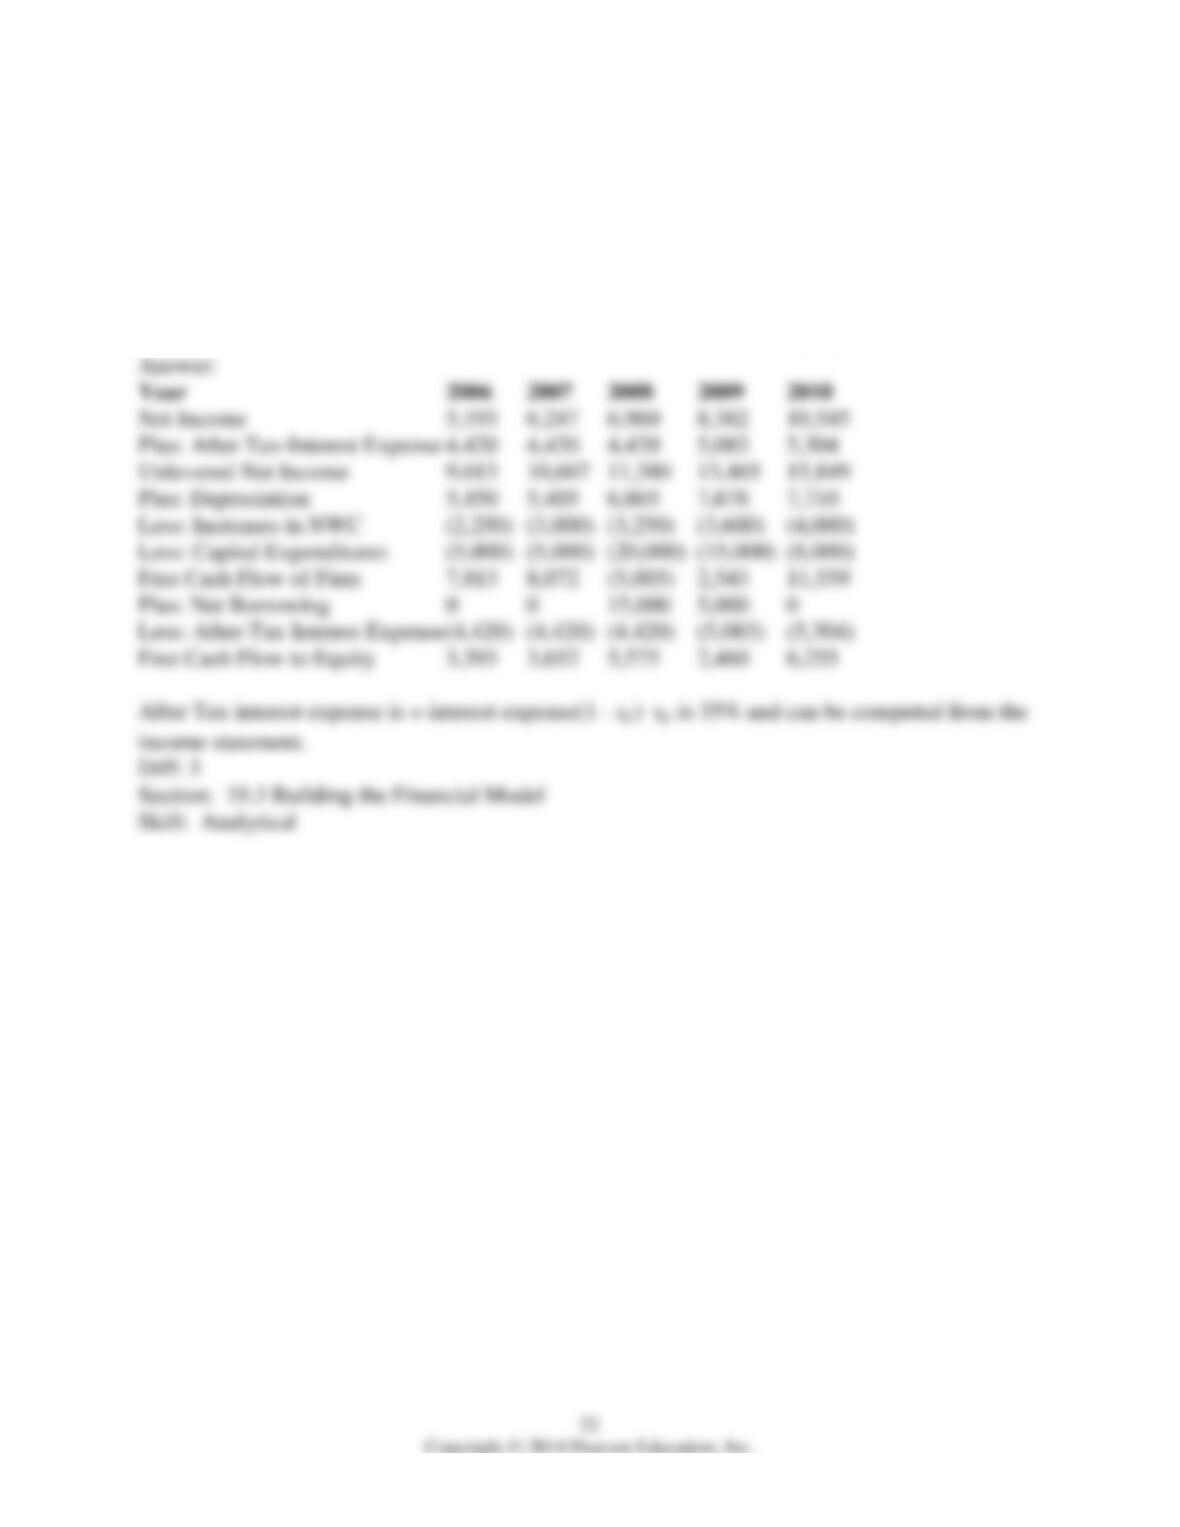
16) Using the income statement above and the following information:
Year 2006 2007 2008 2009 2010
Increases in NWC 2,250 3,000 3,250 3,600 4,000
Capital Expenditures5,000 5,000 20,000 15,000 8,000
Net Borrowing 0 0 15,000 5,000 0
Calculate Ideko’s Free Cash Flow to the Firm and Free Cash Flow to Equity in 2009.
19.4 Estimating the Cost of Capital
Use the table for the question(s) below.
Capital Structure and Unlevered Beta Estimates for Comparable Firms
Firm
βE βD βU
Oakley 1.00 0.00 1.50 — 1.50
Luxottica 0.83 0.17 0.75 0 0.62
Nike 1.05 -0.05 0.60 0 0.63
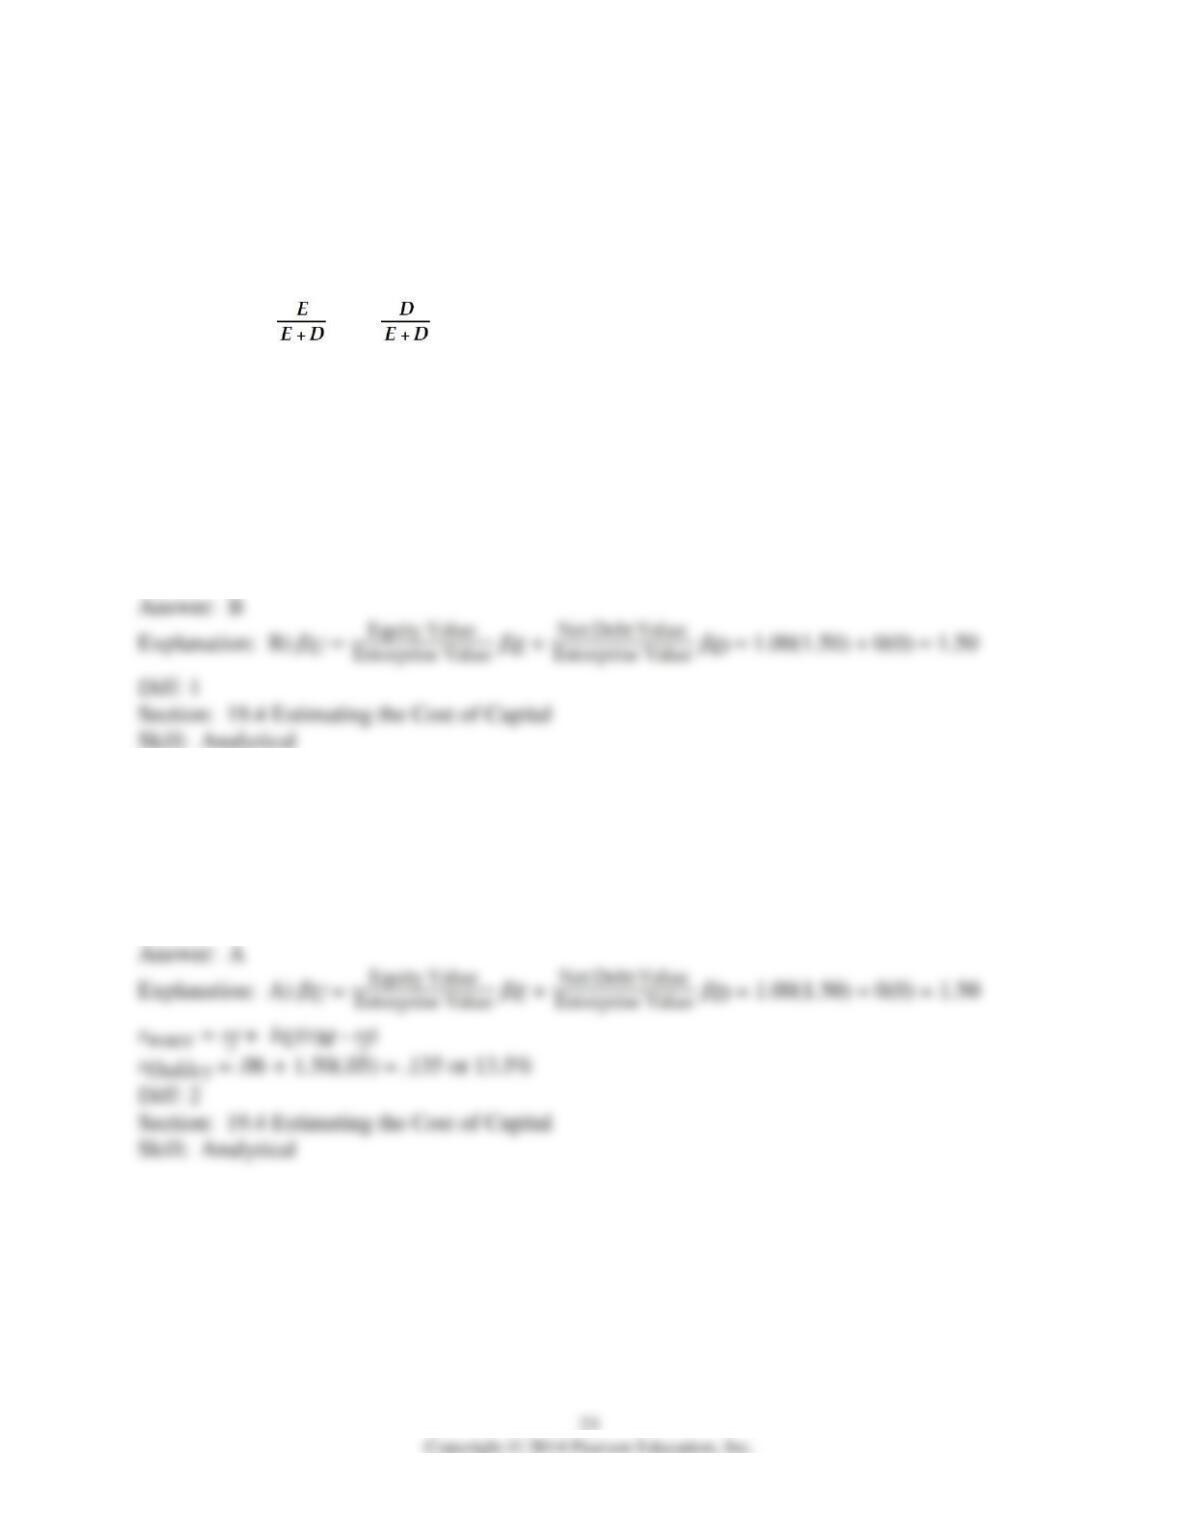
1) The unlevered beta for Oakley is closest to:
A) 0.70
B) 1.50
C) 1.00
D) 0.60
2) If the risk-free rate of interest is 6% and the market risk premium has historically averaged
5%, then the cost of capital for Oakley is closest to:
A) 13.5%
B) 10.2%
C) 9.1%
D) 14.7%
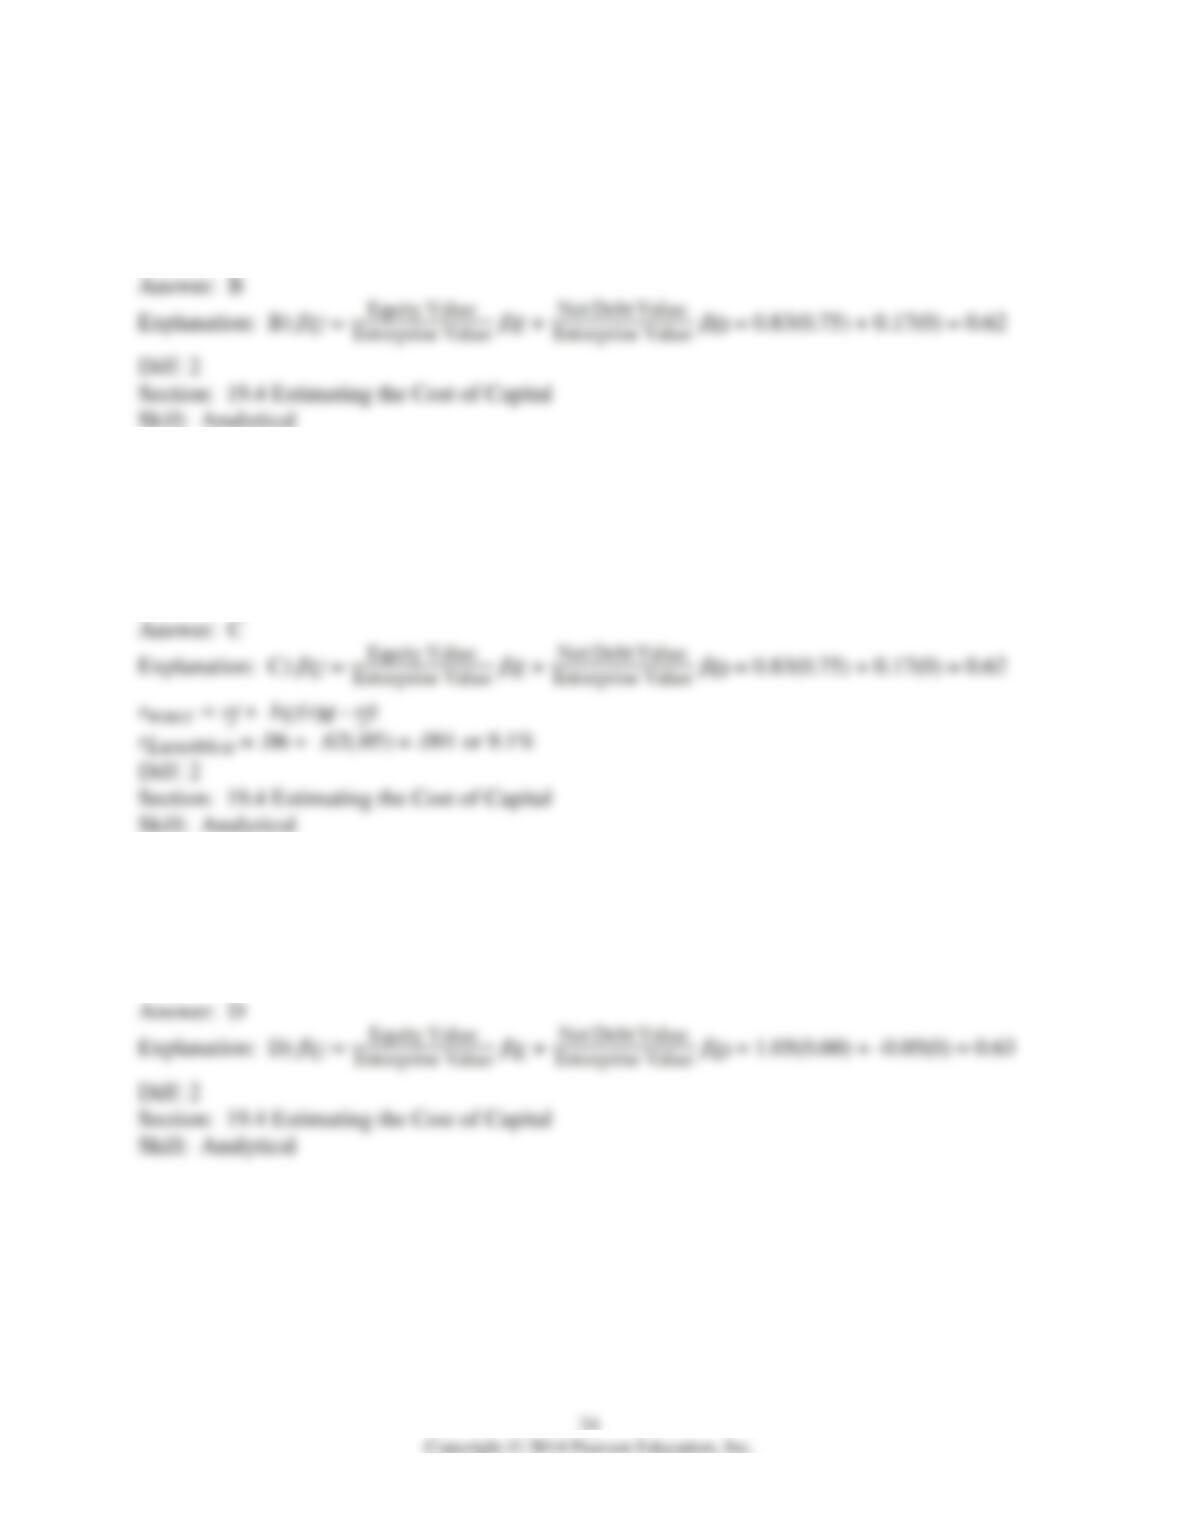
3) The unlevered beta for Luxottica is closest to:
A) 1.00
B) 0.60
C) 0.70
D) 1.50
4) If the risk-free rate of interest is 6% and the market risk premium has historically averaged
5%, then the cost of capital for Luxottica is closest to:
A) 10.2%
B) 13.5%
C) 9.1%
D) 14.7%
5) The unlevered beta for Nike is closest to:
A) 0.70
B) 1.00
C) 1.50
D) 0.60
6) If the risk-free rate of interest is 6% and the market risk premium has historically averaged
5%, then the cost of capital for Nike is closest to:
A) 14.7%
B) 10.2%
C) 9.1%
D) 13.5%
26
19.5 Valuing the Investment
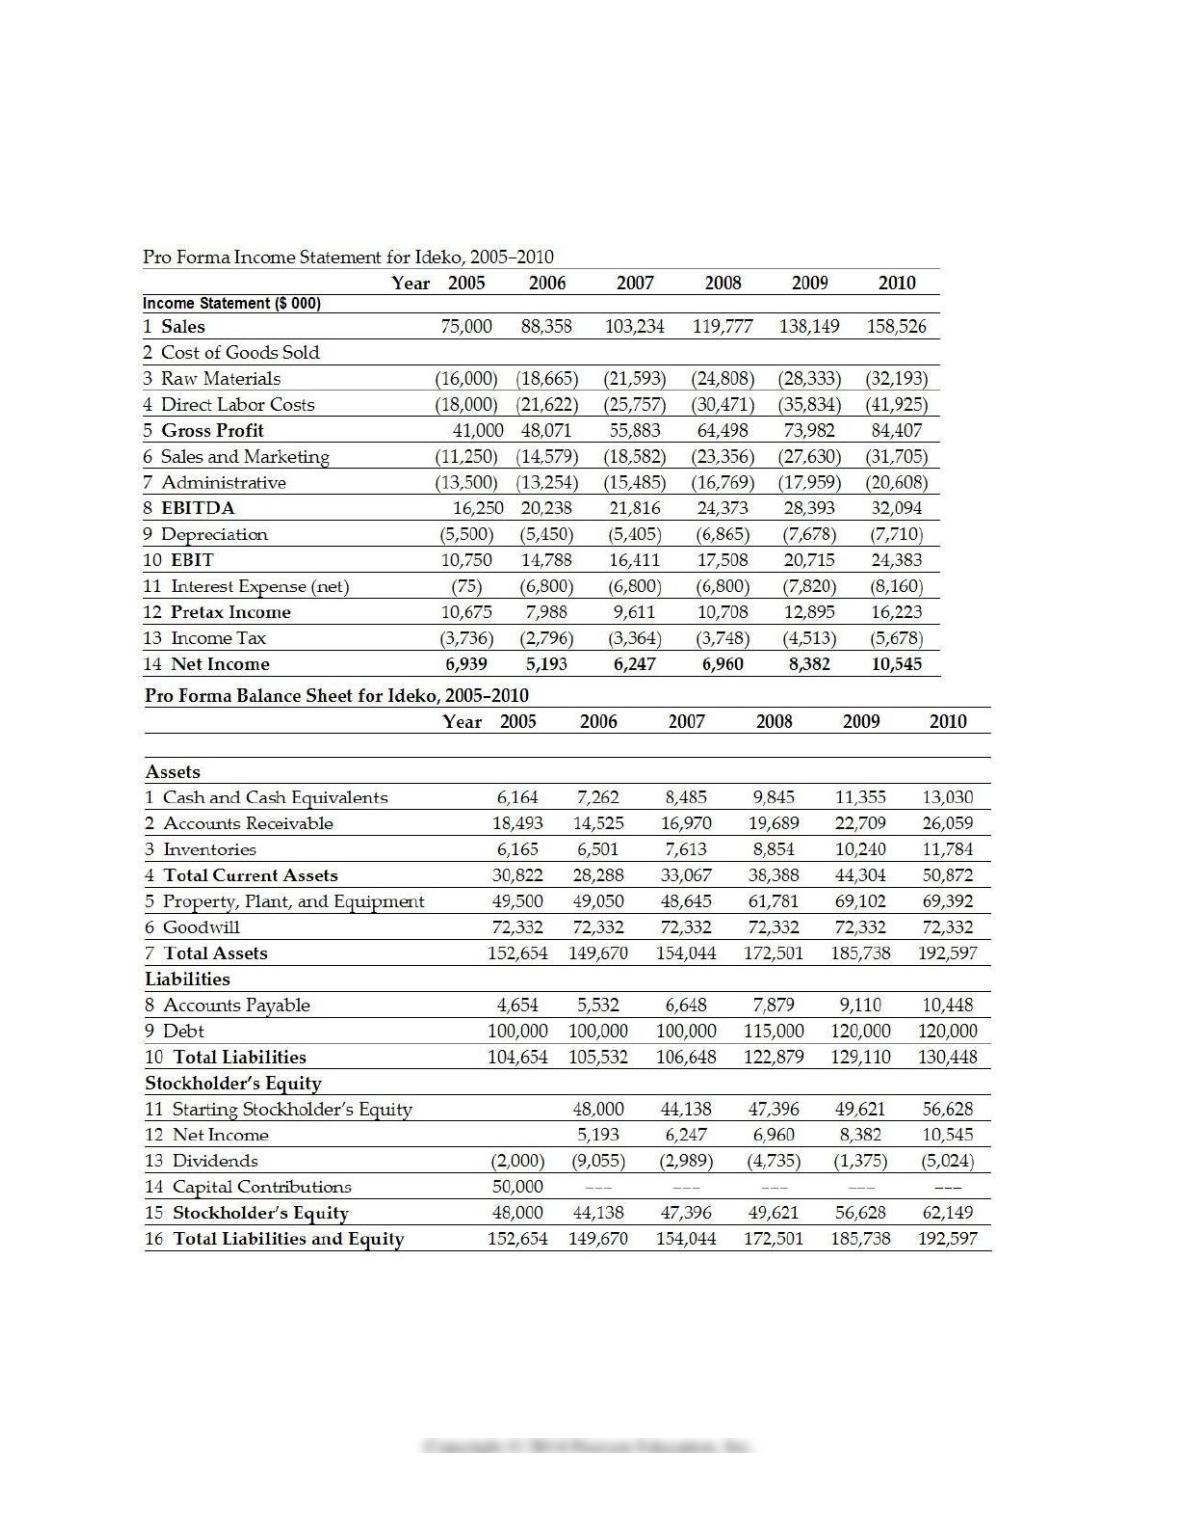
Use the following information to answer the question(s) below:
1) If Ideko’s future expected growth rate is 5%, then the estimated free cash flow for 2011 is
closest to:
A) 6,568
B) 11,151
C) 11,218
D) 12,137
2) If Ideko’s future expected growth rate is 5% and its WACC is 9%, then the continuation value
in 2010 is closest to:
A) 164,200
B) 278,775
C) 280,450
D) 303,425

28
Use the tables for the question(s) below.
Pro Forma Income Statement for Ideko, 2005-2010
Year 2005 2006 2007 2008 2009 2010
Income Statement ($ 000)
1 Sales 75,000 88,358 103,234 119,777 138,149 158,526
2 Cost of Goods Sold
3 Raw Materials (16,000) (18,665) (21,593) (24,808) (28,333) (32,193)
4 Direct Labor Costs (18,000) (21,622) (25,757) (30,471) (35,834) (41,925)
5 Gross Profit 41,000 48,071 55,883 64,498 73,982 84,407
6 Sales and Marketing (11,250) (14,579) (18,582) (23,356) (27,630) (31,705)
7 Administrative (13,500) (13,254) (15,485) (16,769) (17,959) (20,608)
8 EBITDA 16,250 20,238 21,816 24,373 28,393 32,094
9 Depreciation (5,500) (5,450) (5,405) (6,865) (7,678) (7,710)
10 EBIT 10,750 14,788 16,411 17,508 20,715 24,383
11 Interest Expense (net) (75) (6,800) (6,800) (6,800) (7,820) (8,160)
12 Pre-tax Income 10,675 7,988 9,611 10,708 12,895 16,223
13 Income Tax (3,736) (2,796) (3,364) (3,748) (4,513) (5,678)
14 Net Income 6,939 5,193 6,247 6,960 8,382 10,545
Pro Forma Balance Sheet for Ideko, 2005-2010
Year 2005 2006 2007 2008 2009 2010
Balance Sheet ($ 000)
Assets
1 Cash and Cash Equivalents 6,164 7,262 8,485 9,845 11,355 13,030
2 Accounts Receivable 18,493 14,525 16,970 19,689 22,709 26,059
3 Inventories 6,165 6,501 7,613 8,854 10,240 11,784
4 Total Current Assets 30,822 28,288 33,067 38,388 44,304 50,872
5 Property, Plant, and Equipment 49,500 49,050 48,645 61,781 69,102
69,392
6 Goodwill 72,332 72,332 72,332 72,332 72,332 72,332
7 Total Assets 152,654 149,670 154,044 172,501 185,738 192,597
Liabilities
8 Accounts Payable 4,654 5,532 6,648 7,879 9,110 10,448
9 Debt 100,000 100,000 100,000 115,000 120,000 120,000
10 Total Liabilities 104,654 105,532 106,648 122,879 129,110 130,448
Stockholder’s Equity
11 Starting Stockholder’s Equity 48,000 44,138 47,396 49,621
56,628
12 Net Income 5,193 6,247 6,960 8,382 10,545
13 Dividends (2,000) (9,055) (2,989) (4,735) (1,375) (5,024)
14 Capital Contributions 50,000 — — — — —
15 Stockholder’s Equity 48,000 44,138 47,396 49,621 56,628 62,149
16 Total Liabilities and Equity 152,654 149,670 154,044 172,501 185,738
192,597
3) Assuming that Ideko has a EBITDA multiple of 8.5, then the continuation enterprise value of
Ideko in 2010 is closest to:
A) $152.8 million
B) $272.8 million
C) $301.7 million
D) $181.7 million
4) Assuming that Ideko has a EBITDA multiple of 8.5, then the continuation equity value of
Ideko in 2010 is closest to:
A) $181.7 million
B) $272.8 million
C) $152.8 million
D) $301.7 million
5) Assuming that Ideko has a EBITDA multiple of 9.4, then the continuation enterprise value of
Ideko in 2010 is closest to:
A) $181.7 million
B) $152.8 million
C) $272.8 million
D) $301.7 million
6) Assuming that Ideko has a EBITDA multiple of 9.4, then the continuation equity value of
Ideko in 2010 is closest to:
A) $152.8 million
B) $181.7 million
C) $301.7 million
D) $272.8 million
7) Assuming that Ideko has a EBITDA multiple of 8.5, then the continuation EV/Sales ratio of
Ideko in 2010 is closest to:
A) 1.7
B) 1.9
C) 1.6
D) 1.8
8) Assuming that Ideko has a EBITDA multiple of 9.4, then the continuation EV/Sales ratio of
Ideko in 2010 is closest to:
A) 1.9
B) 1.7
C) 1.6
D) 1.8
9) Assuming that Ideko has a EBITDA multiple of 8.5, then the continuation unlevered P/E ratio
of Ideko in 2010 is closest to:
A) 17.6
B) 16.4
C) 14.5
D) 19.0
10) Assuming that Ideko has a EBITDA multiple of 9.4, then the continuation unlevered P/E
ratio of Ideko in 2010 is closest to:
A) 17.2
B) 16.4
C) 14.5
D) 19.4
11) Assuming that Ideko has a EBITDA multiple of 8.5, then the continuation levered P/E ratio
of Ideko in 2010 is closest to:
A) 19.0
B) 17.2
C) 16.4
D) 14.5
12) Assuming that Ideko has a EBITDA multiple of 9.4, then the continuation levered P/E ratio
of Ideko in 2010 is closest to:
A) 17.2
B) 14.5
C) 19.0
D) 16.4
19.6 Sensitivity Analysis
1) What is the purpose of the sensitivity analysis?