84. Exhibit 19-5
Ridgeline Corporation has the following operating data for the year:
Revenue
$1,125,000
Expenses
$ 850,000
Average total assets
$ 750,000
Average total liabilities
$ 475,000
Refer to Exhibit 19-5. Given the above data for Ridgeline Company, what is the profit margin assuming the minimum rate of return on assets is
10%?
85. Exhibit 19-5
Ridgeline Corporation has the following operating data for the year:
Revenue
$1,125,000
Expenses
$ 850,000
Average total assets
$ 750,000
Average total liabilities
$ 475,000
Refer to Exhibit 19-5. Given the above data for Ridgeline Company, what is the asset turnover assuming the minimum rate of return on assets is
10%?
86. Exhibit 19-5
Ridgeline Corporation has the following operating data for the year:
Revenue
$1,125,000
Expenses
$ 850,000
Average total assets
$ 750,000
Average total liabilities
$ 475,000
Refer to Exhibit 19-5. Given the above data for Ridgeline Company, what is the residual income assuming the minimum rate of return on assets is
10%?
87. Exhibit 19-6
Kentucky Corporation has the following operating data for 2011:
Net income
$ 255,000
Revenue
1,700,000
Total assets
1,360,000
Refer to Exhibit 19-6. Given the information above, Kentucky’s return on investment is:
88. Exhibit 19-6
Kentucky Corporation has the following operating data for 2011:
Net income
$ 255,000
Revenue
1,700,000
Total assets
1,360,000
Refer to Exhibit 19-6. Given the information above, if Kentucky’s net income increased to $306,000, the return on investment would be:
89. Frank Company, which has total assets of $300,000, has an opportunity to invest $80,000 in a new project
that will generate a return of $16,000 per year. Given this information, what is the return on this investment?
90. Frank Company, which has total assets of $300,000, has an opportunity to invest $80,000 in a new project
that will generate a return of $16,000 per year. Given this information, if Frank Company’s acceptable return on
investment is 22%, it will probably:
91. Frank Company, which has total assets of $300,000, has an opportunity to invest $80,000 in a new project
that will generate a return of $16,000 per year. Given this information, if Frank Company uses 15% as a
minimum rate of return, how much residual income will result from this project?
92. Frank Company, which has total assets of $300,000, has an opportunity to invest $80,000 in a new project
that will generate a return of $16,000 per year. Given this information, if Frank Company was earning 25%
before, then accepts this project, its new return on investment will be approximately:
93. The variance computed by comparing the standard costs at the budgeted activity level with the standard
costs at the actual activity level is:
94. The difference between the amount of money actually incurred for variable manufacturing overhead and the
amount that should have been incurred for the actual activity level achieved, measured in terms of direct labor
hours, is:
95. Comparing the standard variable manufacturing overhead costs based on standard hours with the standard
variable manufacturing overhead based on actual hours provides:
96. When direct labor is the best cost driver for variable manufacturing overhead, a favorable direct labor
efficiency variance would result in:
97. A variance that provides an opportunity for control over individual overhead items by highlighting the
differences between standard and actual costs is the:
98. Exhibit 19-7
The following figures represent 100% capacity for Starr Manufacturing:
Units produced
20,000
Direct labor hours expected
12,000
Variable manufacturing overhead costs
$36,000
Starr Manufacturing normally produces at 100% capacity. During the month of October, the company started and completed 10,000 units of product,
using variable manufacturing overhead costs of $20,000. The company used 6,400 direct labor hours in October instead of the 6,000 hours expected
for the activity level achieved.
Refer to Exhibit 19-7. Based on the information above, the overhead rate used to apply variable manufacturing overhead to Work–in-Process is:
99. Exhibit 19-7
The following figures represent 100% capacity for Starr Manufacturing:
Units produced
20,000
Direct labor hours expected
12,000
Variable manufacturing overhead costs
$36,000
Starr Manufacturing normally produces at 100% capacity. During the month of October, the company started and completed 10,000 units of product,
using variable manufacturing overhead costs of $20,000. The company used 6,400 direct labor hours in October instead of the 6,000 hours expected
for the activity level achieved.
Refer to Exhibit 19-7. Based on the information above, the standard variable manufacturing overhead cost in terms of actual direct labor hours is:
100. Exhibit 19-7
The following figures represent 100% capacity for Starr Manufacturing:
Units produced
20,000
Direct labor hours expected
12,000
Variable manufacturing overhead costs
$36,000
Starr Manufacturing normally produces at 100% capacity. During the month of October, the company started and completed 10,000 units of product,
using variable manufacturing overhead costs of $20,000. The company used 6,400 direct labor hours in October instead of the 6,000 hours expected
for the activity level achieved.
Refer to Exhibit 19-7. Based on the information above, the standard variable manufacturing overhead cost in terms of standard direct labor hours is:
101. Exhibit 19-7
The following figures represent 100% capacity for Starr Manufacturing:
Units produced
20,000
Direct labor hours expected
12,000
Variable manufacturing overhead costs
$36,000
Starr Manufacturing normally produces at 100% capacity. During the month of October, the company started and completed 10,000 units of product,
using variable manufacturing overhead costs of $20,000. The company used 6,400 direct labor hours in October instead of the 6,000 hours expected
for the activity level achieved.
Refer to Exhibit 19-7. Based on the information above, the variable manufacturing overhead applied to Work-in-Process Inventory is:
102. Exhibit 19-7
The following figures represent 100% capacity for Starr Manufacturing:
Units produced
20,000
Direct labor hours expected
12,000
Variable manufacturing overhead costs
$36,000
Starr Manufacturing normally produces at 100% capacity. During the month of October, the company started and completed 10,000 units of product,
using variable manufacturing overhead costs of $20,000. The company used 6,400 direct labor hours in October instead of the 6,000 hours expected
for the activity level achieved.
Refer to Exhibit 19-7. Based on the information above, the variable manufacturing overhead spending variance is:
103. Exhibit 19-7
The following figures represent 100% capacity for Starr Manufacturing:
Units produced
20,000
Direct labor hours expected
12,000
Variable manufacturing overhead costs
$36,000
Starr Manufacturing normally produces at 100% capacity. During the month of October, the company started and completed 10,000 units of product,
using variable manufacturing overhead costs of $20,000. The company used 6,400 direct labor hours in October instead of the 6,000 hours expected
for the activity level achieved.
Refer to Exhibit 19-7. Based on the information above, the manufacturing overhead efficiency variance is:
104. Exhibit 19-8
The following information is available for Granger Company:
Standard variable manufacturing overhead rate per direct labor hour
$7.00
Actual variable manufacturing overhead
$60,000
Standard direct labor hours for output produced
11,000
Actual direct labor hours worked
10,000
Refer to Exhibit 19-8. Given the information above, the variable manufacturing overhead spending variance is:
105. Exhibit 19-8
The following information is available for Granger Company:
Standard variable manufacturing overhead rate per direct labor hour
$7.00
Actual variable manufacturing overhead
$60,000
Standard direct labor hours for output produced
11,000
Actual direct labor hours worked
10,000
Refer to Exhibit 19-8. Given the information above, the variable manufacturing overhead efficiency variance is:
106. The following information is available for the Ringo Corporation:
Actual direct labor hours for March
6,000
Standard direct labor hours for March
7,000
Actual units produced in March
3,000
Estimated variable manufacturing overhead for the year
$140,000
Estimated direct labor hours for the year
70,000
Normal yearly capacity
30,000
The amount of variable manufacturing overhead applied to Work-in-Process Inventory in March would be:
D. $56,000
107. Determine the appropriate variable manufacturing overhead rate using the following information:
Annual expected manufacturing overhead costs
$910,000
Annual expected variable manufacturing overhead costs
$360,000
Annual units to be produced
30,000
Annual standard direct labor hours expected
60,000
108. Exhibit 19-9
The following data is known for Lyman, Inc.:
Budgeted variable manufacturing overhead
$108,000
Budgeted fixed manufacturing overhead
$324,000
Budgeted production
36,000 units
Budgeted direct labor hours
54,000 units
Budgeted direct labor hours per unit
1.5 hours
Actual variable manufacturing overhead
$136,500
Actual fixed manufacturing overhead
$296,000
Actual production
40,000 units
Actual direct labor hours
65,000
Standards:
Variable manufacturing overhead:
1.5 direct labor hours ´ $2 = $3 per unit
Fixed manufacturing overhead:
1.5 direct labor hours ´ $6 = $9 per unit
Refer to Exhibit 19-9. Using the information above, compute the variable manufacturing overhead spending variance for Lyman, Inc.
109. Exhibit 19-9
The following data is known for Lyman, Inc.:
Budgeted variable manufacturing overhead
$108,000
Budgeted fixed manufacturing overhead
$324,000
Budgeted production
36,000 units
Budgeted direct labor hours
54,000 units
Budgeted direct labor hours per unit
1.5 hours
Actual variable manufacturing overhead
$136,500
Actual fixed manufacturing overhead
$296,000
Actual production
40,000 units
Actual direct labor hours
65,000
Standards:
Variable manufacturing overhead:
1.5 direct labor hours ´ $2 = $3 per unit
Fixed manufacturing overhead:
1.5 direct labor hours ´ $6 = $9 per unit
Refer to Exhibit 19-9. Using the information above, compute the variable manufacturing overhead efficiency variance for Lyman, Inc.
110. Which of the following is a component of the fixed manufacturing overhead budget variance and the
volume variance?
111. Which variance is NOT considered to be an input variance?
112. Which of the following would NOT be part of total over- or underapplied manufacturing overhead?
113. If the actual amount spent for fixed manufacturing overhead is greater than the budgeted amount, the result
is:
114. If the actual amount spent for fixed manufacturing overhead is less than the budgeted amount, the result
is:
115. If the budgeted amount for fixed manufacturing overhead is greater than the standard hours allowed for the
actual output times the standard rate, the result is:
116. If the budgeted amount for fixed manufacturing overhead is less than the standard hours allowed for the
actual output times the standard rate, the result is:
117. Exhibit 19-10
The following information is given for Roe Company:
Actual fixed manufacturing overhead
$200,000
Budgeted fixed manufacturing overhead
$190,000
Actual production
600
Budgeted production
500
Standard direct labor hour per unit
4
Fixed manufacturing overhead is applied to production based on direct labor hours.
Refer to Exhibit 19-10. Using the data above, compute the fixed manufacturing overhead budget variance.
118. Exhibit 19-10
The following information is given for Roe Company:
Actual fixed manufacturing overhead
$200,000
Budgeted fixed manufacturing overhead
$190,000
Actual production
600
Budgeted production
500
Standard direct labor hour per unit
4
Fixed manufacturing overhead is applied to production based on direct labor hours.
Refer to Exhibit 19-10. Using the data above, compute the volume variance.
119. Medina Sports manufactures snowboards. Medina had budgeted 25 direct labor hours per unit and
projected that 2,120 units would be produced. The budgeted fixed manufacturing overhead costs were
$530,000. The actual overhead costs for the year were $544,000 and 2,150 units were produced. What is the
fixed overhead budget variance?
120. Medina Sports manufactures snowboards. Medina had budgeted 12.5 direct labor hours per unit and
projected that 2,120 units would be produced. The budgeted fixed manufacturing overhead costs were
$530,000. The actual overhead costs for the year were $544,000 and 2,150 units were produced. What is the
volume variance?
121. Exhibit 19-11
The following data is known for Carlin, Inc.:
Budgeted variable manufacturing overhead
$ 54,000
Budgeted fixed manufacturing overhead
$162,000
Budgeted production
18,000 units
Budgeted direct labor hours
27,000 units
Budgeted direct labor hours per unit
1.5 hours
Actual variable manufacturing overhead
$ 68,250
Actual fixed manufacturing overhead
$148,000
Actual production
20,000 units
Actual direct labor hours
32,500
Standards:
Variable manufacturing overhead:
1.5 direct labor hours ´ $2 = $3 per unit
Fixed manufacturing overhead:
1.5 direct labor hours ´ $6 = $9 per unit
Refer to Exhibit 19-11. Using the information above, compute the fixed manufacturing overhead budget variance for Carlin, Inc.
122. Exhibit 19-11
The following data is known for Carlin, Inc.:
Budgeted variable manufacturing overhead
$ 54,000
Budgeted fixed manufacturing overhead
$162,000
Budgeted production
18,000 units
Budgeted direct labor hours
27,000 units
Budgeted direct labor hours per unit
1.5 hours
Actual variable manufacturing overhead
$ 68,250
Actual fixed manufacturing overhead
$148,000
Actual production
20,000 units
Actual direct labor hours
32,500
Standards:
Variable manufacturing overhead:
1.5 direct labor hours ´ $2 = $3 per unit
Fixed manufacturing overhead:
1.5 direct labor hours ´ $6 = $9 per unit
Refer to Exhibit 19-11. Using the information above, compute the volume variance for Carlin, Inc.
123. Sequim Company is a decentralized company with two segments: Micro and Macro. Additionally, for each
segment, Sequim’s sales are split between the two states of Oregon and Washington. The following is
information applicable to revenue for the year:
Budget
Actual
Micro – Oregon
$400,000
$375,000
Micro – Washington
250,000
290,000
Macro – Oregon
200,000
265,000
Macro – Washington
175,000
125,000
a.
Prepare a responsibility accounting report for the head of the Micro division. Show whether each variance is favorable or unfavorable.
b.
Prepare a responsibility accounting report for the two operating segments, a detailed breakdown by geographic area is not required.
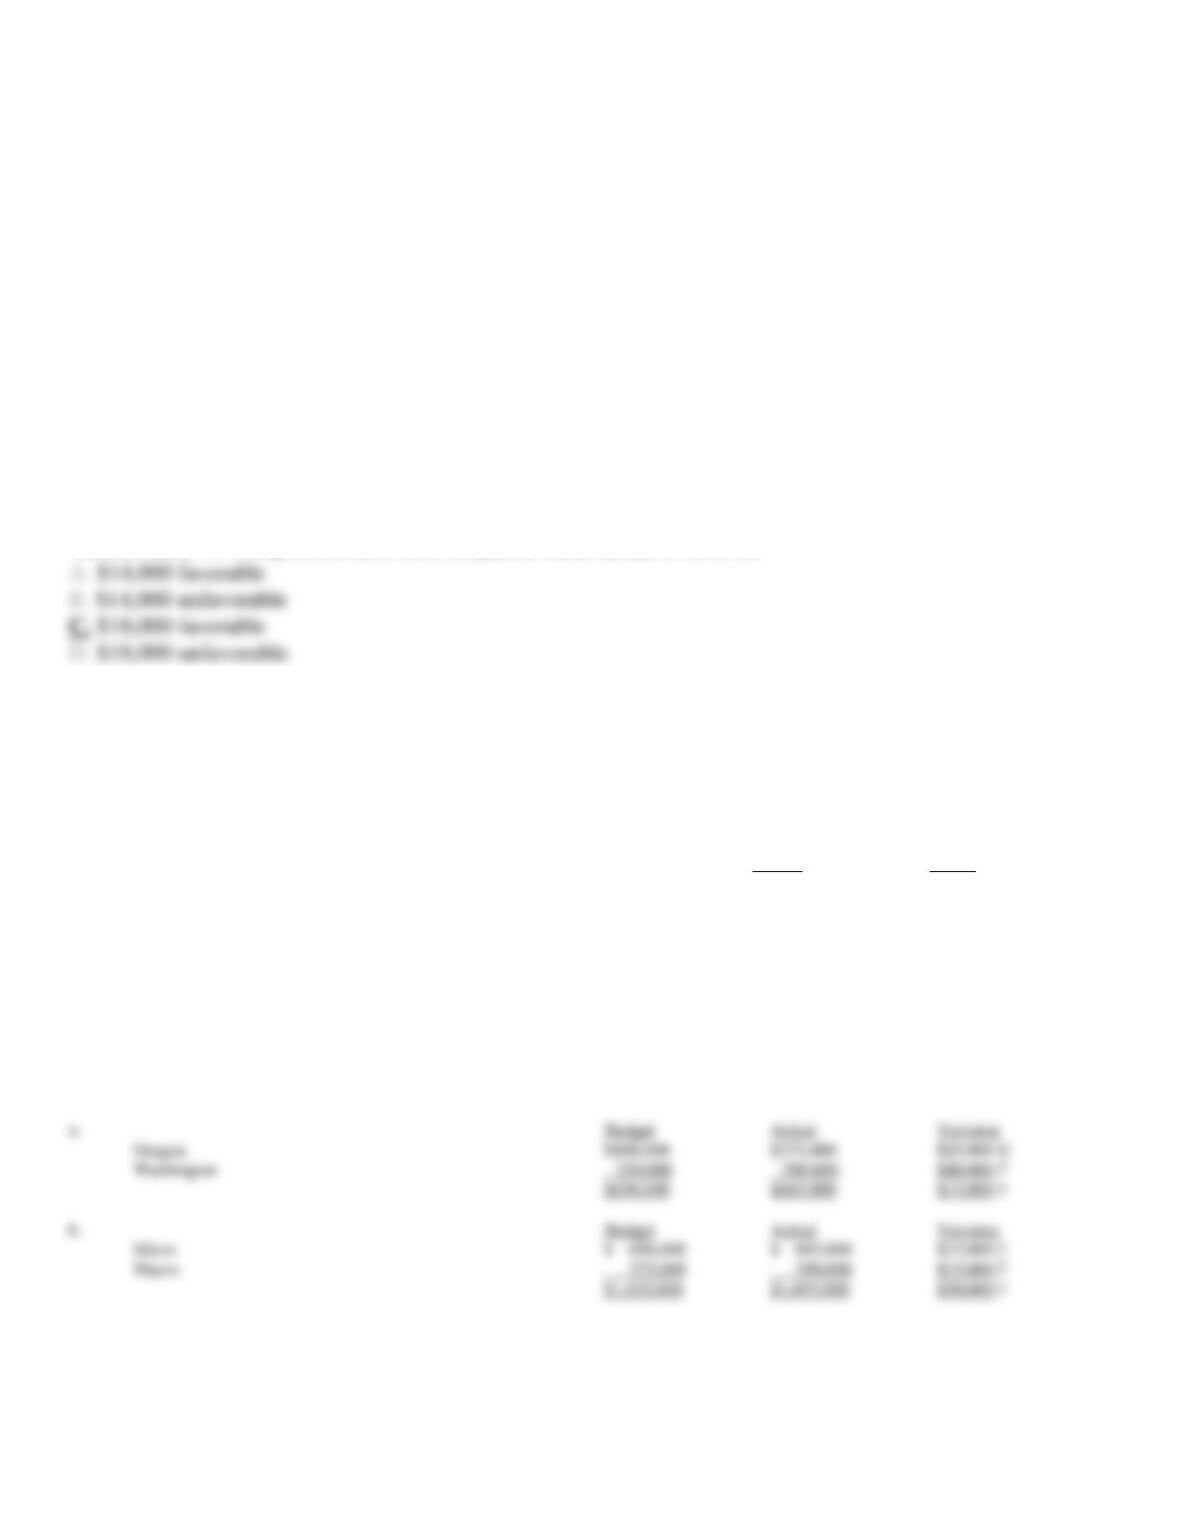
Budget
Actual
Variance
Oregon
$400,000
$375,000
$25,000 U
Washington
250,000
290,000
$40,000 F
$650,000
$665,000
$15,000 F
b.
Budget
Actual
Variance
Micro
$ 650,000
$ 665,000
$15,000 F
Macro
375,000
390,000
$15,000 F
$1,025,000
$1,055,000
$30,000 F
124. Piedmont Company incurred the following actual costs for direct materials during July:
Direct materials purchased: 40,000 pounds at $3.20 per pound
$128,000
Direct materials used: 37,000 pounds at $3.20 per pound
118,400
During July, the company produced 2,000 units of its product. The standard costs for direct materials have been established as follows:
Standard direct material cost per unit:
20 pounds at $3 per pound
Total standard direct materials cost for July:
2,000 units ´ 20 pounds ´ $3 per pound
a.
Compute the materials price and quantity variances for Piedmont Company for the month of July. The price variance is determined when
the materials are purchased.
b.
Prepare the journal entries to record the materials price variance when the materials are purchased and the materials quantity variance
when the materials are used.
125. The Clarke Manufacturing Company collected the following information for the month of July:
Standard production
70,000
units
Actual production
68,000
units
Standard materials per unit
3
pounds
Materials purchased and used in July
200,600
pounds
Standard price for material
$0.60
per pound
Actual price for material
$0.58
per pound
a.
Compute the materials price and quantity variances for July.
b.
Prepare journal entries for the purchase and use of materials.
a.
Materials price variance:
($3.20 – $3.00) – 40,000 lbs. = $8,000 U
Materials quantity variance:
(37,000 lbs. used – $40,000 standard pounds) ´ $3 =
Direct Materials Inventory
120,000
Materials Price Variance
8,000
Cash (or Accounts Payable)
120,000
Materials Quantity Variance
Direct Materials Inventory
126. Kahlotus Company uses standard costs and a flexible budget for controlling its service activities. In March,
the company serviced 11,000 units of its product using 30,000 actual direct labor hours. The actual hourly rate
was $19.00. Three direct labor hours is the standard allowance for servicing one unit of product. The standard
labor rate is $19.50 per hour.
a.
Compute the rate and efficiency variances for direct labor.
b.
Prepare a journal entry to record the variances in the accounting records.
Labor rate variance:
Labor efficiency variance:
b.
643,500
Labor Rate Variance
15,000
Labor Efficiency Variance
58,500
Salaries and Wages Payable
570,000
127. To produce one unit of PL734 requires 1.5 direct labor hours at a standard cost of $15.00 per hour. During
the month of April, 41,000 units were produced using 63,450 direct labor hours of labor at a cost of $926,370.
a.
Compute the labor rate and labor efficiency variances.
b.
Prepare a journal entry to record the use of direct labor.
b.
Direct Materials Inventory
120,360
Materials Price Variance
4,012
Accounts Payable
116,348
122,400
Materials Quantity Variance
2,040
Direct Materials Inventory
120,360
128. The MEC Company has two divisions: the Computer division and the Printer division. Cost and revenue
information for the two divisions for the year 2011 is as follows:
Computer
Printer
Division
Division
Revenue
$1,100,000
$750,000
Fixed costs:
Costs unique to each division
450,000
375,000
Costs allocated by corporate headquarters
50,000
70,000
Variable cost per unit
7
6
Unit sales of each division’s product
75,000
52,000
Prepare a segment margin statement showing each division’s contribution and segment margins and the overall company profit.
Overall
Computer
Printer
Company
Division
Division
Sales revenue
$1,850,000
$1,100,000
$750,000
Variable costs
837,000
525,000
312,000
Contribution margin
$1,013,000
$ 575,000
$438,000
Controllable fixed costs
825,000
450,000
375,000
Segment margin
$ 188,000
$ 125,000
$ 63,000
Company indirect costs
120,000
Net income
$ 68,000
129. StoneWorks is a company that sells tile. It has three profit centers: ceramic, stone and granite. Financial
information for the three centers for the year just ended follows:
Ceramic
Stone
Granite
Revenue
$100,000
$125,000
$150,000
Fixed costs:
Costs unique to the profit center
30,000
45,000
64,000
Costs allocated by the retail store
6,000
7,000
8,000
Variable costs as a percentage of sales
40%
60%
64%
$29,250 U
922,500
Labor Efficiency Variance
29,250
Labor Rate Variance
Wages Payable
a.
Calculate each profit center’s contribution and segment margins and overall company profits.
b.
Which center, if any, should be discontinued?
130. The following information relates to Spangle Industries:
Expected unit sales
435
Expected unit sales price
$135
Expected market sales
5,400
Actual unit sales
450
Actual unit sales price
$150
Actual market sales
5,364
Sales price variance:
($150 – $135) ´ 450 units = $6,750 F
Sales volume variance:
(450 actual units – 435 expected units) ´ $135 = $2,025 F
131. Compute the missing data items, (a) through (f), in the following table:
Division X
Division Y
Revenue
$345,000
$287,500
Net income
$ 69,000
$ 57,500
Total assets
(a) ______
$143,750
Profit margin ratio
(b) ______
(d) ______
Assets turnover ratio
(c) ______
(e) ______
ROI
10%
(f) ______
a.
$69,000 / 10% = $690,000
a.
Entire
Company
Ceramic
Stone
Granite
Revenue
$375,000
$100,000
$125,000
$150,000
Variable costs
211,000
40,000
75,000
96,000
Contribution margin
$164,000
$ 60,000
$ 50,000
$ 54,000
Fixed costs unique to
the center
139,000
30,000
45,000
64,000
Segment margin
$ 25,000
$ 30,000
$ 5,000
$(10,000)
Allocated fixed costs
21,000
Net income
$ 4,000
132. The following information has been gathered from the accounting department at a local grocery store:
Net income
$ 180,000
Net sales revenue
750,000
Total assets:
2011
1,200,000
2012
1,400,000
Cost of goods sold
350,000
What is the return on investment and profit margin on sales for the local grocer?
133. Given the following information, if the minimum rate of return on average total assets is 15%, what is the
residual income?
Total assets
$887,500
Net income
225,000
Net income
$225,000
Residual income
$ 91,875
134. Matsuma Manufacturing Company uses standard direct labor hours to apply variable manufacturing
overhead to Work-in-Process Inventory. The following data were taken from the records:
June:
Budgeted units
20,000
Budgeted hours
5,000
Actual variable manufacturing overhead
$ 48,500
Actual units produced
19,500
Actual direct labor hours
5,100
Annual variable
manufacturing
overhead data:
Estimated variable costs
$500,000
Estimated direct labor hours
50,000
Estimated units of production
12,500
a.
Compute the annual variable manufacturing overhead rate to be used to apply variable manufacturing overhead to Work–in-Process
Inventory.
b.
Compute the variable manufacturing overhead spending variance for June.
c.
Compute the variable manufacturing overhead efficiency variance for June.
Return on investment:
$180,000 / [($1,200,000 + $1,400,000) / 2] = 13.85%
Profit margin on sales:
$180,000 / $750,000 = 24%
135. Circle Corporation’s president would like to have an analysis of variable and fixed manufacturing overhead
costs budgeted and incurred for the month of August. Three machine hours per unit is the standard allowed for
machine hours and 15,500 units were projected to be produced in August. Budgeted variable and fixed
manufacturing overhead costs for the month were $93,000 and $186,000, respectively. During August, 49,000
machine hours were actually used to produce 17,500 units of product. Actual variable and fixed manufacturing
overhead for the month were $112,000 and $194,000, respectively.
a.
Compute the variable manufacturing overhead spending and efficiency variances for the month of August.
b.
Compute the fixed overhead budget variance and the volume variance for the month of August.
Actual variable manufacturing overhead
Predicted costs based on actual machine hours (49,000 ´ $2*)
Variable manufacturing overhead spending variance
Predicted costs based on actual machine hours (49,000 ´ $2*)
Applied costs based on standard hours allowed
(52,500** ´ $2*)
Variable manufacturing overhead efficiency variance
Fixed overhead budget variance:
Actual fixed manufacturing overhead
Budgeted fixed manufacturing overhead
Fixed overhead budget variance
Volume variance:
Budgeted fixed manufacturing overhead
Volume variance
Expected production output (15,500 ´ $12*)
210,000
15,500 units = $12 per unit
(5,100 hours ´ $10) – (5,000 hours ´ $10) = $1,000 U
136. The following information is given for Reardan Company:
Actual fixed manufacturing overhead
$500,000
Budgeted fixed manufacturing overhead
$475,000
Actual production
1,500
Budgeted production
1,250
Standard direct labor hour per unit
10
Fixed manufacturing overhead is applied to production based on direct labor hours.
137. Lake Stevens Manufacturing Company uses a standard cost system. After actual manufacturing costs have
been recorded and manufacturing overhead has been applied, there is a credit balance of $5,000 in the
manufacturing overhead account. Variances were as follows:
Variable overhead spending variance
$ 5,550 U
Variable overhead efficiency variance
$12,250 F
Fixed overhead budget variance
$ 8,400 U
Volume variance
$ 6,700 F
Overhead
Volume Variance
Variable Overhead Efficiency Variance
12,250
Compute the fixed manufacturing overhead budget variance.
b.
Compute the volume variance.
Fixed overhead budget variance: $500,000 – $475,000 = $25,000 U
b.
Budgeted hours: 1,250 units ´ 10 hours = 12,500 hours
Fixed manufacturing overhead application rate: $475,000 ¸ 12,500 = $38
Hours allowed for actual production: 1,500 units ´ 10 hours = 15,000 hours
Volume variance: (15,000 allowed hours – 12,500 budgeted hours) ´ $38 = $95,000 F
Alternative computation:
Standard fixed manufacturing overhead rate: $475,000 ¸ 1,250 units = $380
Volume variance: (1,500 actual units – 1,250 budgeted units) ´ $380 = $95,000 F