Page 1
1.
Dorothy is trying to decide how to allocate her time between work and leisure. Suppose
that she can work a maximum of 75 hours per week. If she can earn $15 per hour, the
vertical intercept of her time allocation budget line (with income plotted vertically and
leisure plotted horizontally) is:
A)
$15.
B)
75 hours.
C)
5.
D)
$1,125.
2.
Consider the time allocation budget line for Priya. Put hours of leisure on the horizontal
axis and income on the vertical axis. If Priya can allocate 100 hours per week to either
leisure or work and her wage per hour is $18, then the vertical intercept is _____ and the
slope of the time allocation budget line is _____.
A)
$180; 18
B)
$1,800; 18
C)
$1,800; –18
D)
$720; 18
3.
Miss Marple spends her entire leisure time gardening. She values the marginal utility of
the last hour spent gardening at $17. She could earn $20 if she worked an additional
hour. Assuming that Miss Marple wants to maximize her utility, which of the following
is CORRECT?
A)
She should spend more time gardening and less time working to balance the stress
of work with the relaxation provided by a hobby.
B)
She should spend more time gardening and less time working, since leisure
activities are usually characterized by increasing marginal utility.
C)
She should reallocate her time away from gardening and toward more work.
D)
This question cannot be answered without knowing how many hours she spends
working and how many hours she spends gardening.
4.
Kurt earns a wage of $100 per hour; Jim earns a wage of $10 per hour. To maximize
utility, Kurt works 45 hours per week and Jim works 50 hours per week. The value of an
additional hour of leisure is:
A)
higher for Jim than for Kurt.
B)
higher for Kurt than for Jim.
C)
less than $100 for Kurt.
D)
greater than $10 for Jim.
Page 2
5.
The time allocation budget line shows an individual’s _____ and the income that allows
consumption of marketed goods.
A)
preferences for leisure
B)
trade-offs between the consumption of leisure
C)
labor supply for the consumption of leisure
D)
indifference between the consumption of leisure
6.
Javon has 80 hours per week to allocate between labor and leisure. Graph hours of
leisure per week on the horizontal axis and income per week on the vertical axis. If
Javon’s hourly wage is $8, then the vertical intercept of his time allocation budget line
is:
A)
$8.
B)
$640.
C)
40 hours.
D)
80 hours.
7.
Javon has 80 hours per week to allocate between labor and leisure. Graph hours of
leisure per week on the horizontal axis and income per week on the vertical axis. If
Javon’s hourly wage is $8, then the horizontal intercept of his time allocation budget line
is:
A)
$8.
B)
$640.
C)
40 hours.
D)
80 hours.
8.
Javon has 80 hours per week to allocate between labor and leisure. Graph hours of
leisure per week on the horizontal axis and income per week on the vertical axis. If
Javon’s hourly wage is $8, then the opportunity cost of an hour of leisure is:
A)
$8.
B)
$10.
C)
$640.
D)
$800.
9.
Javon has 80 hours per week to allocate between labor and leisure. Javon’s wage is $8
per hour. Graph hours of leisure per week on the horizontal axis and income per week
on the vertical axis. According to the optimal time allocation rule, Javon should allocate
his time such that the marginal utility of an additional hour of leisure is:
A)
$8.
B)
$10.
C)
$640.
D)
$800.
Page 3
Use the following to answer questions 10-11:
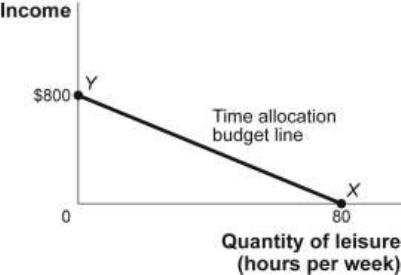
Figure: The Time Allocation Budget Line
10.
(Figure: The Time Allocation Budget Line) Look at the figure The Time Allocation
Budget Line. If the wage rate rises, then the time allocation budget line will rotate
_____ along the _____ axis.
A)
left; leisure
B)
up; income
C)
right; leisure
D)
down; income
11.
(Figure: The Time Allocation Budget Line) Look at the figure The Time Allocation
Budget Line. If the wage rate decreases, then the time allocation budget line will rotate
_____ along the _____ axis.
A)
left; leisure
B)
up; income
C)
right; leisure
D)
down; income
12.
During the holiday season some people take a second job or work more hours. From this
we know that:
A)
the income effect becomes more powerful than the substitution effect during the
holiday season.
B)
the substitution effect becomes more powerful than the income effect during the
holiday season.
C)
the income and substitution effects cancel each other out during the holiday season.
D)
people want to spend more time with their family during the holiday season.
Page 4
13.
Diana’s labor supply curve changes slope and begins to bend backward at a wage of
$44. Thus, for a wage _____ $44, the substitution effect of a wage increase will _____.
A)
above; cause Diana to work fewer hours
B)
below; cause Diana to work fewer hours
C)
below; dominate the income effect
D)
above; cause Diana to work more hours
14.
If the labor supply curve bends backward, then the backward-bending portion reveals
that _____ is a(n) _____ good and the _____ effect is greater than the _____ effect.
A)
labor; normal; income; substitution
B)
labor; inferior; substitution; income
C)
leisure; normal; income; substitution
D)
leisure; inferior; substitution; income
15.
If an individual’s labor supply curve is upward-sloping at low wage rates and
downward-sloping at high wage rates, then at higher wage rates:
A)
there is no substitution effect as wages change.
B)
there is no income effect as wages change.
C)
the income effect dominates the substitution effect.
D)
the substitution effect dominates the income effect.
16.
An increase in the wage rate will:
A)
normally generate a small income effect.
B)
generate a significant decrease in after-tax income.
C)
possibly lead people to choose more leisure rather than work more, since leisure is
a normal good.
D)
cause businesses to increase the number of employees to reduce costs.
17.
An individual will allocate time between labor and leisure by finding the point at which:
A)
he or she maximizes utility while remaining beneath the time allocation budget
line.
B)
the time allocation budget line is just tangent to an indifference curve.
C)
he or she reaches the lowest possible indifference curve while still on the time
allocation budget line.
D)
he or she is indifferent between work and leisure.
Page 5
18.
Assume Alex is maximizing utility by working 51 hours per week and his wage is $15
per hour. Which of the following statements is CORRECT?
A)
In equilibrium, the value of an additional hour of leisure for Alex is less than $15.
B)
Alex is probably not on the highest indifference curve that touches the time
allocation budget line.
C)
The marginal utility Alex gets from the extra money he earns from an additional
hour spent working is equal to the marginal utility of an additional hour of leisure.
D)
In equilibrium, the value of an additional hour of leisure for Alex is more than $15.
Use the following to answer questions 19-21:
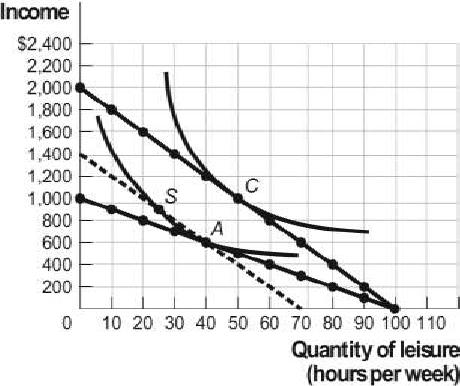
Figure: Income and Leisure Opportunities
19.
(Figure: Income and Leisure Opportunities) The figure Income and Leisure
Opportunities refers to Keisha when she has 100 hours per week for working or leisure.
There are two time allocation lines, one for a $10 hourly wage rate and one for a $20
hourly wage rate. Keisha’s optimal choice is point A when the wage is $10, and her
optimal choice is point C when the wage is $20. As the amount she earns increases from
$10 to $20 per hour, Keisha will work _____ hours because of the substitution effect.
A)
10 fewer
B)
15 more
C)
25 fewer
D)
50 more
Page 6
20.
(Figure: Income and Leisure Opportunities) The figure Income and Leisure
Opportunities refers to Keisha when she has 100 hours per week for working or leisure.
There are two time allocation lines, one for a $10 hourly wage rate and one for a $20
hourly wage rate. Keisha’s optimal choice is point A when the wage is $10, and her
optimal choice is point C when the wage is $20. As the amount she earns increases from
$10 per hour to $20 per hour, Keisha will work _____ hours because of the income
effect.
A)
10 fewer
B)
15 more
C)
25 fewer
D)
50 more
21.
(Figure: Income and Leisure Opportunities) Given Keisha’s preferences and
opportunities for income and leisure shown in the figure Income and Leisure
Opportunities, Keisha sees leisure as:
A)
a normal good.
B)
an inferior good.
C)
a complement to working.
D)
The answer is impossible to determine with the information given.
Use the following to answer questions 22-25:
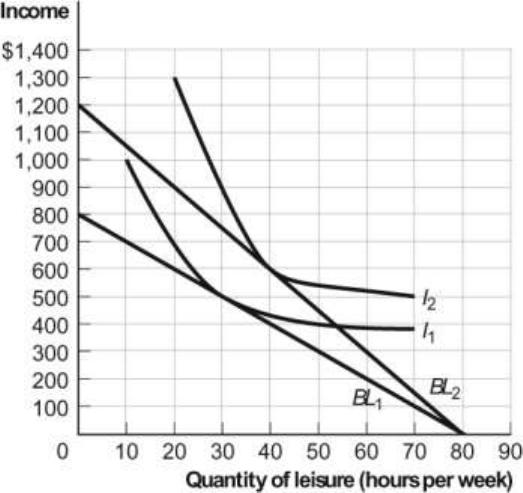
Figure: Davina’s Labor Supply Choice
Page 7
22.
(Figure: Davina’s Labor Supply Choice) The figure Davina’s Labor Supply Choice
shows Davina’s time allocation budget line when her hourly wage is $10 or $15 and she
has 80 hours to allocate between labor and leisure; it also shows two of her indifference
curves for income and leisure. When Davina earns $10 per hour, she works _____ hours
and enjoys _____ hours of leisure.
A)
20; 60
B)
30; 50
C)
40; 40
D)
50; 30
23.
(Figure: Davina’s Labor Supply Choice) The figure Davina’s Labor Supply Choice
shows Davina’s time allocation budget line when her hourly wage is $10 or $15 and she
has 80 hours to allocate between labor and leisure; it also shows two of her indifference
curves for income and leisure. When Davina earns $15 per hour, she works _____ hours
and enjoys _____ hours of leisure.
A)
20; 60
B)
30; 50
C)
40; 40
D)
50; 30
24.
(Figure: Davina’s Labor Supply Choice) The figure Davina’s Labor Supply Choice
shows Davina’s time allocation budget line when her hourly wage is $10 or $15 and she
has 80 hours to allocate between labor and leisure; it also shows two of her indifference
curves for income and leisure. Davina’s labor supply curve is _____ as her hourly wage
rises from $10 to $15.
A)
upward-sloping
B)
downward-sloping
C)
vertical
D)
horizontal
25.
(Figure: Davina’s Labor Supply Choice) The figure Davina’s Labor Supply Choice
shows Davina’s time allocation budget line when her hourly wage is $10 or $15 and she
has 80 hours to allocate between labor and leisure; it also shows two of her indifference
curves for income and leisure. As Davina’s hourly wage rises from $10 to $15:
A)
the income effect is greater than the substitution effect.
B)
the substitution effect is greater than the income effect.
C)
the substitution effect is equal to the income effect.
D)
It is impossible to compare the income and substitution effect.
Page 8
Use the following to answer questions 26-30:
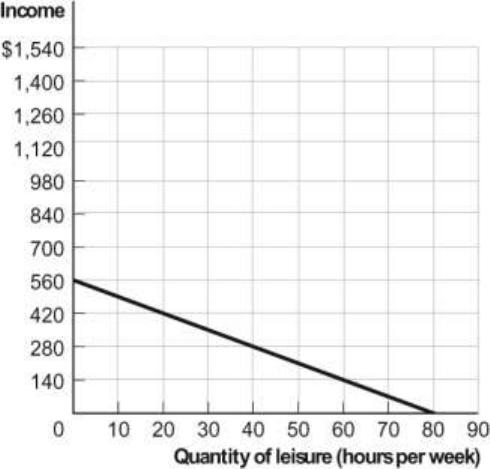
Figure: Rita’s Time Allocation Budget Line
26.
(Figure: Rita’s Time Allocation Budget Line) Look at the figure Rita’s Time Allocation
Budget Line. It is based on 80 hours available for labor and leisure. Her hourly wage is:
A)
$5.60.
B)
$7.00.
C)
$8.00.
D)
$10.00.
27.
(Figure: Rita’s Time Allocation Budget Line) Look at the figure Rita’s Time Allocation
Budget Line. It is based on 80 hours available for labor and leisure. If her hourly wage
doubles, the vertical intercept will be:
A)
$1,120.
B)
$1,400.
C)
$1,600.
D)
$2,000.
Page 9
28.
(Figure: Rita’s Time Allocation Budget Line) Look at the figure Rita’s Time Allocation
Budget Line. It is based on 80 hours available for labor and leisure. If her hourly wage
doubles, the new time allocation budget line will have a point at _____ hours of leisure
and _____ in income.
A)
30; $1,000
B)
40; $400
C)
50; $700
D)
60; $280
29.
(Figure: Rita’s Time Allocation Budget Line) Look at the figure Rita’s Time Allocation
Budget Line. It is based on 80 hours available for labor and leisure. Rita chooses 40
hours of leisure and income of $280. When her hourly wage doubles, Rita chooses 30
hours of leisure and income of $700. The substitution effect is making her work _____,
the income effect is making her work _____, and the substitution effect is _____ than
the income effect.
A)
more; less; stronger
B)
less; more; stronger
C)
more; less; weaker
D)
less; more; weaker
30.
(Figure: Rita’s Time Allocation Budget Line) Look at the figure Rita’s Time Allocation
Budget Line. It is based on 80 hours available for labor and leisure. Rita chooses 40
hours of leisure and income of $280. When her hourly wage doubles, Rita chooses 50
hours of leisure and income of $420. The substitution effect is making her work _____,
the income effect is making her work _____, and the substitution effect is _____ than
the income effect.
A)
more; less; stronger
B)
less; more; stronger
C)
more; less; weaker
D)
less; more; weaker
31.
To maximize utility, an individual should allocate time so that the marginal utility of the
earnings from an hour spent working is equal to the marginal utility of an additional
hour of leisure.
A)
True
B)
False
Page 10
32.
Kaile earns $10 as a lab technician. She can work up to 60 hours per week but usually
works 35 hours. She spends several hours every week reading in the park. She says she
likes this because it is free. Kaile is right: sitting in the park with a book is costless.
A)
True
B)
False
33.
If an individual’s wage rate decreases, the substitution effect will cause the individual to
work fewer hours.
A)
True
B)
False
34.
If leisure is a normal good for Randy, then both the substitution effect and the income
effect of a decrease in the wage rate will cause Randy to work fewer hours.
A)
True
B)
False
35.
While individual labor supply curves may bend backward, market labor supply curves
are likely to be upward-sloping throughout, since higher wages induce new workers to
enter the labor market.
A)
True
B)
False
36.
Alex’s wage rate falls. Holding everything else constant, Alex’s new time allocation
budget line will:
A)
shift in toward the origin, parallel to the old one.
B)
shift away from the origin, parallel to the old one.
C)
rotate to the left on the x-axis.
D)
rotate down on the y-axis.
Page 11
Use the following to answer questions 37-41:
Figure: Joanna’s Time Allocation Budget Line
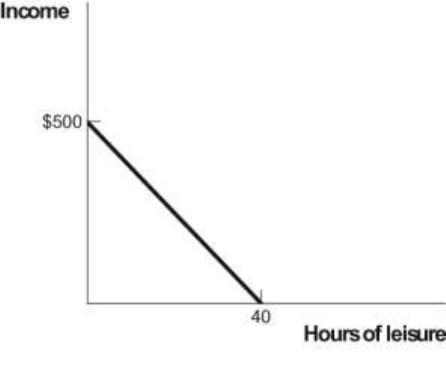
37.
(Figure: Joanna’s Time Allocation Budget Line) The figure Joanna’s Time Allocation
Budget Line depicts what happens when she can choose how to spend 40 hours. What is
Joanna’s wage rate?
A)
$10.00
B)
$12.50
C)
$40.00
D)
$15.00
38.
(Figure: Joanna’s Time Allocation Budget Line) The figure Joanna’s Time Allocation
Budget Line depicts what happens when she can choose how to spend 40 hours. What is
the opportunity cost of an hour of leisure?
A)
$10.00
B)
$12.50
C)
$40.00
D)
$15.00
39.
(Figure: Joanna’s Time Allocation Budget Line) The figure Joanna’s Time Allocation
Budget Line depicts what happens when she can choose how to spend 40 hours. If
Joanna’s wage increases and as a result she consumes LESS leisure, her supply curve of
labor is:
A)
horizontal.
B)
upward-sloping.
C)
downward-sloping.
D)
vertical.
Page 12
40.
(Figure: Joanna’s Time Allocation Budget Line) Joanna’s Time Allocation Budget Line
depicts what happens when she can choose how to spend 40 hours. If Joanna’s wage rate
increases and she ends up working MORE hours:
A)
leisure became relatively more expensive.
B)
leisure became relatively less expensive.
C)
leisure did not change in price.
D)
she does not know how to allocate her time effectively.
41.
(Figure: Joanna’s Time Allocation Budget Line) Joanna’s Time Allocation Budget Line
depicts what happens when she can choose how to spend 40 hours. If Joanna’s wage rate
increases and she ends up working more hours, for her:
A)
the substitution effect dominates.
B)
the income effect dominates.
C)
the substitution and income effects cancel each other out.
D)
the substitution effect becomes ineffective.