Chapter 19(4): Cost Behavior and Cost-Volume-Profit Analysis
194.
For the past year, Iris Company had fixed costs of $6,708,000, a unit variable cost of $444, and a unit selling price
of $600. For the coming year, no changes are expected in revenues and costs, except that a new wage contract will
increase variable costs by $6 per unit. Determine the break-even sales (units) for (a) the past year and (b) the
coming year.
195.
For the past year, Pedi Company had fixed costs of $70,000, unit variable costs of $32, and a unit selling price of
$40. For the coming year, no changes are expected in revenues and costs, except that property taxes are expected
to increase by $10,000. Determine the break-even sales (units) for (a) the past year and (b) the coming year.
196.
For the coming year, River Company estimates fixed costs at $109,000, the unit variable cost at $21, and the
unit
selling price at $85. Determine (a) the break-even point in units of sales, (b) the unit sales required to
realize
operating income of $150,000 and (c) the probable operating income if sales total $500,000.
Round units to the nearest whole number and percentage to one decimal place.
197.
Racer Industries has fixed costs of $900,000. Selling price per unit is $250, and variable cost per unit is $130.
Required:
(a)
How many units must Racer sell in order to break even?
(b)
How many units must Racer sell in order to earn a profit of $480,000?
(c)
A new employee suggests that Racer Industries sponsor a 10K marathon as a form of advertising. The cost to
sponsor the event is $7,200. How many more units must be sold to cover this cost?
198.
A company with a break-even point at $900,000 in sales revenue had fixed costs of $225,000. When actual sales
were $1,000,000 variable costs were $750,000. Determine (a) the margin of safety expressed in dollars, (b) the
margin of safety expressed as a percentage of sales, (c) the contribution margin ratio, and (d) the operating income.
199.
A company has a margin of safety of 25%, a contribution margin ratio of 30%, and sales of $1,000,000.
(a)
What is the break-even point in sales dollars?
(b)
What is the operating income?
(c)
If neither the relationship between variable costs and sales nor the amount of fixed costs
is
expected to change in the next year, how much additional operating income can be
earned
by increasing sales by $110,000?
200.
Bobby Company has fixed costs of $160,000. The unit selling price, variable cost per unit, and contribution margin
per unit for the company’s two products are provided below.
Product
Selling Price per Unit
Variable Cost per Unit
Contribution Margin
per Unit
X
$180
$100
$80
Y
100
60
40
The sales mix for product X and Y is 60% and 40%, respectively. Determine the break-even point in units of X
and
Y.
201.
Steven Company has fixed costs of $160,000. The unit selling price, variable cost per unit, and contribution margin
per unit for the company’s two products are provided below.
Product
Selling Price per Unit
Variable Cost per Unit
Contribution Margin
per Unit
X
$180
$80
$100
Y
100
50
50
The sales mix for product X and Y is 60% and 40%, respectively. Determine the break-even point in units of X
and
Y.
202.
The Klein Company reports the following data:
Sales
$980,000
Variable costs
500,000
Fixed costs
350,000
Determine Klein Company’s operating leverage. Round your answer to two decimal places.
203.
The Tom Company reports the following data:
Sales
$600,000
Variable costs
400,000
Fixed costs
100,000
Determine Tom Company’s operating leverage.
204.
The Dean Company has sales of $500,000, and the break-even point in sales dollars of $300,000. Determine the
company’s margin of safety percentage.
205.
The Grant Company has sales of $300,000, and the break-even point in sales dollars if $225,000. Determine the
company’s margin of safety percentage.
206.
Trail Bikes, Inc. sells three Deluxe bikes for every seven Standard bikes. The Deluxe bike sells for $1,800 and
has
variable costs of $1,200. The Standard bike sells for $600 and has variable costs of $200.
Required
(a)
If Trail Bikes has fixed costs that total $1,702,000, how many bikes must be sold in order for the company
to
break even?
(b)
How many of these bikes will be Deluxe bikes and how many will be the Standard bikes?
207.
If a business had a capacity of $10,000,000 of sales, actual sales of $6,000,000, break-even sales of
$4,200,000,
fixed costs of $1,800,000, and variable costs of 60% of sales, what is the margin of safety
expressed as a
percentage of sales?
208.
Safari Co. sells two products, Orks and Zins. Last year, Safari sold 21,000 units of Orks and 14,000 units of
Zins.
Related data are
Product
Unit Selling
Price
Unit Variable
Cost
Unit Contribution
Margin
Orks
$120
$80
$40
Zins
80
60
20
Calculate the following:
a.
Safari Co.’s sales mix
b.
Safari Co.’s unit selling price of E?
c.
Safari Co.’s unit contribution margin of E?
d.
Safari Co.’s breakeven point assuming that last year’s fixed costs were $160,000.
209.
A business had a margin of safety ratio of 20%, variable costs of 75% of sales, fixed costs of $240,000, a
break-
even point of $960,000, and operating income of $60,000 for the current year. Calculate the current
year’s sales.
210.
Cordell, Inc. has an operating leverage of 3. Sales are expected to increase by 9% next year. What is the expected
change in operating income next year?
211.
Silver River Company sells Products S and T and has made the following estimates for the coming year:
Product
Unit Selling Price
Unit Variable Cost
Sales Mix
S
$30
$24
60%
T
70
56
40
Fixed costs are estimated at $202,400. Determine (a) the estimated sales in units of the overall product necessary
to reach the break-even point for the coming year, (b) the estimated number of units of each product necessary to
be sold to reach the break-even point for the coming year, and (c) the estimated sales in units of the overall
product
necessary to realize an operating income of $119,600 for the coming year.
212.
Define operating leverage. Explain the relationship between a company’s operating leverage and how a change in
sales is expected to impact profits.
213.
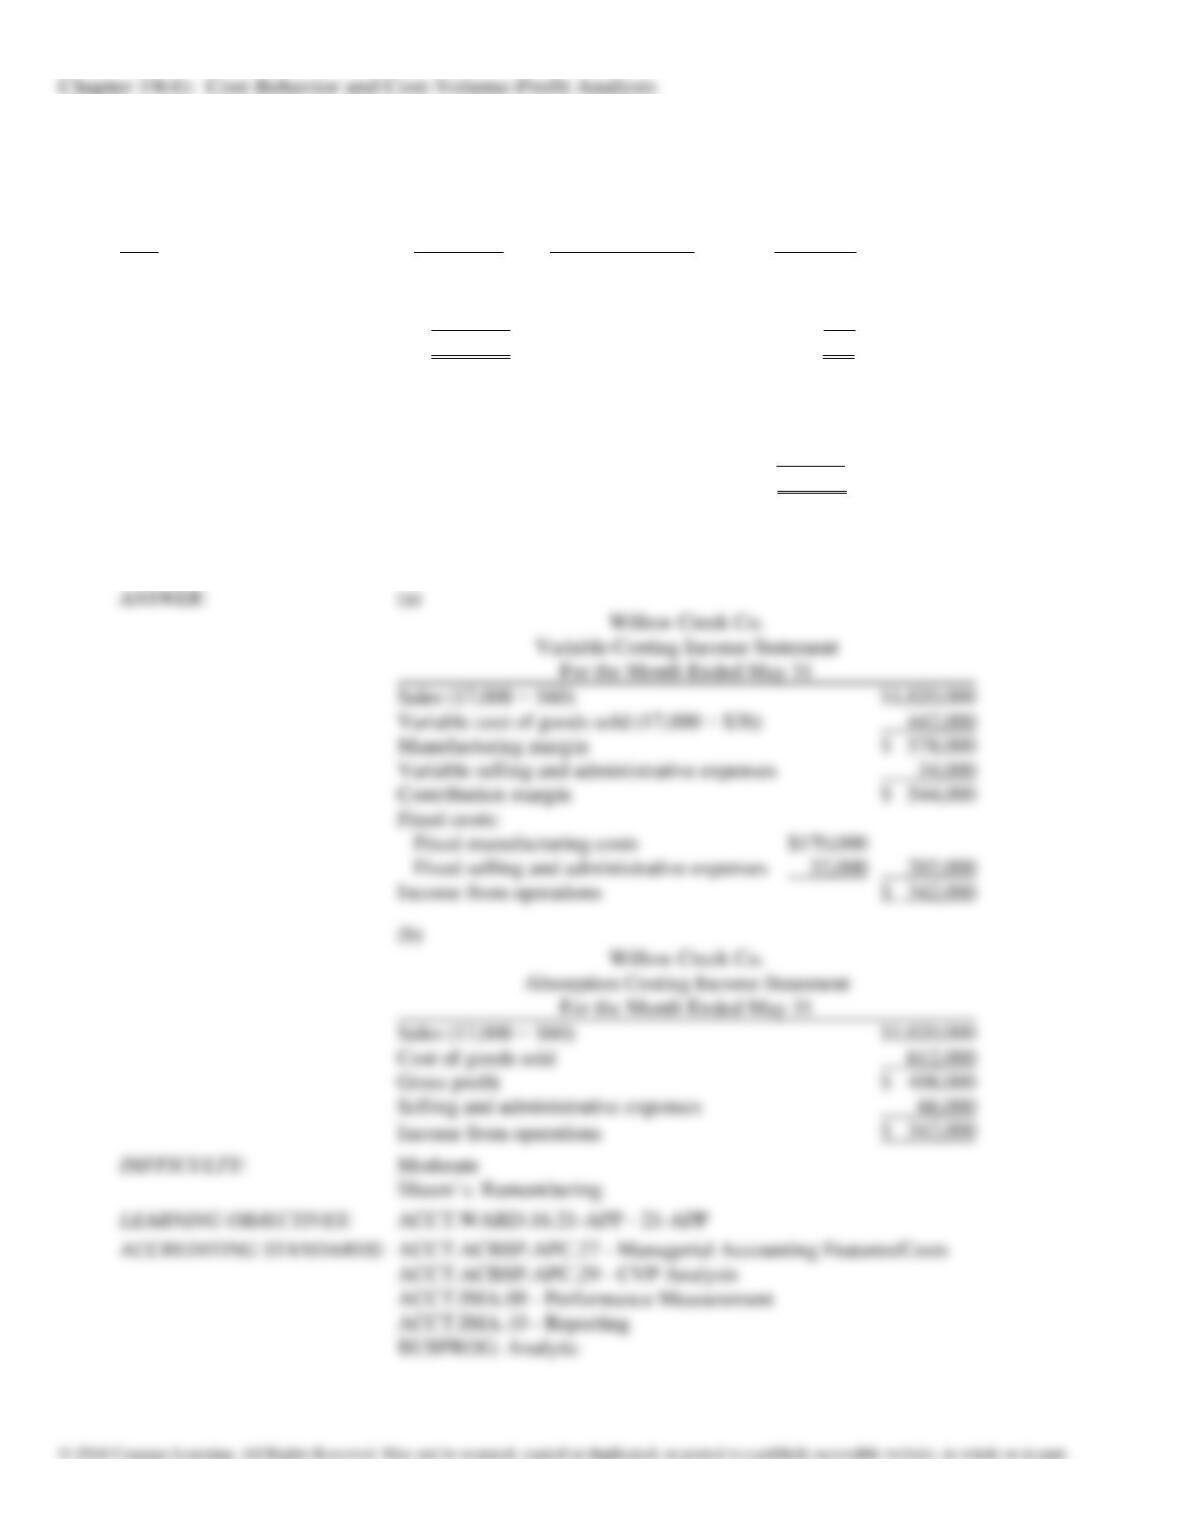
The following data are available from the accounting records of Willow Creek Co. for the month ended May
31.
During the accounting period, 17,000 units were manufactured and sold at a price of $60 per unit. There
were no
beginning inventories, and all units were completed (no work in process).
Cost
Total Cost
Number of Units
Unit Cost
Manufacturing costs:
Variable
$442,000
17,000
$26
Fixed
170,000
17,000
10
Total
$612,000
$36
Selling and administrative expenses:
Variable ($2 per unit sold)
$34,000
Fixed
32,000
Total
$66,000
(a)
Prepare a variable costing income statement.
(b)
Prepare an absorption costing income statement.
214.
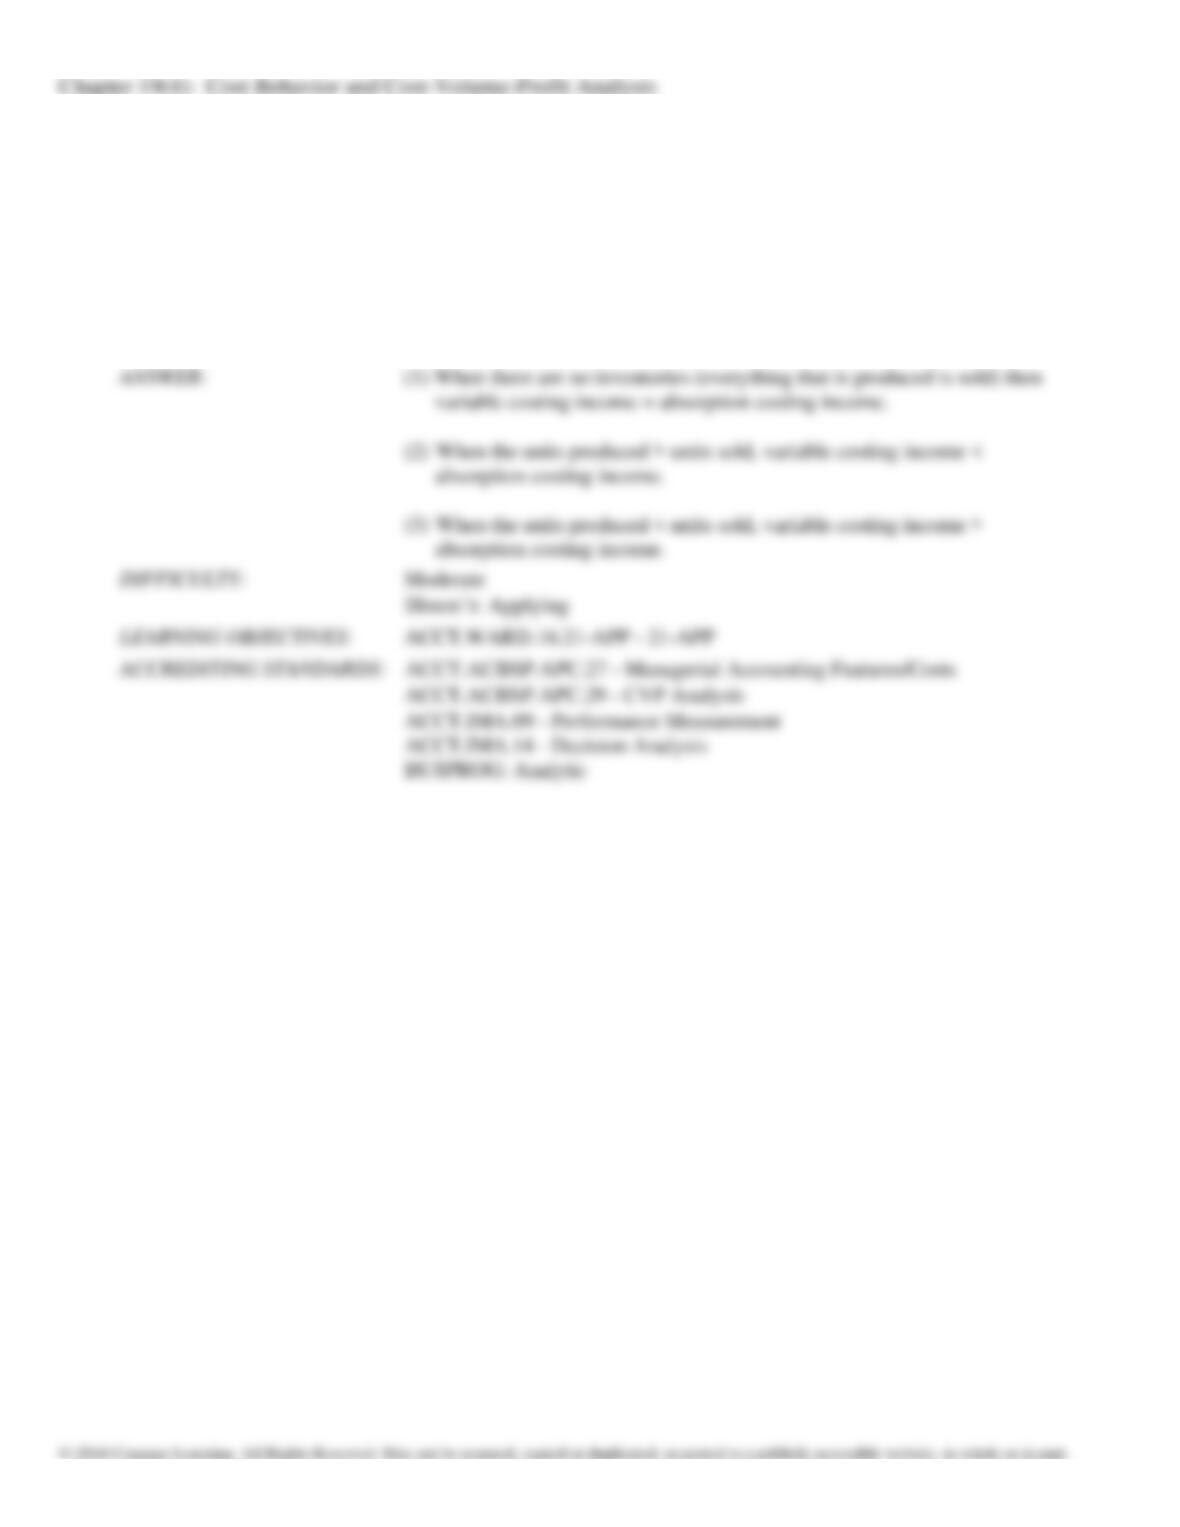
Explain how variable costing net income will be different than absorption costing net income under the
following
situations:
(1)
A company had no beginning or ending inventory. During the year, it produced and sold 10,000 units.
(2)
A company had no beginning inventory. During the year, it produced 10,000 units and sold 8,000 units.
(3)
A company had 2,000 units in beginning inventory. During the year, it produced 10,000 units and sold
12,000
units.

215.
Roller Paint Co. reported the following data for the month of September. There were no beginning inventories
and
all units were completed (no work in process).
Total Cost
Number of
Units
Unit Cost
Manufacturing costs:
Variable
$465,000
30,000
$15.50
Fixed
210,000
30,000
7.00
Total
$675,000
$22.50
Selling and administrative expenses:
Variable
$2 per unit sold
Fixed
$39,000
In the month of September, 28,000 of the 30,000 units manufactured were sold at a price of $80 per unit.
(a)
Prepare a variable costing income statement.
(b)
Prepare an absorption costing income statement.
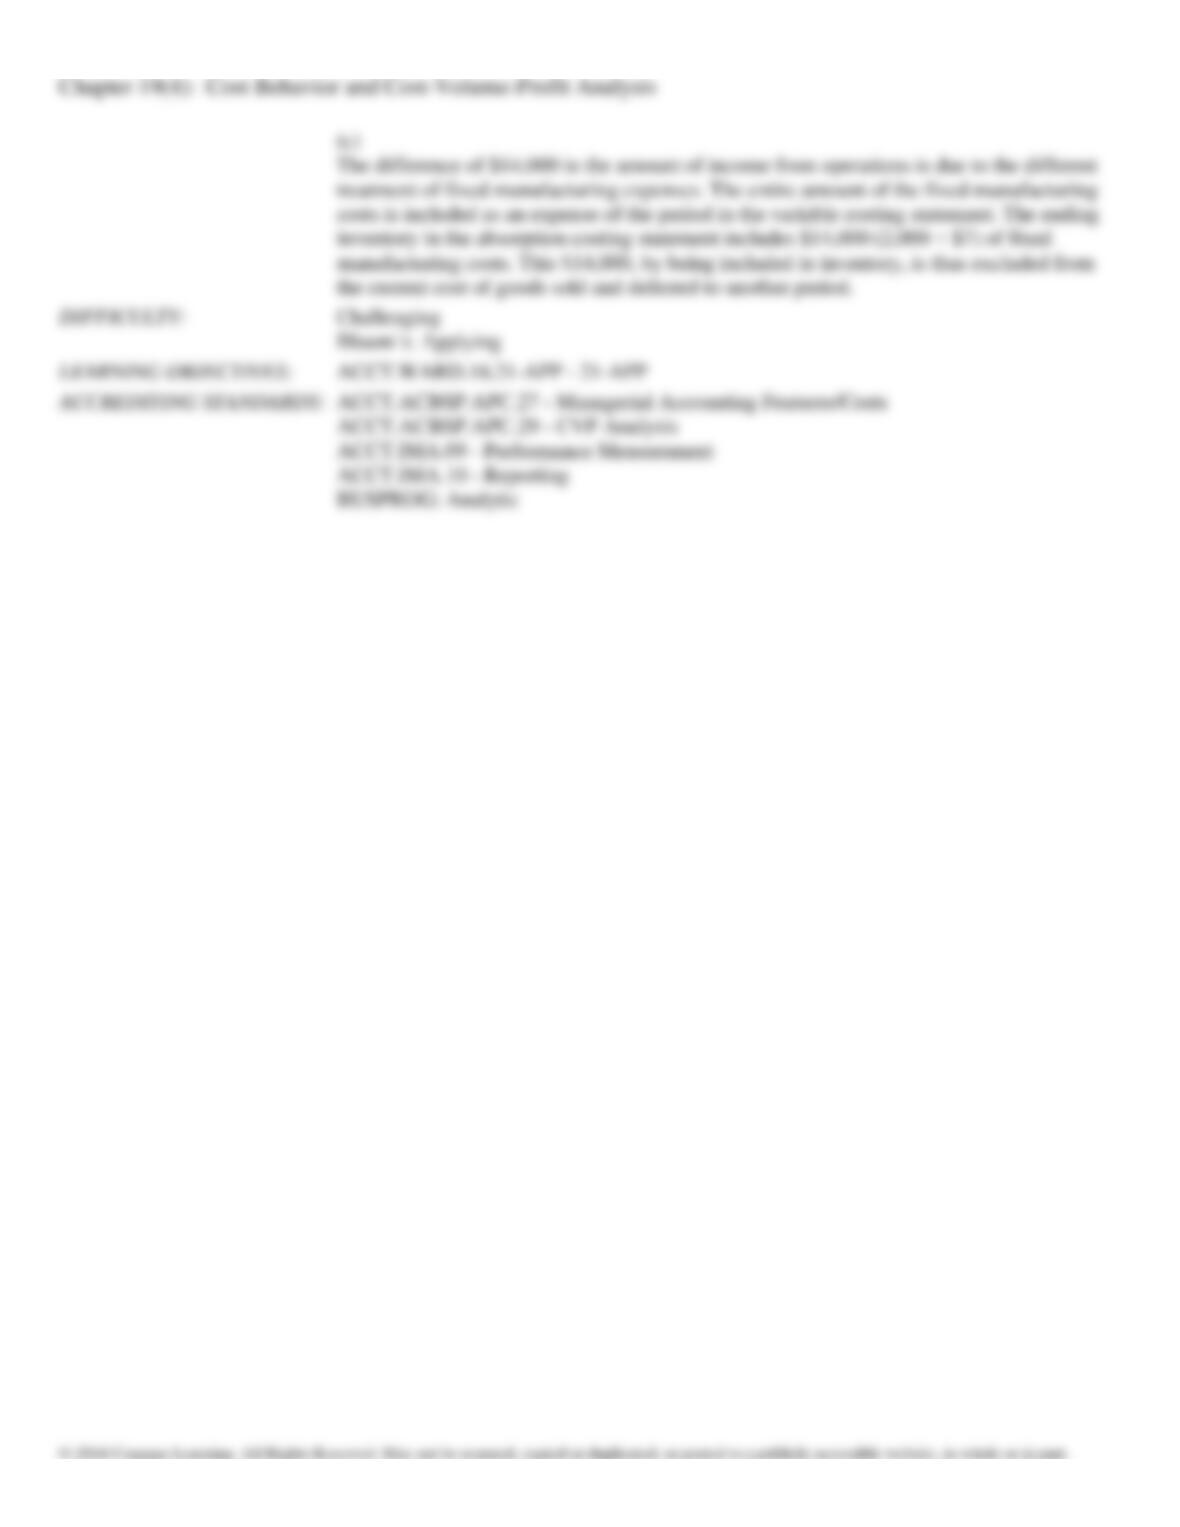
(c)
Briefly explain why there is a difference in income from operations between the two
methods.
(a)
Sales (28,000 × $80)
Variable cost of goods sold:
Variable cost of goods manufactured
(30,000 × 15.50)
Less ending inventory (2,000 × $15.50)
Variable cost of goods sold
Manufacturing margin
expenses (28,000 × $2.00)
Contribution margin
Fixed costs:
Fixed manufacturing costs
expenses
Income from operations
Sales (28,000 × $80)
Cost of goods sold:
Less ending inventory (2,000 × $22.50)
Cost of goods sold
Gross profit
Selling and administrative expenses
(28,000 × $2 + $39,000)
Chapter 19(4): Cost Behavior and Cost-Volume-Profit Analysis
Match the following terms with their definitions.
a.
Relevant range
b.
Break-even point
c.
Contribution margin
d.
Fixed costs
e.
Variable costs
DIFFICULTY: Easy
Bloom’s: Remembering
LEARNING OBJECTIVES: ACCT.WARD.16.21-01 – 21–01
ACCT.WARD.16.21-02 – 21–02
ACCT.WARD.16.21-03 – 21–03
ACCREDITING STANDARDS: ACCT.ACBSP.APC.25 – Managerial Characteristics/Terminology
ACCT.ACBSP.APC.27 – Managerial Accounting Features/Costs
ACCT.ACBSP.APC.28 – Variable and Fixed Costs
ACCT.ACBSP.APC.30 – Contribution Margin
ACCT.ACBSP.APC.31 – Break-even point
ACCT.IMA.07 – Cost Management
ACCT.IMA.09 – Performance Measurement
ACCT.IMA.14 – Decision Analysis
BUSPROG: Analytic
216.
Vary in proportion to changes in activity levels
217.
Remain the same in total dollar amount as the level of activity changes
218.
Where a business’s revenues exactly equal costs
219.
A specific activity range over which the cost changes are of interest.
220.
The excess of sales revenues over variable costs
Chapter 19(4): Cost Behavior and Cost-Volume-Profit Analysis
Match the following terms (a-e) with their definitions.
a.
Profit-volume chart
b.
Cost-volume-profit chart
c.
Sales mix
d.
Operating leverage
e.
Margin of safety
DIFFICULTY: Easy
Bloom’s: Remembering
LEARNING OBJECTIVES: ACCT.WARD.16.21-04 – 21–04
ACCT.WARD.16.21-05 – 21–05
ACCREDITING STANDARDS: ACCT.ACBSP.APC.27 – Managerial Accounting Features/Costs
ACCT.ACBSP.APC.29 – CVP Analysis
ACCT.ACBSP.APC.32 – Margin of safety/sales target
ACCT.IMA.09 – Performance Measurement
ACCT.IMA.14 – Decision Analysis
BUSPROG: Analytic
221.
Indicates the possible decrease in sales that may occur before operating loss results
222.
Contribution margin divided by income from operations
223.
Graphically shows costs, sales, and operating profit or loss at various levels of units sold
224.
Plots only the difference between total sales and total costs
225.
The relative distribution of sales among products sold by a company