
Exam
Name___________________________________
MULTIPLE CHOICE. Choose the one alternative that best completes the statement or answers the question.
Use the tables for the question(s) below.
Pro Forma Income Statement for Ideko, 2005–2010
Year 2005 2006 2007 2008 2009 2010
Income Statement ($ 000)
1 Sales 75,000 88,358 103,234 119,777 138,149 158,526
2 Cost of Goods Sold
3 Raw Materials (16,000) (18,665) (21,593) (24,808) (28,333) (32,193)
4 Direct Labor Costs (18,000) (21,622) (25,757) (30,471) (35,834) (41,925)
5 Gross Profit 41,000 48,071 55,883 64,498 73,982 84,407
6 Sales and Marketing (11,250) (14,579) (18,582) (23,356) (27,630) (31,705)
7 Administrative (13,500) (13,254) (15,485) (16,769) (17,959) (20,608)
8 EBITDA 16,250 20,238 21,816 24,373 28,393 32,094
9 Depreciation (5,500) (5,450) (5,405) (6,865) (7,678) (7,710)
10 EBIT 10,750 14,788 16,411 17,508 20,715 24,383
11 Interest Expense (net) (75) (6,800) (6,800) (6,800) (7,820) (8,160)
12 Pretax Income 10,675 7,988 9,611 10,708 12,895 16,223
13 Income Tax (3,736) (2,796) (3,364) (3,748) (4,513) (5,678)
14 Net Income 6,939 5,193 6,247 6,960 8,382 10,545
Pro Forma Balance Sheet for Ideko, 2005–2010
Year 2005 2006 2007 2008 2009 2010
Balance Sheet ($ 000)
Assets
1 Cash and Cash Equivalents 6,164 7,262 8,485 9,845 11,355 13,030
2 Accounts Receivable 18,493 14,525 16,970 19,689 22,709 26,059
3 Inventories 6,165 6,501 7,613 8,854 10,240 11,784
4 Total Current Assets 30,822 28,288 33,067 38,388 44,304 50,872
5 Property, Plant, and Equipment 49,500 49,050 48,645 61,781 69,102 69,392
6 Goodwill 72,332 72,332 72,332 72,332 72,332 72,332
7 Total Assets 152,654 149,670 154,044 172,501 185,738 192,597
Liabilities
8 Accounts Payable 4,654 5,532 6,648 7,879 9,110 10,448
9 Debt 100,000 100,000 100,000 115,000 120,000 120,000
10 Total Liabilities 104,654 105,532 106,648 122,879 129,110 130,448
Stockholder’s Equity
11 Starting Stockholder’s Equity 48,000 44,138 47,396 49,621 56,628
12 Net Income 5,193 6,247 6,960 8,382 10,545
13 Dividends (2,000) (9,055) (2,989) (4,735) (1,375) (5,024)
14 Capital Contributions 50,000 – – – – – – – – – – – – —
15 Stockholder’s Equity 48,000 44,138 47,396 49,621 56,628 62,149
16 Total Liabilities and Equity 152,654 149,670 154,044 172,501 185,738 192,597
1
1)
Assuming that Ideko has a EBITDA multiple of 9.4, then the continuation unlevered P/E ratio of
Ideko in 2010 is closest to:
1)
A)
17.2
B)
16.4
C)
19.4
D)
14.5
Use the table for the question(s) below.
Pro Forma Income Statement for Ideko, 2005–2010
Year 2005 2006 2007 2008 2009 2010
Income Statement ($ 000)
1 Sales 75,000 88,358 103,234 119,777 138,149 158,526
2 Cost of Goods Sold
3 Raw Materials (16,000) (18,665) (21,593) (24,808) (28,333) (32,193)
4 Direct Labor Costs (18,000) (21,622) (25,757) (30,471) (35,834) (41,925)
5 Gross Profit 41,000 48,071 55,883 64,498 73,982 84,407
6 Sales and Marketing (11,250) (14,579) (18,582) (23,356) (27,630) (31,705)
7 Administrative (13,500) (13,254) (15,485) (16,769) (17,959) (20,608)
8 EBITDA 16,250 20,238 21,816 24,373 28,393 32,094
9 Depreciation (5,500) (5,450) (5,405) (6,865) (7,678) (7,710)
10 EBIT 10,750 14,788 16,411 17,508 20,715 24,383
11 Interest Expense (net) (75) (6,800) (6,800) (6,800) (7,820) (8,160)
12 Pretax Income 10,675 7,988 9,611 10,708 12,895 16,223
13 Income Tax (3,736) (2,796) (3,364) (3,748) (4,513) (5,678)
14 Net Income 6,939 5,193 6,247 6,960 8,382 10,545
2)
The amount of net working capital for Ideko in 2007 is closest to:
2)
A)
$35,195
B)
$22,170
C)
$30,510
D)
$26,420
Use the table for the question(s) below.
Ideko Sales and Operating Cost Assumptions
Year 2005 2006 2007 2008 2009 2010
Sales Data Growth/Year
1 Market Size (000 units) 5.0% 10,000 10,500 11,025 11,576 12,155 12,763
2 Market Share 1.0% 10.0% 11.0% 12.0% 13.0% 14.0% 15.0%
3 Average Sales Price
($/unit) 2.0% 75.00 76.50 78.03 79.59 81.18 82.81
Cost of Goods Data
4 Raw Materials ($/unit) 1.0% 16.00 16.16 16.32 16.48 16.65 16.82
5 Direct Labor Costs ($/unit) 4.0% 18.00 18.72 19.47 20.25 21.06 21.90
Operating Expense
and Tax Data
6 Sales and Marketing
(% sales) 15.0% 16.5% 18.0% 19.5% 20.0% 20.0%
7 Administrative (% sales) 18.0% 15.0% 15.0% 14.0% 13.0% 13.0%
8 Tax Rate 35.0% 35.0% 35.0% 35.0% 35.0% 35.0%
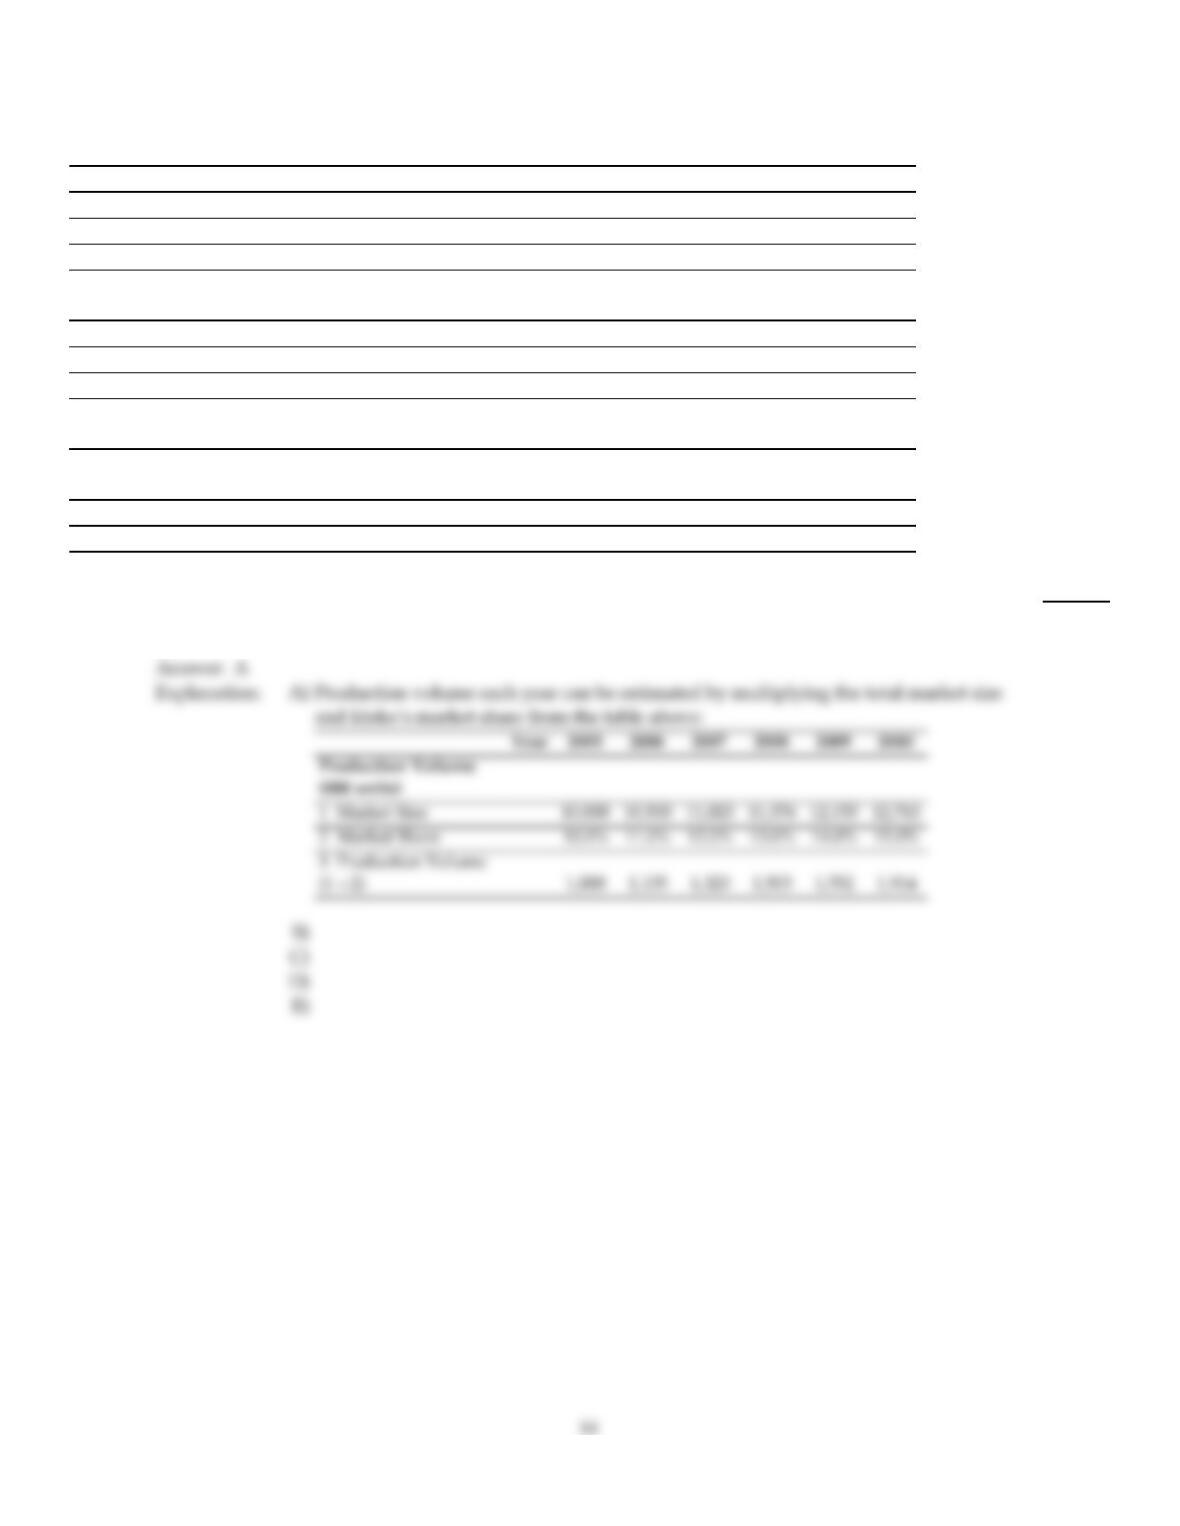
3)
Based upon Ideko’s Sales and Operating Cost Assumptions, what production capacity will Ideko
require in 2009?
3)
A)
1,505 units
B)
1,323 units
C)
1,702 units
D)
1,115 units
E)
1,914 units
Use the table for the question(s) below.
Capital Structure and Unlevered Beta Estimates for Comparable Firms
Firm
E
E +
D
D
E +
D EDU
Oakley 1.00 0.00 1.50 – – – 1.50
Luxottica 0.83 0.17 0.75 00.62
Nike 1.05 –0.05 0.60 00.63
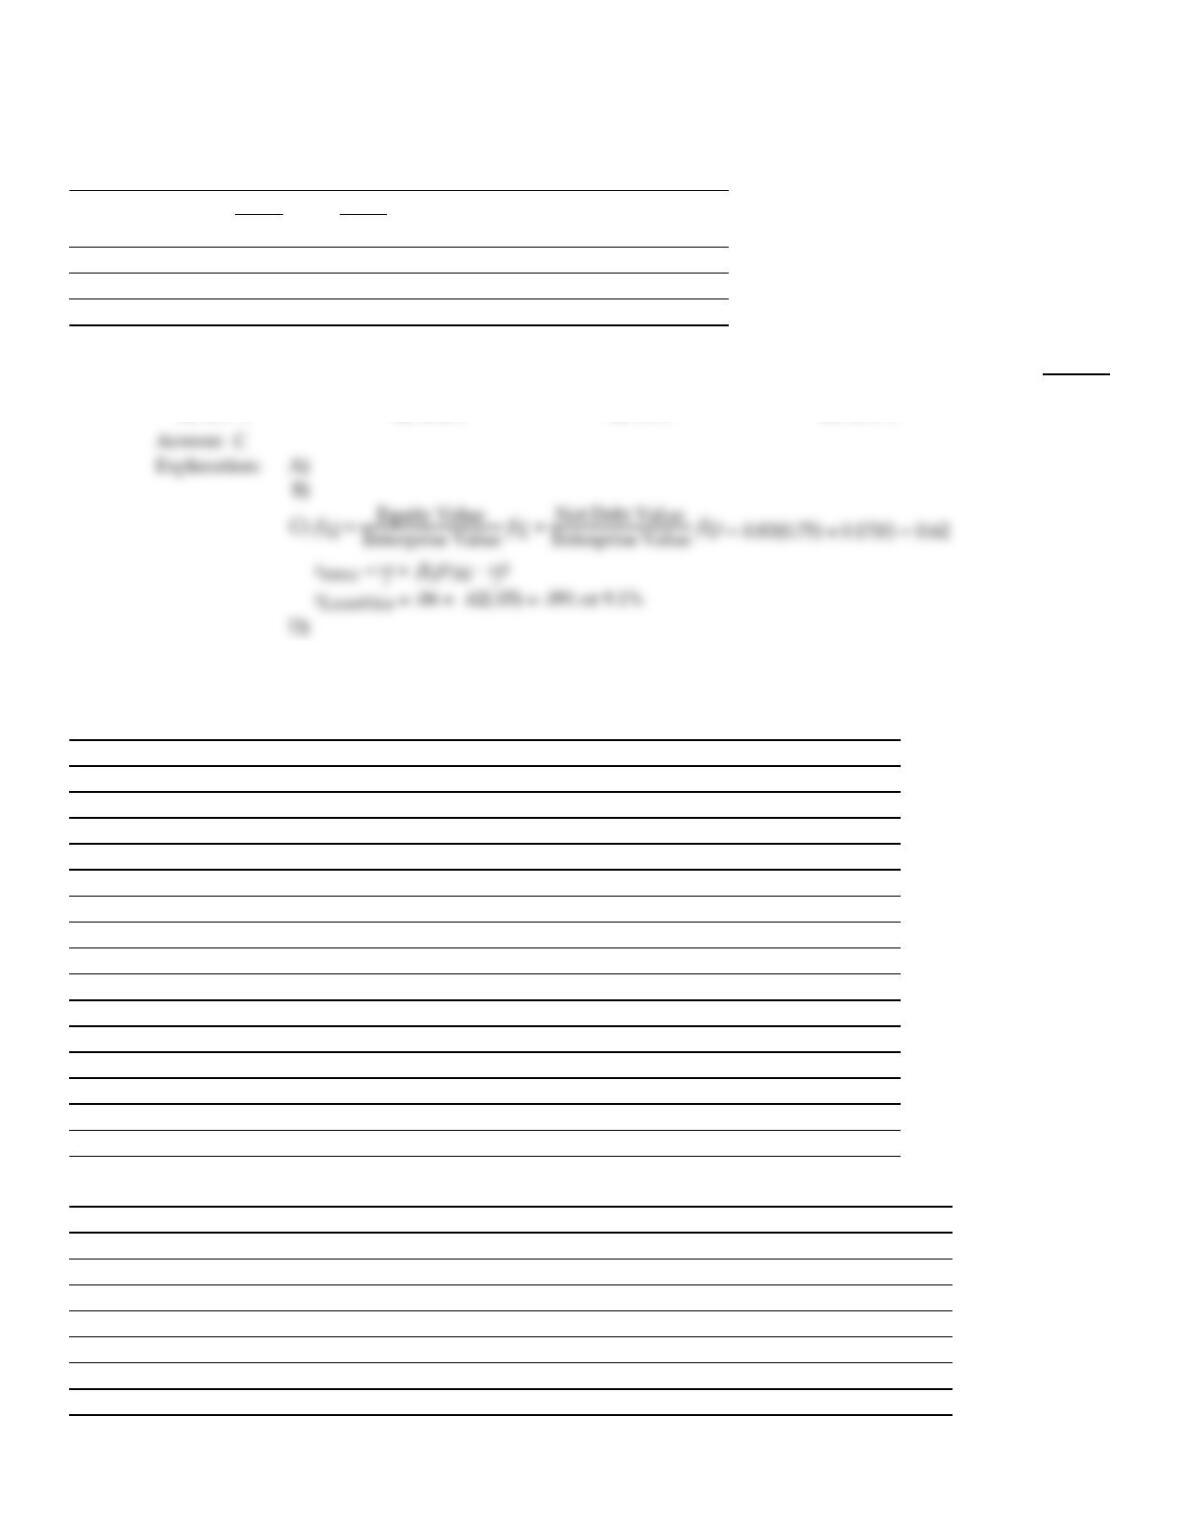
4)
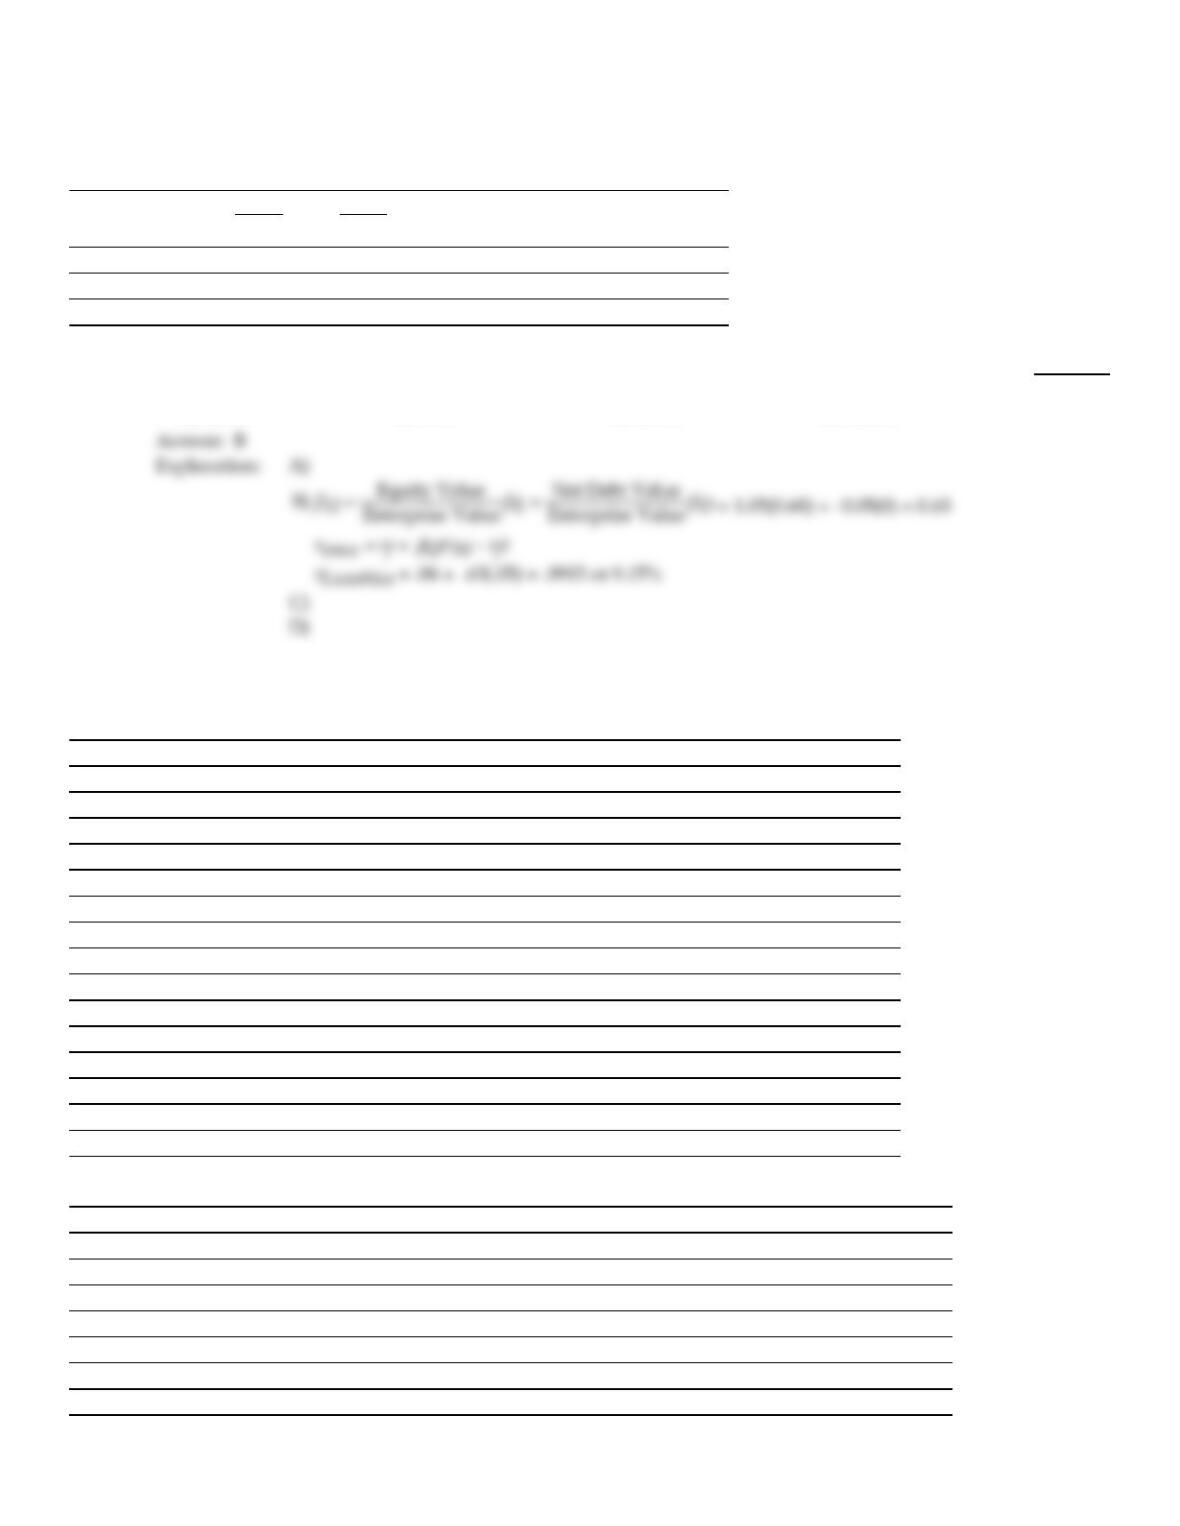
If the risk–free rate of interest is 6% and the market risk premium has historically averaged 5%,
then the cost of capital for Nike is closest to:
4)
A)
14.7%
B)
9.1%
C)
13.5%
D)
10.2%
Use the tables for the question(s) below.
Pro Forma Income Statement for Ideko, 2005–2010
Year 2005 2006 2007 2008 2009 2010
Income Statement ($ 000)
1 Sales 75,000 88,358 103,234 119,777 138,149 158,526
2 Cost of Goods Sold
3 Raw Materials (16,000) (18,665) (21,593) (24,808) (28,333) (32,193)
4 Direct Labor Costs (18,000) (21,622) (25,757) (30,471) (35,834) (41,925)
5 Gross Profit 41,000 48,071 55,883 64,498 73,982 84,407
6 Sales and Marketing (11,250) (14,579) (18,582) (23,356) (27,630) (31,705)
7 Administrative (13,500) (13,254) (15,485) (16,769) (17,959) (20,608)
8 EBITDA 16,250 20,238 21,816 24,373 28,393 32,094
9 Depreciation (5,500) (5,450) (5,405) (6,865) (7,678) (7,710)
10 EBIT 10,750 14,788 16,411 17,508 20,715 24,383
11 Interest Expense (net) (75) (6,800) (6,800) (6,800) (7,820) (8,160)
12 Pretax Income 10,675 7,988 9,611 10,708 12,895 16,223
13 Income Tax (3,736) (2,796) (3,364) (3,748) (4,513) (5,678)
14 Net Income 6,939 5,193 6,247 6,960 8,382 10,545
Pro Forma Balance Sheet for Ideko, 2005–2010
Year 2005 2006 2007 2008 2009 2010
Balance Sheet ($ 000)
Assets
1 Cash and Cash Equivalents 6,164 7,262 8,485 9,845 11,355 13,030
2 Accounts Receivable 18,493 14,525 16,970 19,689 22,709 26,059
3 Inventories 6,165 6,501 7,613 8,854 10,240 11,784
4 Total Current Assets 30,822 28,288 33,067 38,388 44,304 50,872
5 Property, Plant, and Equipment 49,500 49,050 48,645 61,781 69,102 69,392
6 Goodwill 72,332 72,332 72,332 72,332 72,332 72,332
5
6 Goodwill 72,332 72,332 72,332 72,332 72,332 72,332
7 Total Assets 152,654 149,670 154,044 172,501 185,738 192,597
Liabilities
8 Accounts Payable 4,654 5,532 6,648 7,879 9,110 10,448
9 Debt 100,000 100,000 100,000 115,000 120,000 120,000
10 Total Liabilities 104,654 105,532 106,648 122,879 129,110 130,448
Stockholder’s Equity
11 Starting Stockholder’s Equity 48,000 44,138 47,396 49,621 56,628
12 Net Income 5,193 6,247 6,960 8,382 10,545
13 Dividends (2,000) (9,055) (2,989) (4,735) (1,375) (5,024)
14 Capital Contributions 50,000 – – – – – – – – – – – – —
15 Stockholder’s Equity 48,000 44,138 47,396 49,621 56,628 62,149
16 Total Liabilities and Equity 152,654 149,670 154,044 172,501 185,738 192,597
5)
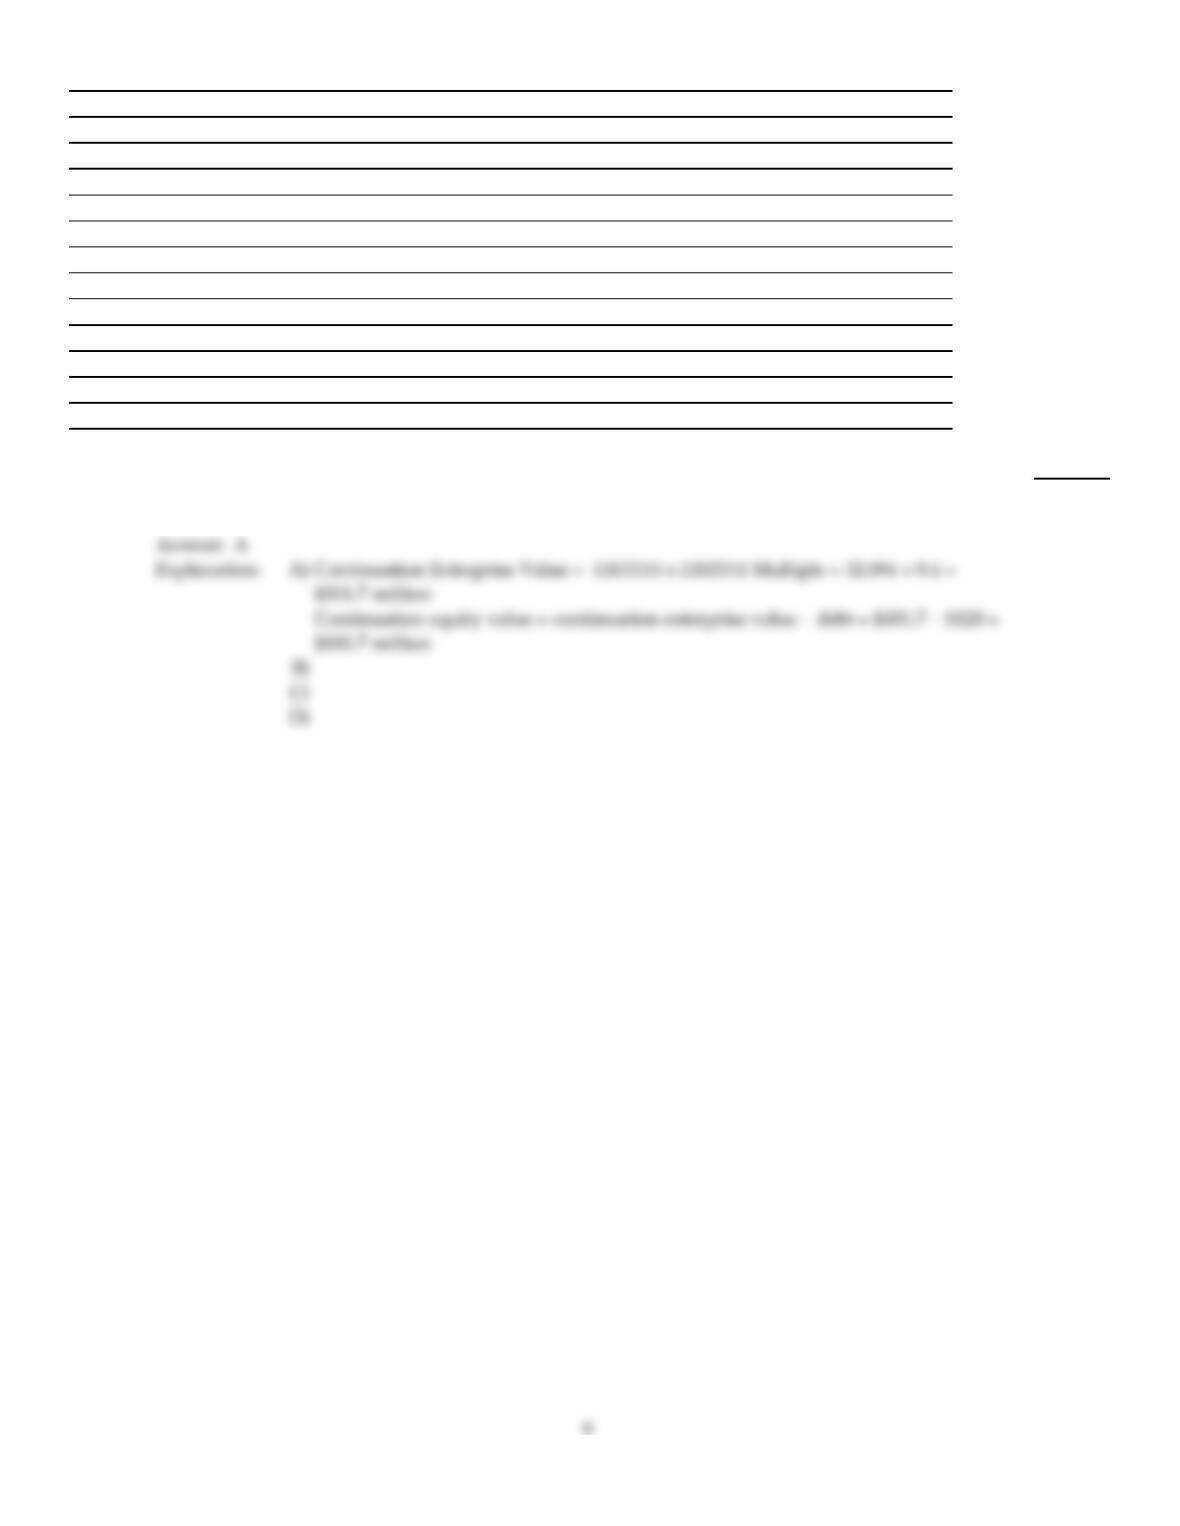
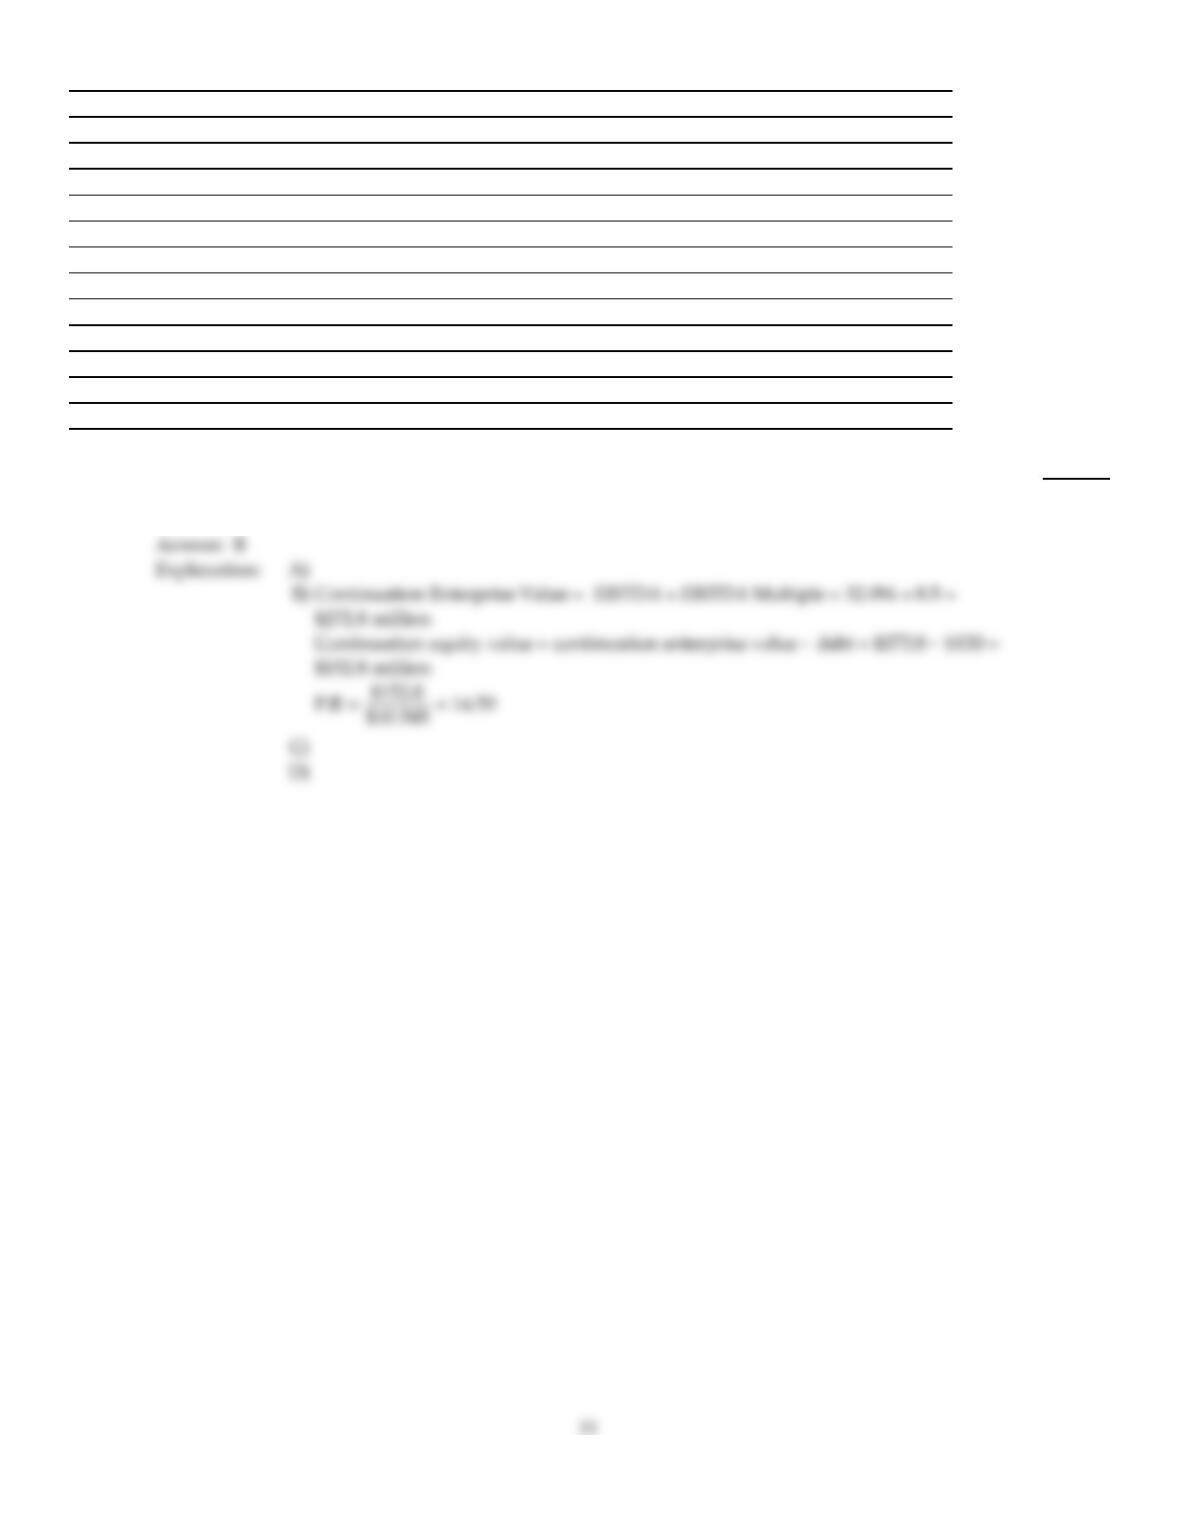
Assuming that Ideko has a EBITDA multiple of 9.4, then the continuation equity value of Ideko in
2010 is closest to:
5)
A)
$181.7 million
B)
$272.8 million
C)
$152.8 million
D)
$301.7 million
Use the tables for the question(s) below.
Estimated 2005 Income Statement and Balance Sheet Data for Ideko Corporation
Year 2005 Year 2005
Income Statement ($ 000) Balance Sheet ($ 000)
1 Sales 75,000 Assets
2 Cost of Goods Sold 1 Cash and Equivalents 12,664
3 Raw Materials (16,000) 2 Accounts Receivable 18,493
4 Direct Labor Costs (18,000) 3 Inventories 6,165
5 Gross Profit 1,000 4 Total Current Assets 37,322
6 Sales and Marketing (11,250) 5 Property, Plant, and Equipment 49,500
7 Administrative (13,500) 6 Goodwill – – –
8 EBITDA 16,250 7 Total Assets 86,822
9 Depreciation (5,500) Liabilities and Stockholder’s Equity
10 EBIT 10,750 8 Accounts Payable 4,654
11 Interest Expense (net) (75) 9 Debt 4,500
12 Pretax Income 10,675 10 Total Liabilities 9,154
13 Income Tax (3,736) 11 Stockholder’’s Equity 77,668
14 Net Income 6,939 12 Total Liabilities and Equity 86,822
The following are financial ratios for three comparable companies:
Ratio Oakley, Inc. Luxottica Group Nike, Inc.
P/E 24.8x 28x 18.2x
EV/Sales 2x 2.7x 1.5x
EV/EBITDA 11.6x 14.4x 9.3x
EBITDA/Sales 17.0% 18.5% 15.9
6)
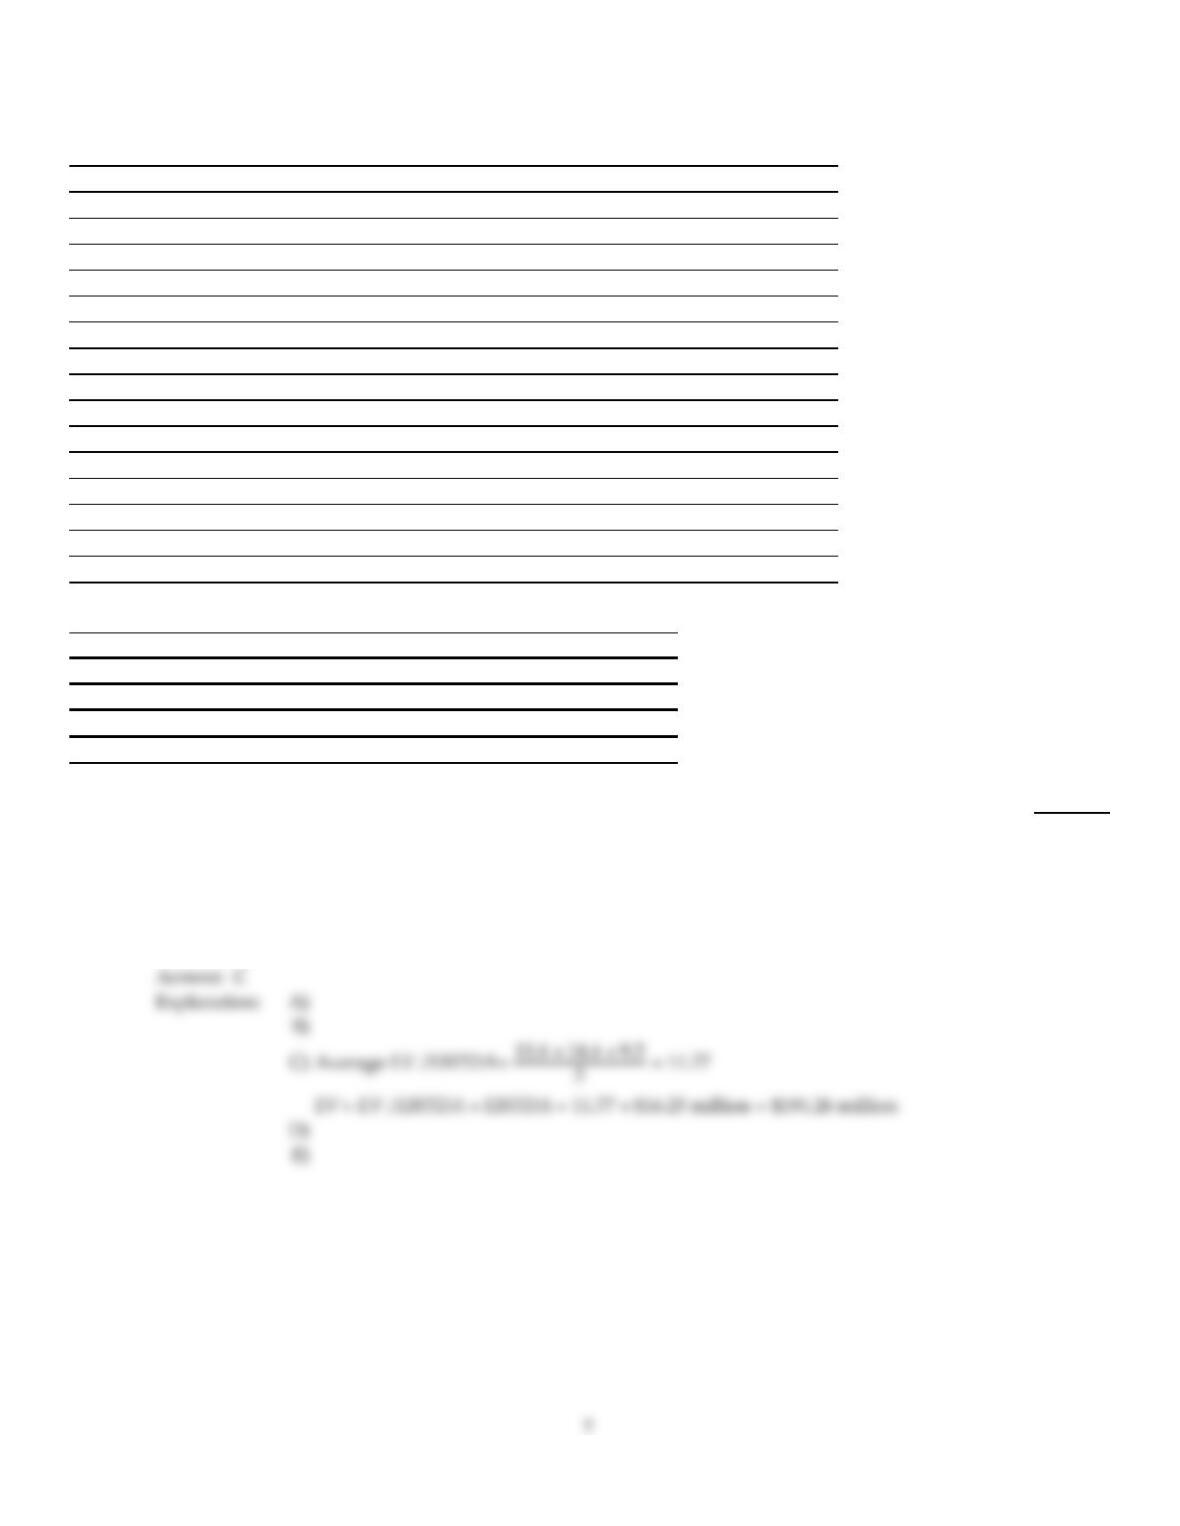
Based upon the average EV/EBITDA ratio of the comparable firms, Ideko’s target economic value is
closest to:
6)
A)
$193 million
B)
$157 million
C)
$191 million
D)
$165 million
E)
$155 million
7)
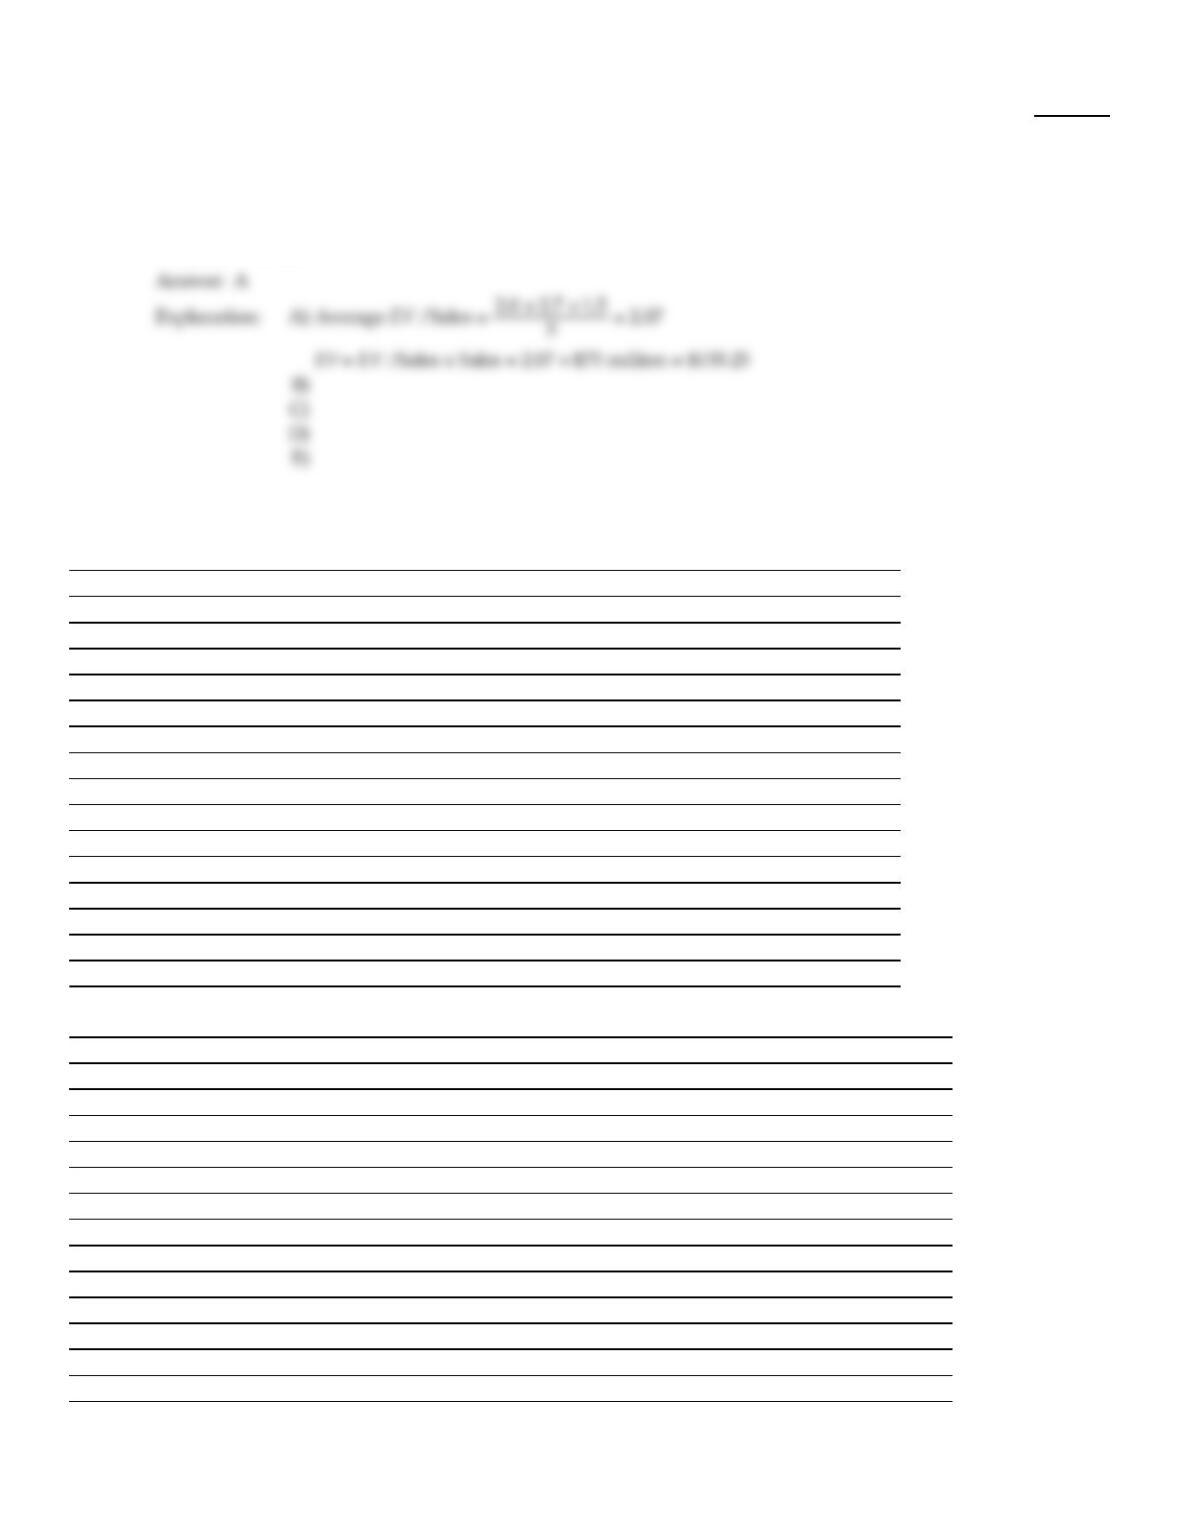
Based upon the average EV/Sales ratio of the comparable firms, Ideko’s target economic value is
closest to:
7)
A)
$155 million
B)
$191 million
C)
$165 million
D)
$193 million
E)
$157 million
Use the tables for the question(s) below.
Pro Forma Income Statement for Ideko, 2005–2010
Year 2005 2006 2007 2008 2009 2010
Income Statement ($ 000)
1 Sales 75,000 88,358 103,234 119,777 138,149 158,526
2 Cost of Goods Sold
3 Raw Materials (16,000) (18,665) (21,593) (24,808) (28,333) (32,193)
4 Direct Labor Costs (18,000) (21,622) (25,757) (30,471) (35,834) (41,925)
5 Gross Profit 41,000 48,071 55,883 64,498 73,982 84,407
6 Sales and Marketing (11,250) (14,579) (18,582) (23,356) (27,630) (31,705)
7 Administrative (13,500) (13,254) (15,485) (16,769) (17,959) (20,608)
8 EBITDA 16,250 20,238 21,816 24,373 28,393 32,094
9 Depreciation (5,500) (5,450) (5,405) (6,865) (7,678) (7,710)
10 EBIT 10,750 14,788 16,411 17,508 20,715 24,383
11 Interest Expense (net) (75) (6,800) (6,800) (6,800) (7,820) (8,160)
12 Pretax Income 10,675 7,988 9,611 10,708 12,895 16,223
13 Income Tax (3,736) (2,796) (3,364) (3,748) (4,513) (5,678)
14 Net Income 6,939 5,193 6,247 6,960 8,382 10,545
Pro Forma Balance Sheet for Ideko, 2005–2010
Year 2005 2006 2007 2008 2009 2010
Balance Sheet ($ 000)
Assets
1 Cash and Cash Equivalents 6,164 7,262 8,485 9,845 11,355 13,030
2 Accounts Receivable 18,493 14,525 16,970 19,689 22,709 26,059
3 Inventories 6,165 6,501 7,613 8,854 10,240 11,784
4 Total Current Assets 30,822 28,288 33,067 38,388 44,304 50,872
5 Property, Plant, and Equipment 49,500 49,050 48,645 61,781 69,102 69,392
6 Goodwill 72,332 72,332 72,332 72,332 72,332 72,332
7 Total Assets 152,654 149,670 154,044 172,501 185,738 192,597
Liabilities
8 Accounts Payable 4,654 5,532 6,648 7,879 9,110 10,448
9 Debt 100,000 100,000 100,000 115,000 120,000 120,000
10 Total Liabilities 104,654 105,532 106,648 122,879 129,110 130,448
Stockholder’s Equity
8
Stockholder’s Equity
11 Starting Stockholder’s Equity 48,000 44,138 47,396 49,621 56,628
12 Net Income 5,193 6,247 6,960 8,382 10,545
13 Dividends (2,000) (9,055) (2,989) (4,735) (1,375) (5,024)
14 Capital Contributions 50,000 – – – – – – – – – – – – —
15 Stockholder’s Equity 48,000 44,138 47,396 49,621 56,628 62,149
16 Total Liabilities and Equity 152,654 149,670 154,044 172,501 185,738 192,597
8)
Assuming that Ideko has a EBITDA multiple of 8.5, then the continuation unlevered P/E ratio of
Ideko in 2010 is closest to:
8)
A)
14.5
B)
17.6
C)
16.4
D)
19.0
9)
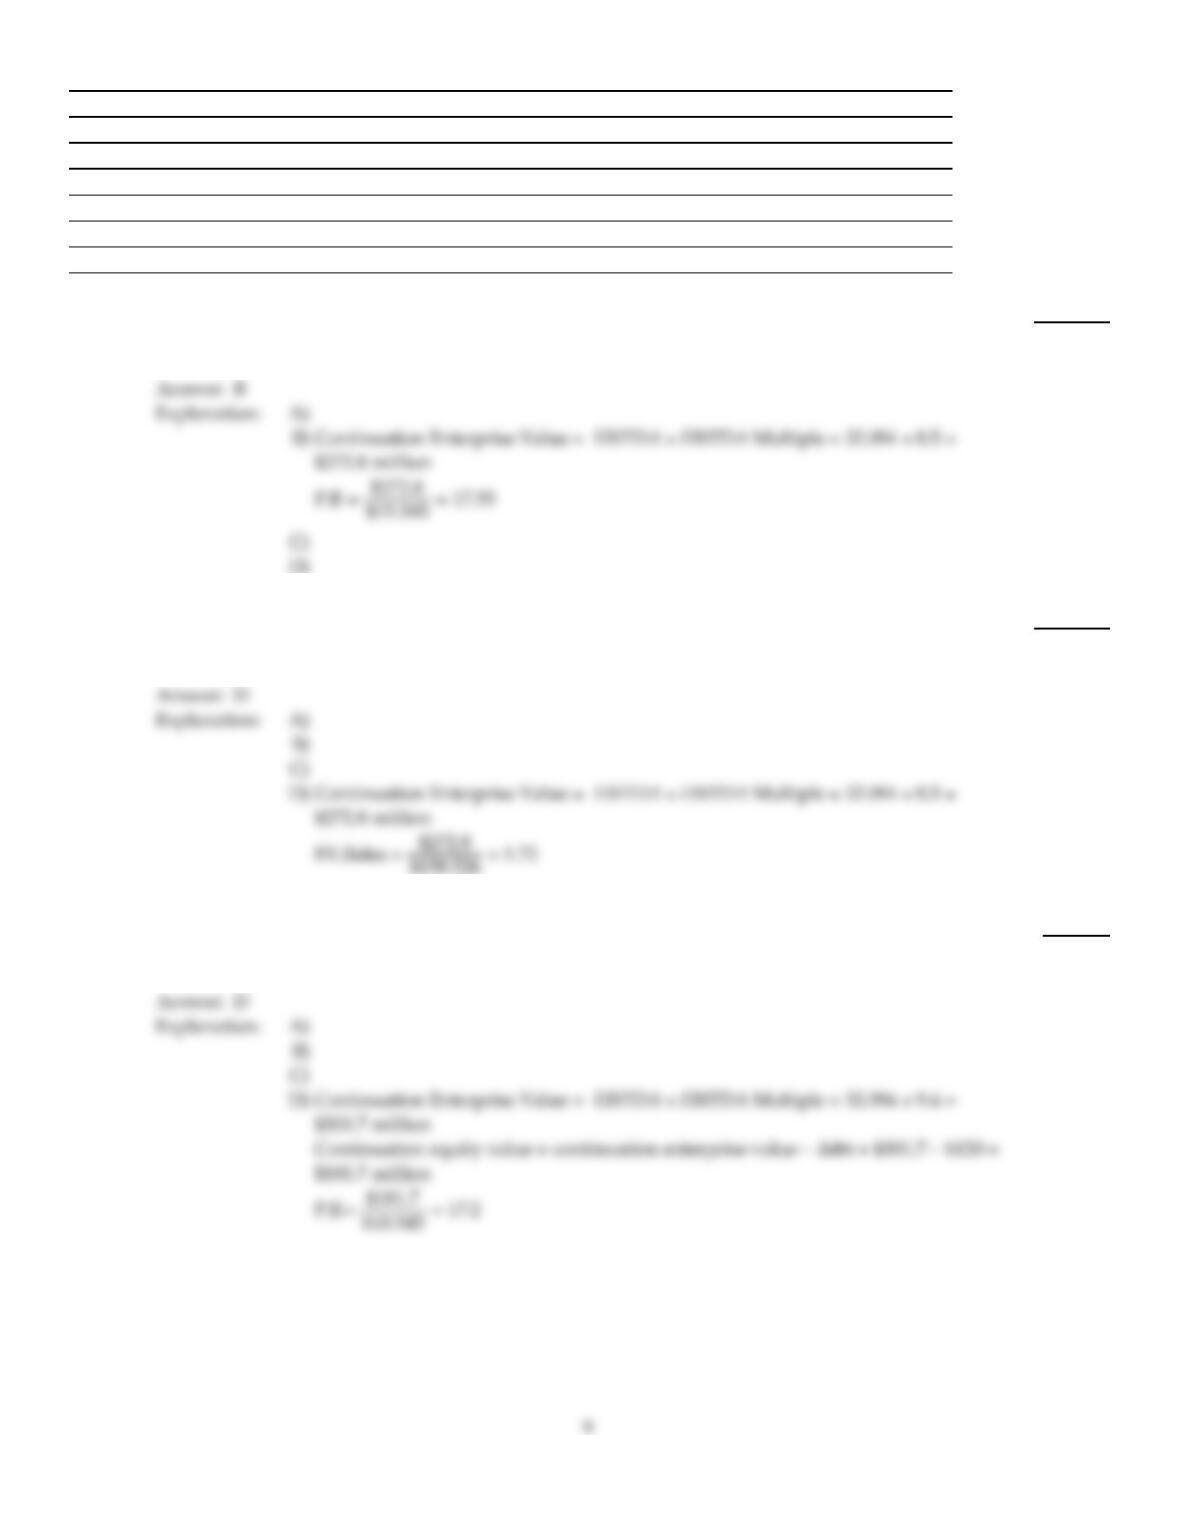
Assuming that Ideko has a EBITDA multiple of 8.5, then the continuation EV/Sales ratio of Ideko in
2010 is closest to:
9)
A)
1.8
B)
1.6
C)
1.9
D)
1.7
10)
Assuming that Ideko has a EBITDA multiple of 9.4, then the continuation levered P/E ratio of Ideko
in 2010 is closest to:
10)
A)
14.5
B)
19.0
C)
16.4
D)
17.2
Use the table for the question(s) below.
Capital Structure and Unlevered Beta Estimates for Comparable Firms
Firm
E
E +
D
D
E +
D EDU
Oakley 1.00 0.00 1.50 – – – 1.50
Luxottica 0.83 0.17 0.75 00.62
Nike 1.05 –0.05 0.60 00.63
11)
If the risk–free rate of interest is 6% and the market risk premium has historically averaged 5%,
then the cost of capital for Luxottica is closest to:
11)
A)
14.7%
B)
10.2%
C)
9.1%
D)
13.5%
Use the tables for the question(s) below.
Pro Forma Income Statement for Ideko, 2005–2010
Year 2005 2006 2007 2008 2009 2010
Income Statement ($ 000)
1 Sales 75,000 88,358 103,234 119,777 138,149 158,526
2 Cost of Goods Sold
3 Raw Materials (16,000) (18,665) (21,593) (24,808) (28,333) (32,193)
4 Direct Labor Costs (18,000) (21,622) (25,757) (30,471) (35,834) (41,925)
5 Gross Profit 41,000 48,071 55,883 64,498 73,982 84,407
6 Sales and Marketing (11,250) (14,579) (18,582) (23,356) (27,630) (31,705)
7 Administrative (13,500) (13,254) (15,485) (16,769) (17,959) (20,608)
8 EBITDA 16,250 20,238 21,816 24,373 28,393 32,094
9 Depreciation (5,500) (5,450) (5,405) (6,865) (7,678) (7,710)
10 EBIT 10,750 14,788 16,411 17,508 20,715 24,383
11 Interest Expense (net) (75) (6,800) (6,800) (6,800) (7,820) (8,160)
12 Pretax Income 10,675 7,988 9,611 10,708 12,895 16,223
13 Income Tax (3,736) (2,796) (3,364) (3,748) (4,513) (5,678)
14 Net Income 6,939 5,193 6,247 6,960 8,382 10,545
Pro Forma Balance Sheet for Ideko, 2005–2010
Year 2005 2006 2007 2008 2009 2010
Balance Sheet ($ 000)
Assets
1 Cash and Cash Equivalents 6,164 7,262 8,485 9,845 11,355 13,030
2 Accounts Receivable 18,493 14,525 16,970 19,689 22,709 26,059
3 Inventories 6,165 6,501 7,613 8,854 10,240 11,784
4 Total Current Assets 30,822 28,288 33,067 38,388 44,304 50,872
5 Property, Plant, and Equipment 49,500 49,050 48,645 61,781 69,102 69,392
6 Goodwill 72,332 72,332 72,332 72,332 72,332 72,332
10
6 Goodwill 72,332 72,332 72,332 72,332 72,332 72,332
7 Total Assets 152,654 149,670 154,044 172,501 185,738 192,597
Liabilities
8 Accounts Payable 4,654 5,532 6,648 7,879 9,110 10,448
9 Debt 100,000 100,000 100,000 115,000 120,000 120,000
10 Total Liabilities 104,654 105,532 106,648 122,879 129,110 130,448
Stockholder’s Equity
11 Starting Stockholder’s Equity 48,000 44,138 47,396 49,621 56,628
12 Net Income 5,193 6,247 6,960 8,382 10,545
13 Dividends (2,000) (9,055) (2,989) (4,735) (1,375) (5,024)
14 Capital Contributions 50,000 – – – – – – – – – – – – —
15 Stockholder’s Equity 48,000 44,138 47,396 49,621 56,628 62,149
16 Total Liabilities and Equity 152,654 149,670 154,044 172,501 185,738 192,597
12)
Assuming that Ideko has a EBITDA multiple of 8.5, then the continuation levered P/E ratio of Ideko
in 2010 is closest to:
12)
A)
19.0
B)
14.5
C)
17.2
D)
16.4
Use the table for the question(s) below.
Pro Forma Income Statement for Ideko, 2005–2010
Year 2005 2006 2007 2008 2009 2010
Income Statement ($ 000)
1 Sales 75,000 88,358 103,234 119,777 138,149 158,526
2 Cost of Goods Sold
3 Raw Materials (16,000) (18,665) (21,593) (24,808) (28,333) (32,193)
4 Direct Labor Costs (18,000) (21,622) (25,757) (30,471) (35,834) (41,925)
5 Gross Profit 41,000 48,071 55,883 64,498 73,982 84,407
6 Sales and Marketing (11,250) (14,579) (18,582) (23,356) (27,630) (31,705)
7 Administrative (13,500) (13,254) (15,485) (16,769) (17,959) (20,608)
8 EBITDA 16,250 20,238 21,816 24,373 28,393 32,094
9 Depreciation (5,500) (5,450) (5,405) (6,865) (7,678) (7,710)
10 EBIT 10,750 14,788 16,411 17,508 20,715 24,383
11 Interest Expense (net) (75) (6,800) (6,800) (6,800) (7,820) (8,160)
12 Pretax Income 10,675 7,988 9,611 10,708 12,895 16,223
13 Income Tax (3,736) (2,796) (3,364) (3,748) (4,513) (5,678)
14 Net Income 6,939 5,193 6,247 6,960 8,382 10,545
13)
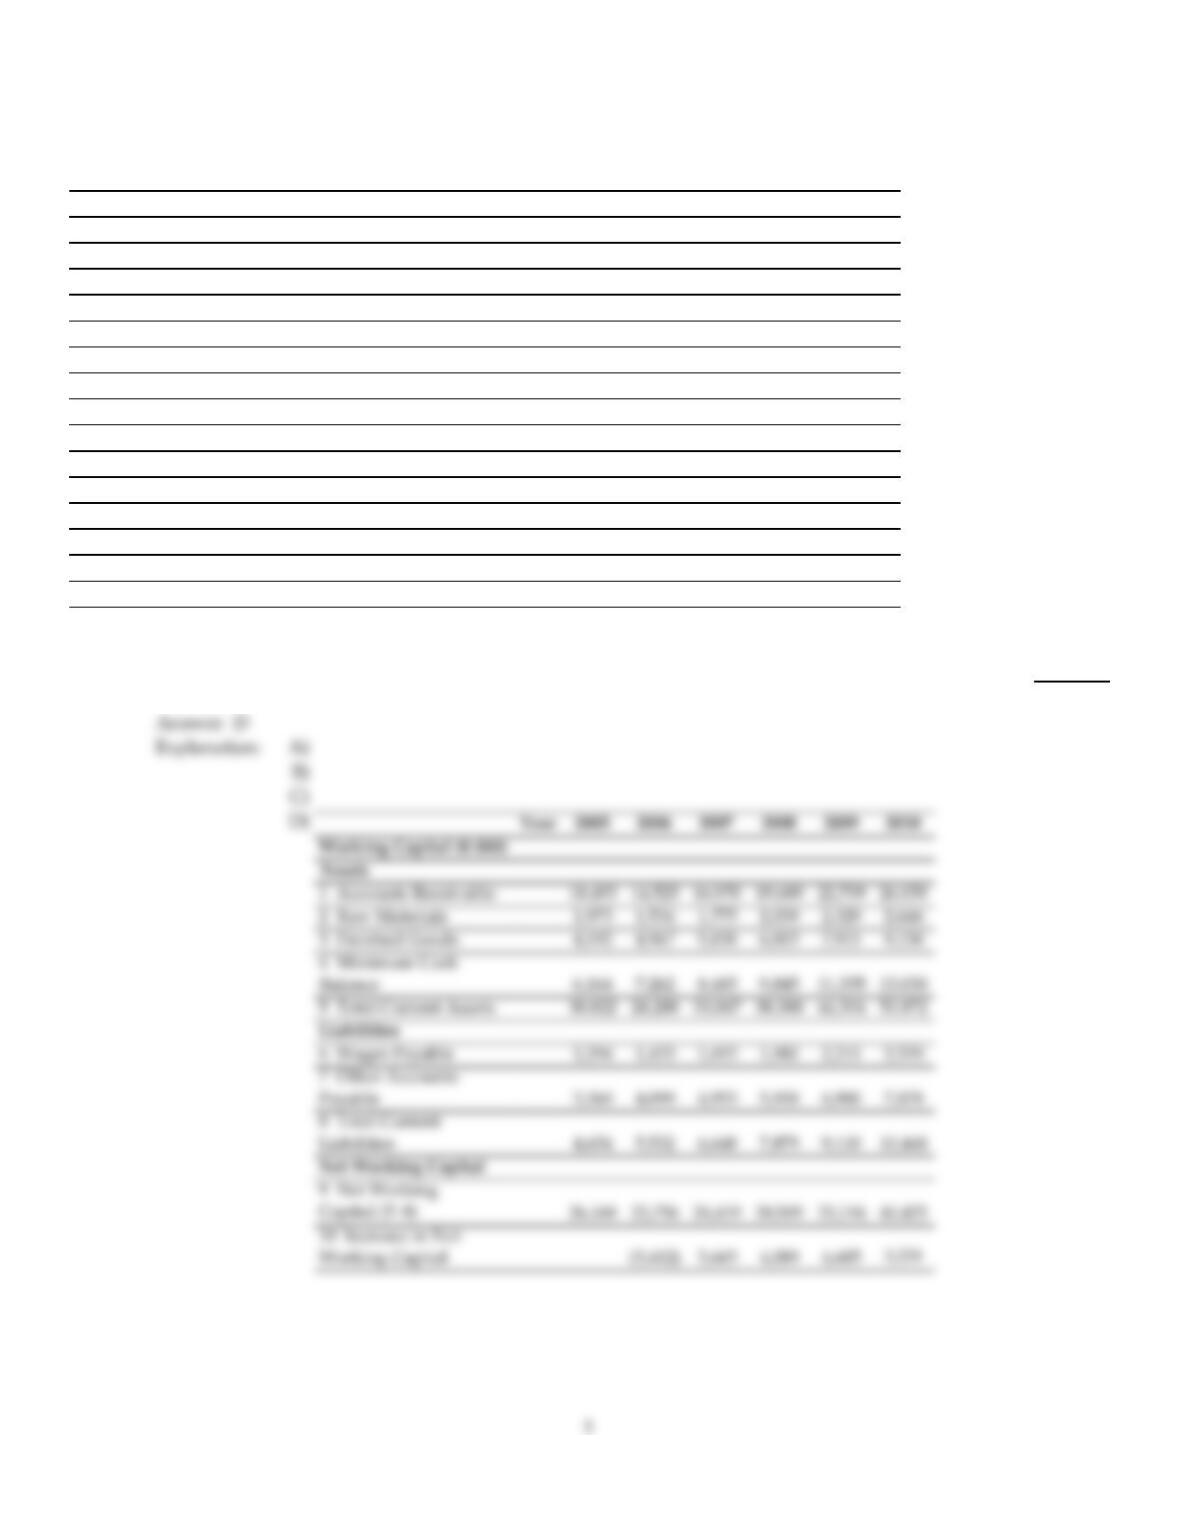
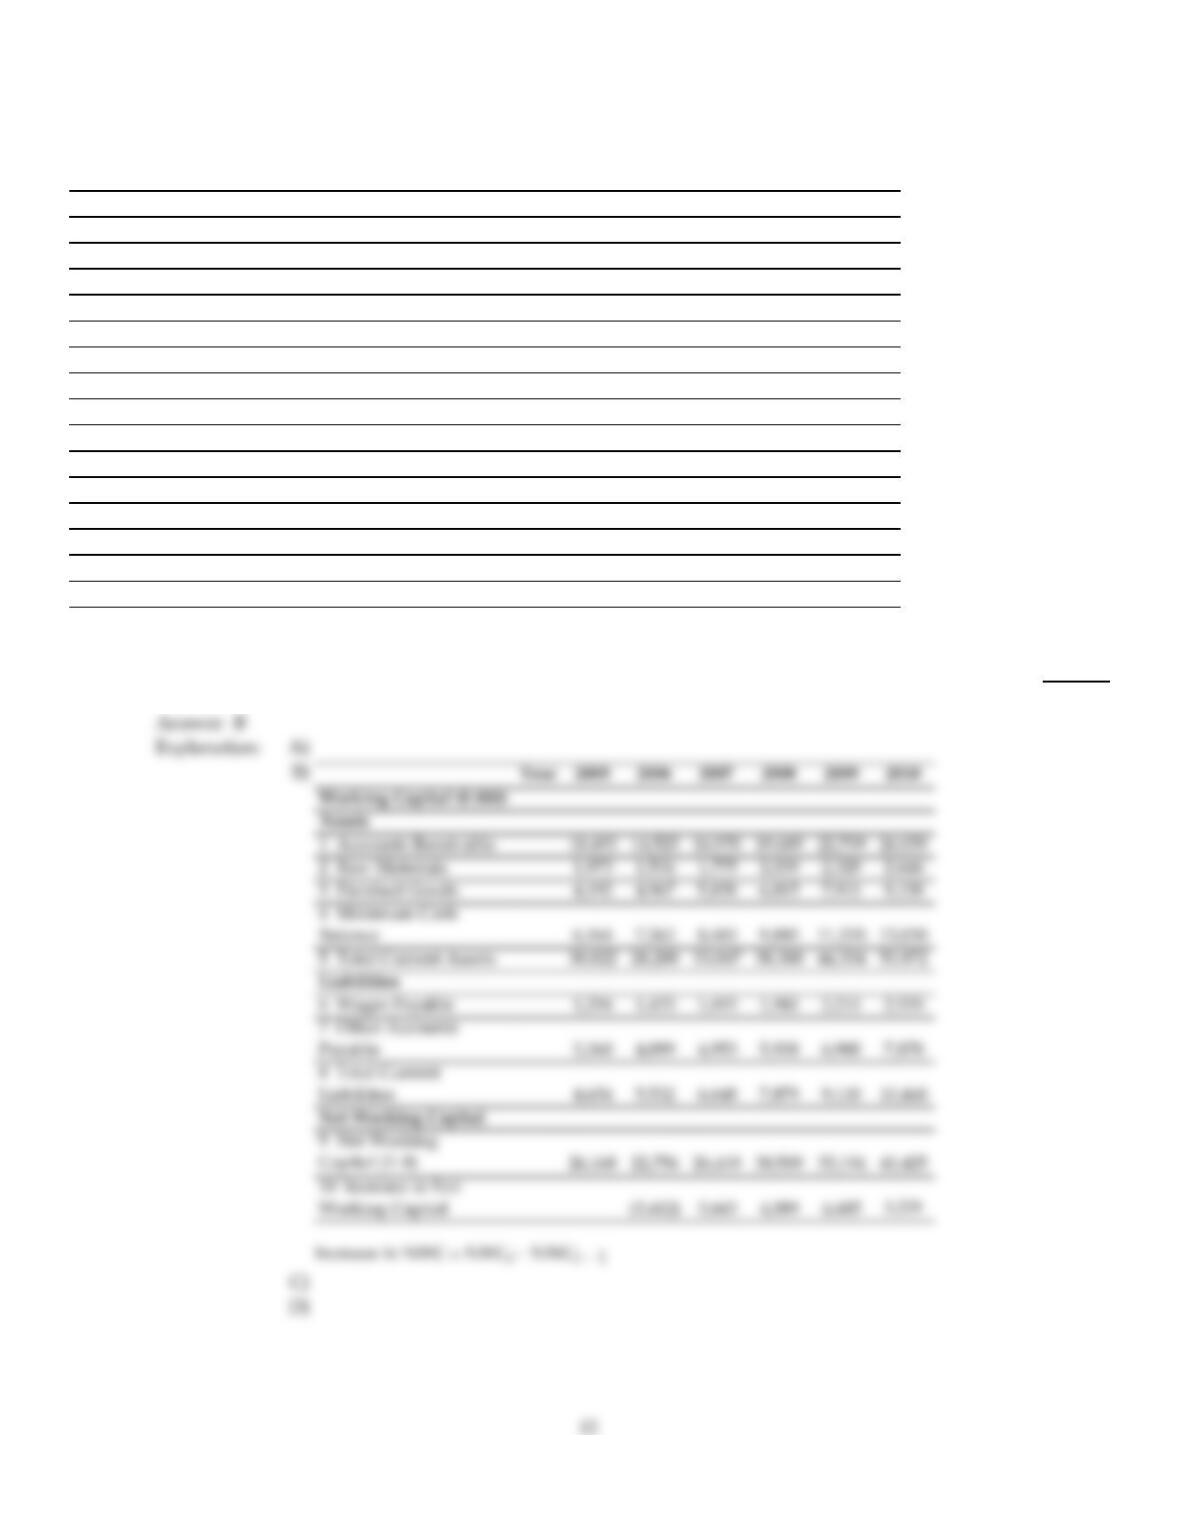
The amount of the increase in net working capital for Ideko in 2007 is closest to:
13)
A)
$4,685
B)
$3,665
C)
$4,090
D)
$5,230
14)
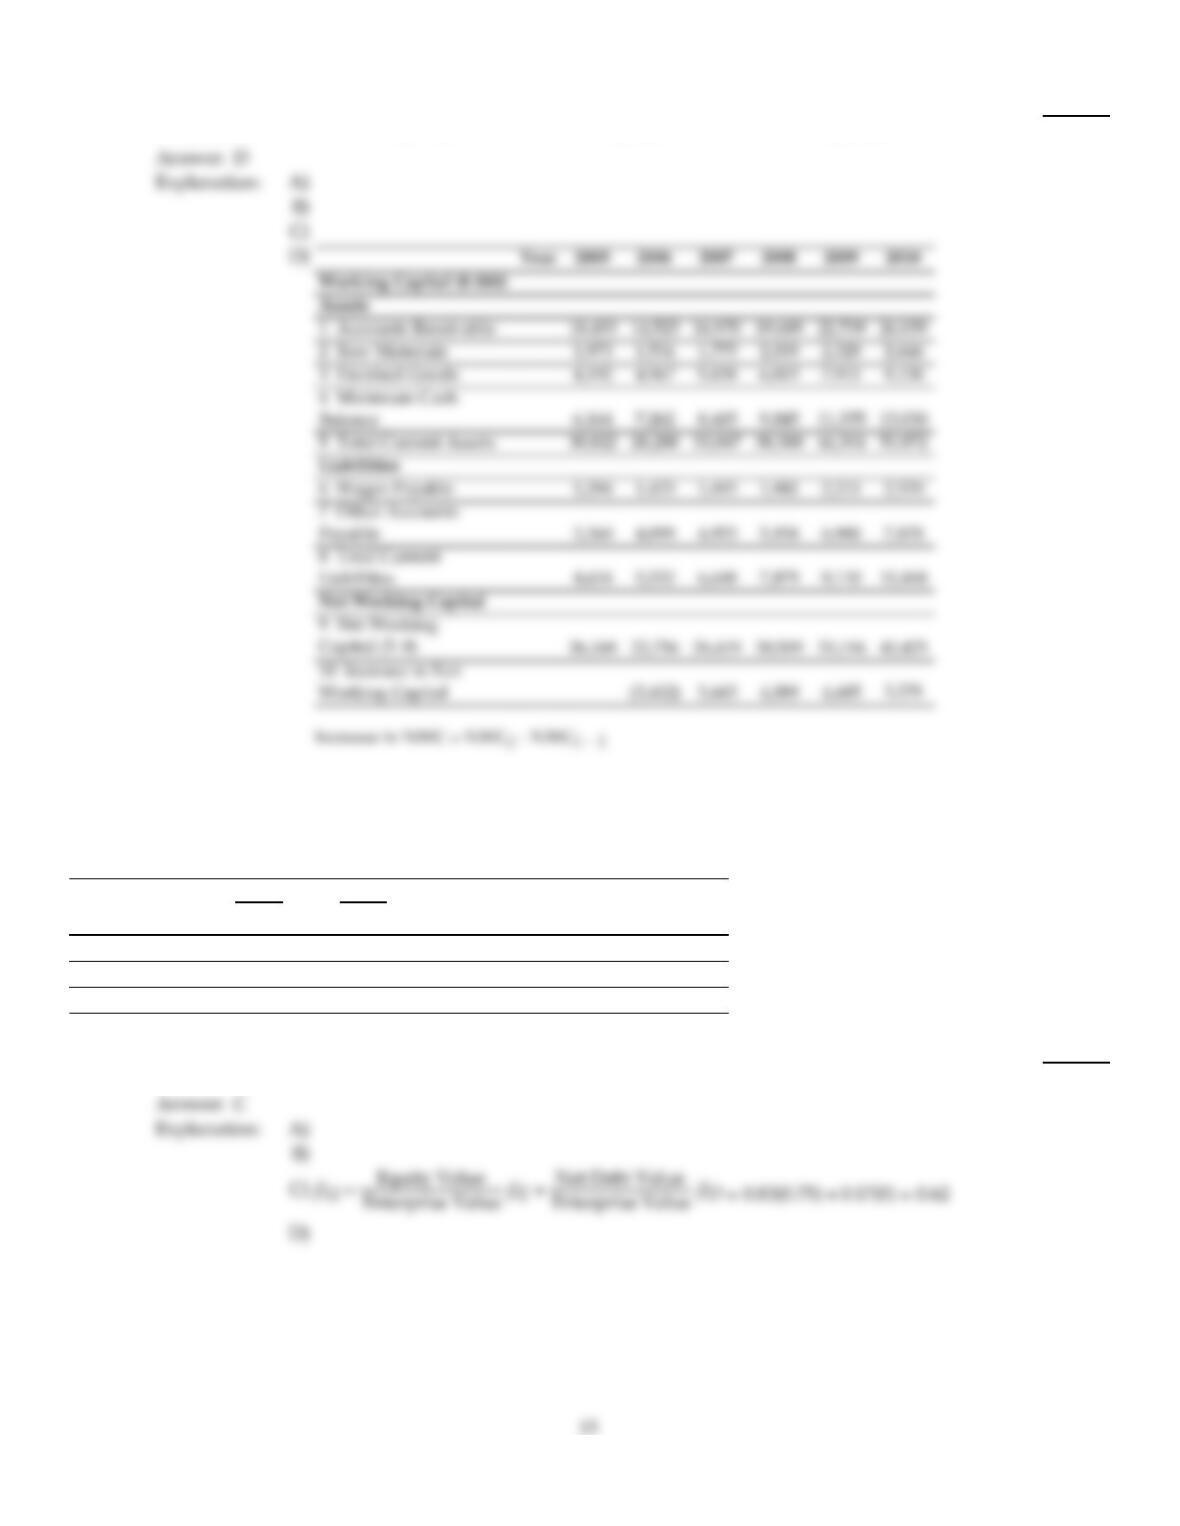
The amount of the increase in net working capital for Ideko in 2008 is closest to:
14)
A)
$3,665
B)
$4,685
C)
$5,230
D)
$4,090
Use the table for the question(s) below.
Capital Structure and Unlevered Beta Estimates for Comparable Firms
Firm
E
E +
D
D
E +
D EDU
Oakley 1.00 0.00 1.50 – – – 1.50
Luxottica 0.83 0.17 0.75 00.62
Nike 1.05 –0.05 0.60 00.63
15)
The unlevered beta for Luxottica is closest to:
15)
A)
0.70
B)
1.50
C)
0.60
D)
1.00
Use the table for the question(s) below.
Ideko Sales and Operating Cost Assumptions
Year 2005 2006 2007 2008 2009 2010
Sales Data Growth/Year
1 Market Size (000 units) 5.0% 10,000 10,500 11,025 11,576 12,155 12,763
2 Market Share 1.0% 10.0% 11.0% 12.0% 13.0% 14.0% 15.0%
3 Average Sales Price
($/unit) 2.0% 75.00 76.50 78.03 79.59 81.18 82.81
Cost of Goods Data
4 Raw Materials ($/unit) 1.0% 16.00 16.16 16.32 16.48 16.65 16.82
5 Direct Labor Costs ($/unit) 4.0% 18.00 18.72 19.47 20.25 21.06 21.90
Operating Expense
and Tax Data
6 Sales and Marketing
(% sales) 15.0% 16.5% 18.0% 19.5% 20.0% 20.0%
7 Administrative (% sales) 18.0% 15.0% 15.0% 14.0% 13.0% 13.0%
8 Tax Rate 35.0% 35.0% 35.0% 35.0% 35.0% 35.0%
16)
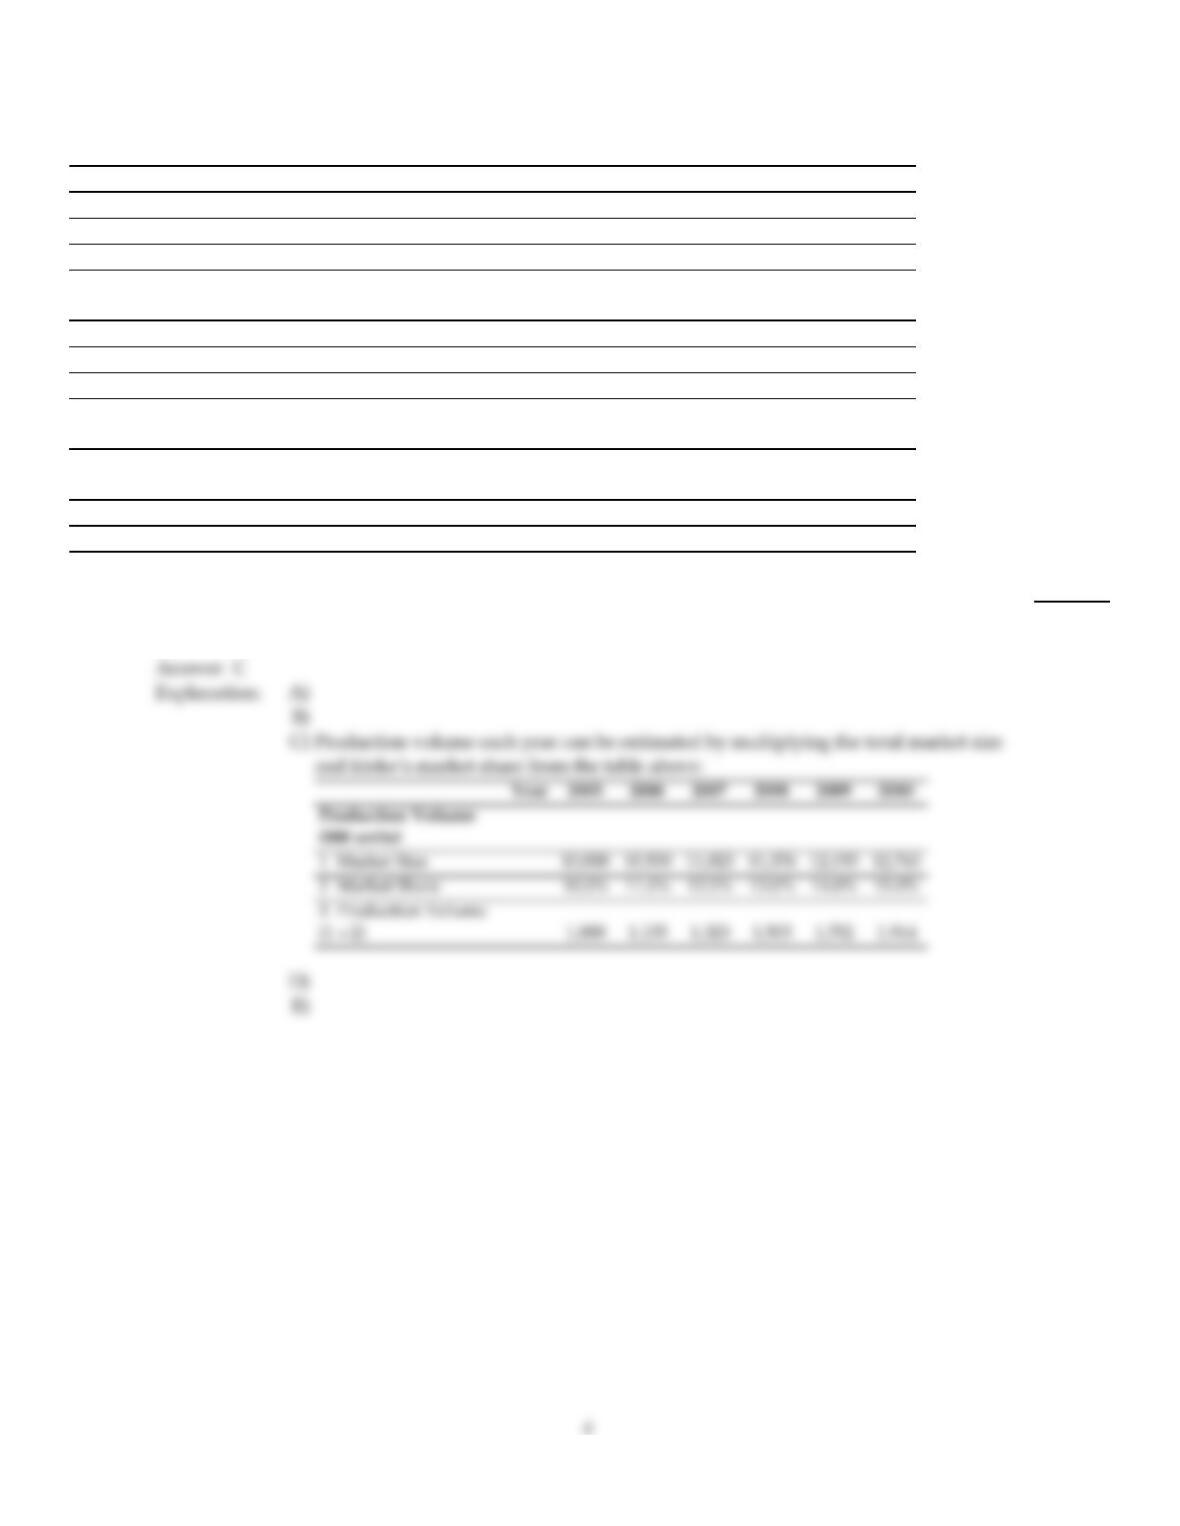
Based upon Ideko’s Sales and Operating Cost Assumptions, what production capacity will Ideko
require in 2007?
16)
A)
1,323 units
B)
1,115 units
C)
1,505 units
D)
1,702 units
E)
1,914 units

Use the table for the question(s) below.
Pro Forma Income Statement for Ideko, 2005–2010
Year 2005 2006 2007 2008 2009 2010
Income Statement ($ 000)
1 Sales 75,000 88,358 103,234 119,777 138,149 158,526
2 Cost of Goods Sold
3 Raw Materials (16,000) (18,665) (21,593) (24,808) (28,333) (32,193)
4 Direct Labor Costs (18,000) (21,622) (25,757) (30,471) (35,834) (41,925)
5 Gross Profit 41,000 48,071 55,883 64,498 73,982 84,407
6 Sales and Marketing (11,250) (14,579) (18,582) (23,356) (27,630) (31,705)
7 Administrative (13,500) (13,254) (15,485) (16,769) (17,959) (20,608)
8 EBITDA 16,250 20,238 21,816 24,373 28,393 32,094
9 Depreciation (5,500) (5,450) (5,405) (6,865) (7,678) (7,710)
10 EBIT 10,750 14,788 16,411 17,508 20,715 24,383
11 Interest Expense (net) (75) (6,800) (6,800) (6,800) (7,820) (8,160)
12 Pretax Income 10,675 7,988 9,611 10,708 12,895 16,223
13 Income Tax (3,736) (2,796) (3,364) (3,748) (4,513) (5,678)
14 Net Income 6,939 5,193 6,247 6,960 8,382 10,545
15
17)
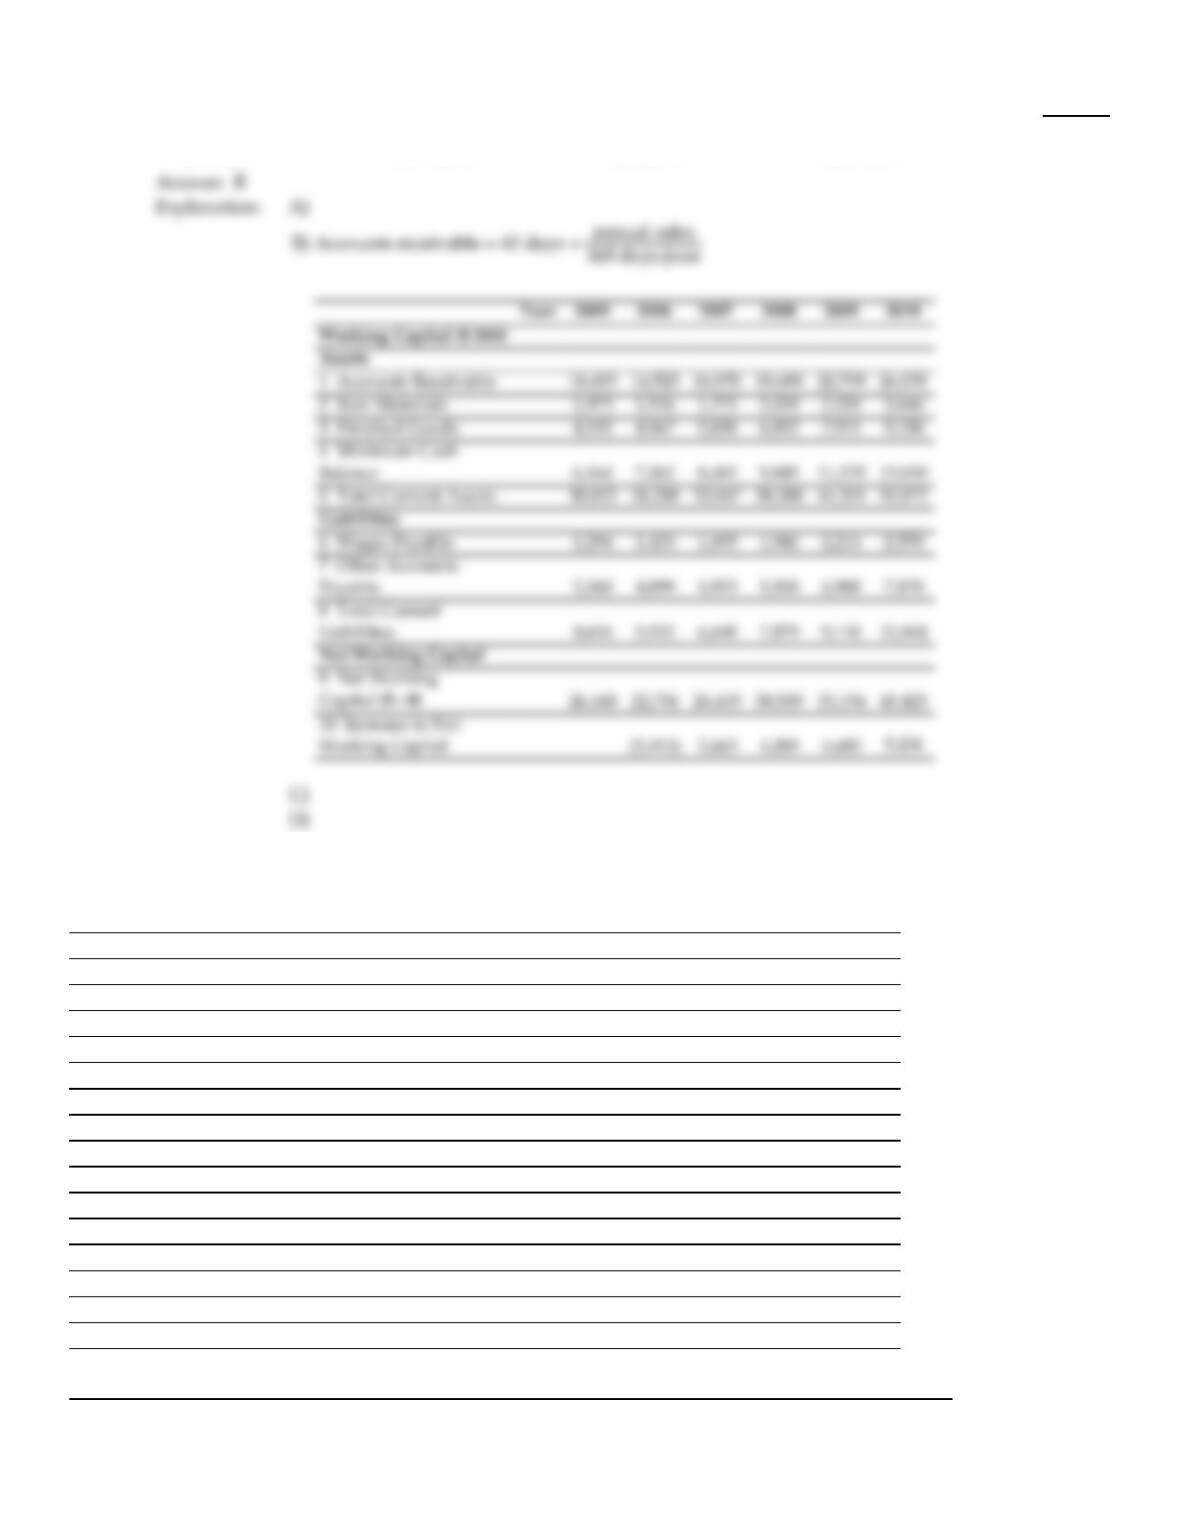
With the proper changes it is believed that Ideko’s credit policies will allow for an account
receivables days of 60. The forecasted accounts receivable for Ideko in 2006 is closest to:
17)
A)
$16,970
B)
$14,525
C)
22,710
D)
$19,690
Use the tables for the question(s) below.
Pro Forma Income Statement for Ideko, 2005–2010
Year 2005 2006 2007 2008 2009 2010
Income Statement ($ 000)
1 Sales 75,000 88,358 103,234 119,777 138,149 158,526
2 Cost of Goods Sold
3 Raw Materials (16,000) (18,665) (21,593) (24,808) (28,333) (32,193)
4 Direct Labor Costs (18,000) (21,622) (25,757) (30,471) (35,834) (41,925)
5 Gross Profit 41,000 48,071 55,883 64,498 73,982 84,407
6 Sales and Marketing (11,250) (14,579) (18,582) (23,356) (27,630) (31,705)
7 Administrative (13,500) (13,254) (15,485) (16,769) (17,959) (20,608)
8 EBITDA 16,250 20,238 21,816 24,373 28,393 32,094
9 Depreciation (5,500) (5,450) (5,405) (6,865) (7,678) (7,710)
10 EBIT 10,750 14,788 16,411 17,508 20,715 24,383
11 Interest Expense (net) (75) (6,800) (6,800) (6,800) (7,820) (8,160)
12 Pretax Income 10,675 7,988 9,611 10,708 12,895 16,223
13 Income Tax (3,736) (2,796) (3,364) (3,748) (4,513) (5,678)
14 Net Income 6,939 5,193 6,247 6,960 8,382 10,545
Pro Forma Balance Sheet for Ideko, 2005–2010
Year 2005 2006 2007 2008 2009 2010
16
Year 2005 2006 2007 2008 2009 2010
Balance Sheet ($ 000)
Assets
1 Cash and Cash Equivalents 6,164 7,262 8,485 9,845 11,355 13,030
2 Accounts Receivable 18,493 14,525 16,970 19,689 22,709 26,059
3 Inventories 6,165 6,501 7,613 8,854 10,240 11,784
4 Total Current Assets 30,822 28,288 33,067 38,388 44,304 50,872
5 Property, Plant, and Equipment 49,500 49,050 48,645 61,781 69,102 69,392
6 Goodwill 72,332 72,332 72,332 72,332 72,332 72,332
7 Total Assets 152,654 149,670 154,044 172,501 185,738 192,597
Liabilities
8 Accounts Payable 4,654 5,532 6,648 7,879 9,110 10,448
9 Debt 100,000 100,000 100,000 115,000 120,000 120,000
10 Total Liabilities 104,654 105,532 106,648 122,879 129,110 130,448
Stockholder’s Equity
11 Starting Stockholder’s Equity 48,000 44,138 47,396 49,621 56,628
12 Net Income 5,193 6,247 6,960 8,382 10,545
13 Dividends (2,000) (9,055) (2,989) (4,735) (1,375) (5,024)
14 Capital Contributions 50,000 – – – – – – – – – – – – —
15 Stockholder’s Equity 48,000 44,138 47,396 49,621 56,628 62,149
16 Total Liabilities and Equity 152,654 149,670 154,044 172,501 185,738 192,597
18)
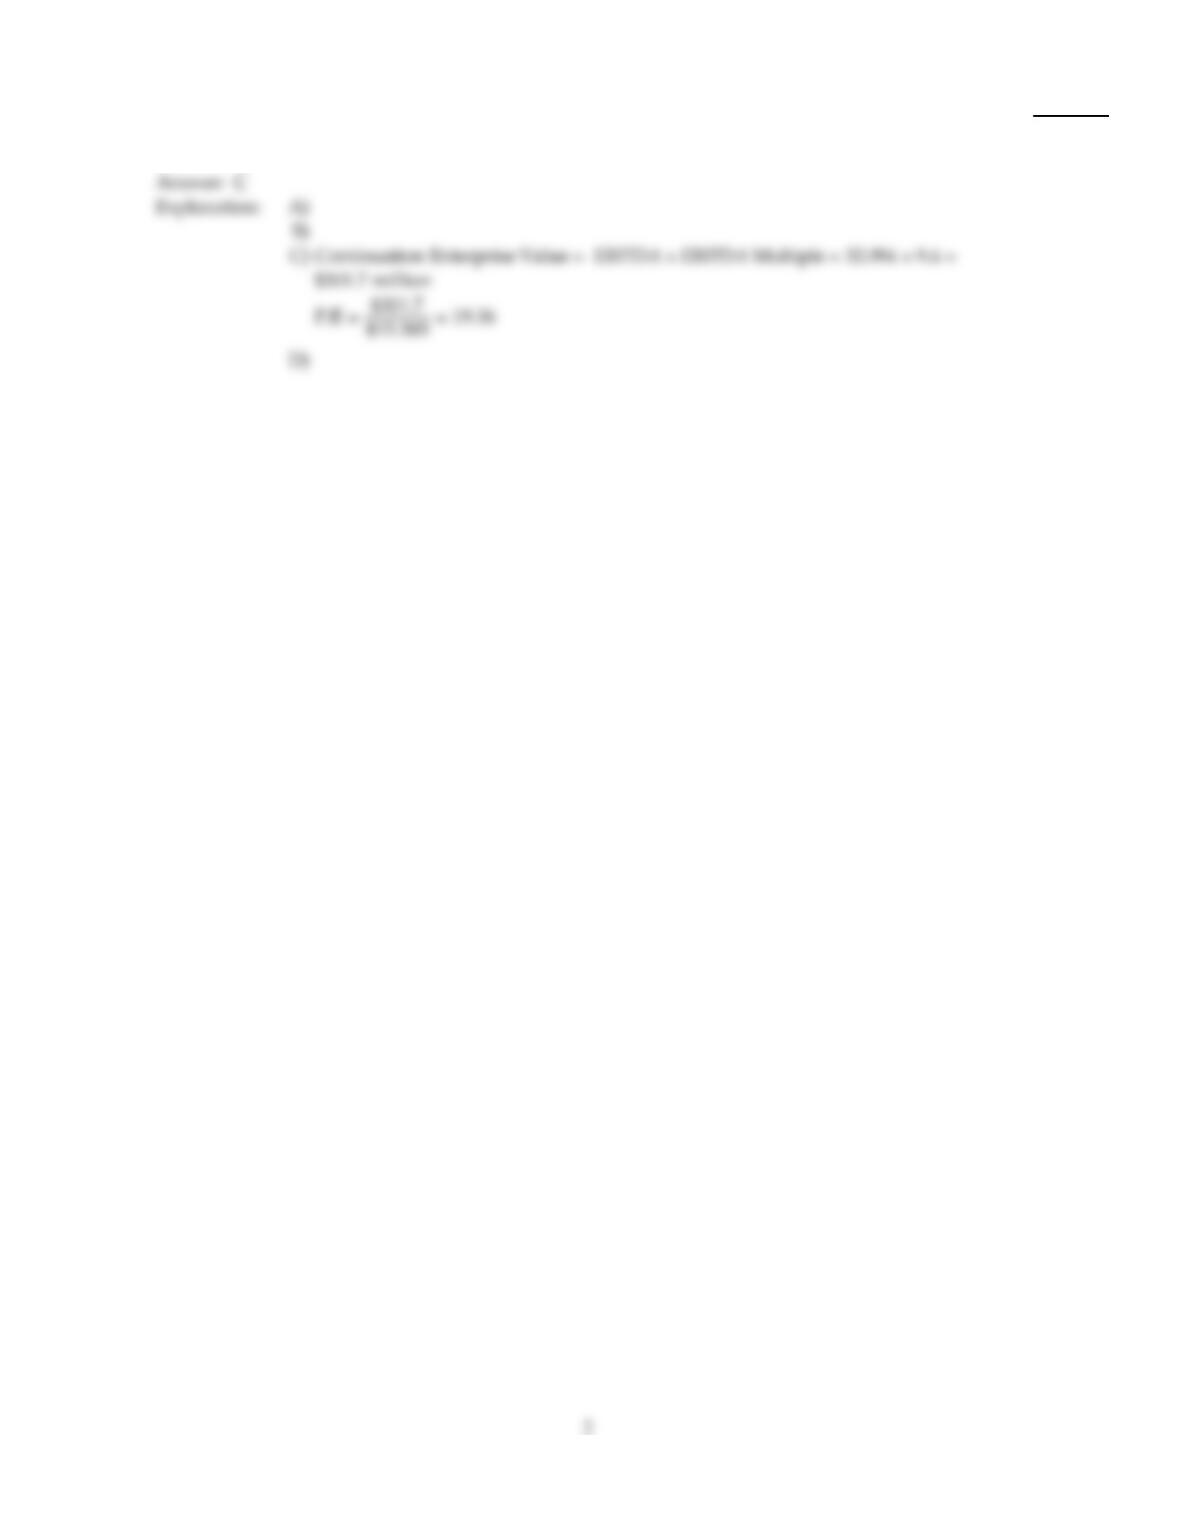
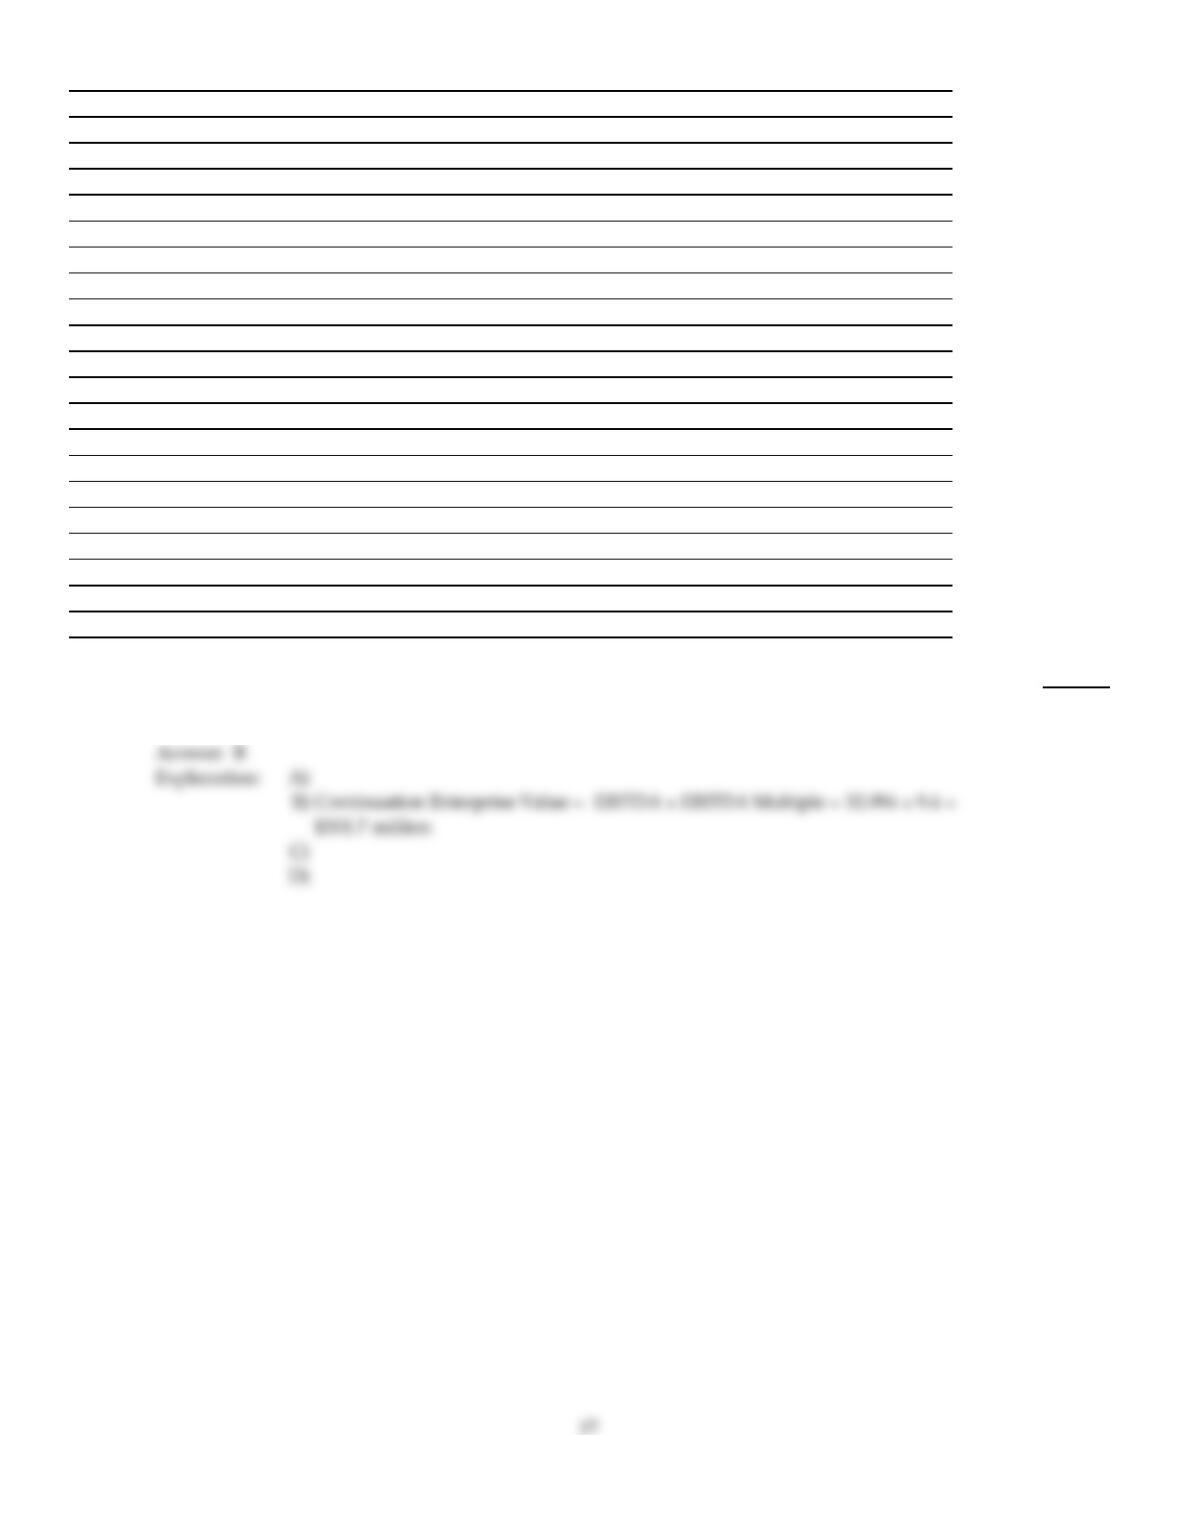
Assuming that Ideko has a EBITDA multiple of 9.4, then the continuation enterprise value of Ideko
in 2010 is closest to:
18)
A)
$152.8 million
B)
$301.7 million
C)
$181.7 million
D)
$272.8 million
Use the table for the question(s) below.
Ideko Sales and Operating Cost Assumptions
Year 2005 2006 2007 2008 2009 2010
Sales Data Growth/Year
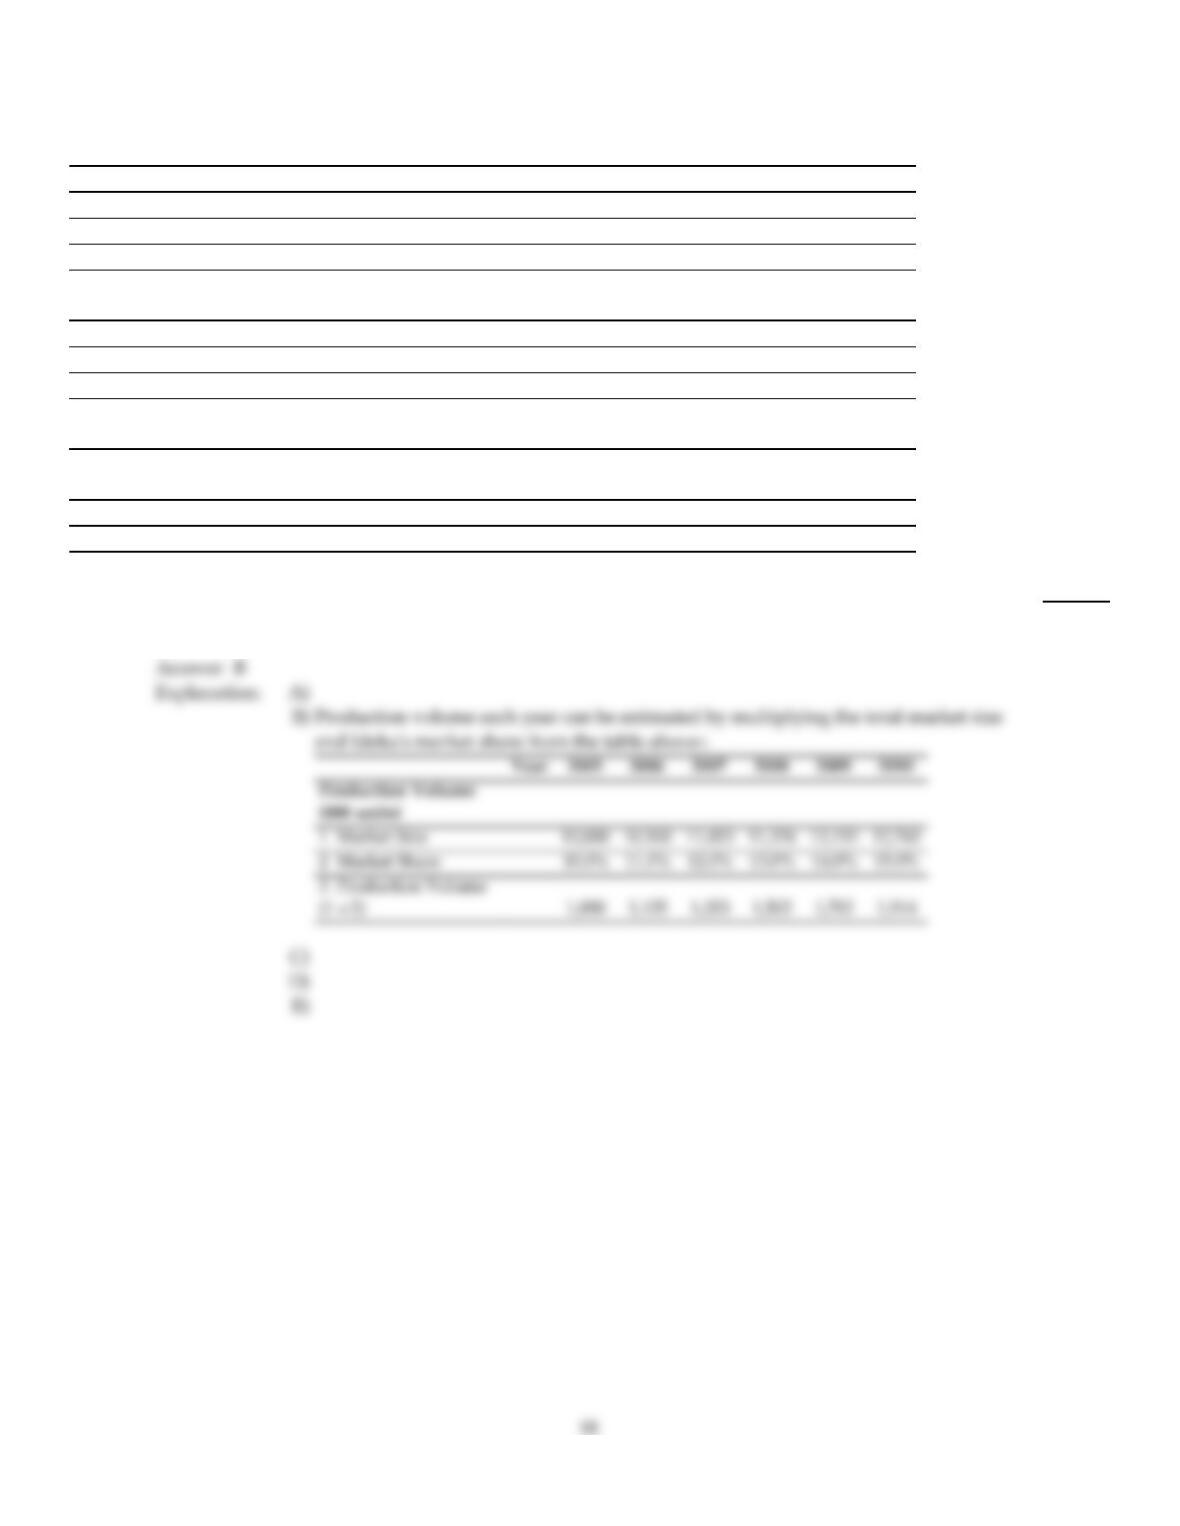
1 Market Size (000 units) 5.0% 10,000 10,500 11,025 11,576 12,155 12,763
2 Market Share 1.0% 10.0% 11.0% 12.0% 13.0% 14.0% 15.0%
3 Average Sales Price
($/unit) 2.0% 75.00 76.50 78.03 79.59 81.18 82.81
Cost of Goods Data
4 Raw Materials ($/unit) 1.0% 16.00 16.16 16.32 16.48 16.65 16.82
5 Direct Labor Costs ($/unit) 4.0% 18.00 18.72 19.47 20.25 21.06 21.90
Operating Expense
and Tax Data
6 Sales and Marketing
(% sales) 15.0% 16.5% 18.0% 19.5% 20.0% 20.0%
7 Administrative (% sales) 18.0% 15.0% 15.0% 14.0% 13.0% 13.0%
8 Tax Rate 35.0% 35.0% 35.0% 35.0% 35.0% 35.0%
19)
Based upon Ideko’s Sales and Operating Cost Assumptions, what production capacity will Ideko
require in 2008?
19)
A)
1,914 units
B)
1,505 units
C)
1,115 units
D)
1,323 units
E)
1,702 units
Use the table for the question(s) below.
Capital Structure and Unlevered Beta Estimates for Comparable Firms
Firm
E
E +
D
D
E +
D EDU
Oakley 1.00 0.00 1.50 – – – 1.50
Luxottica 0.83 0.17 0.75 00.62
Nike 1.05 –0.05 0.60 00.63
20)
If the risk–free rate of interest is 6% and the market risk premium has historically averaged 5%,
then the cost of capital for Oakley is closest to:
20)
A)
14.7%
B)
10.2%
C)
13.5%
D)
9.1%