8) Refer to Figure 18-1. Area F+G represents
A) the portion of sales tax revenue borne by consumers.
B) the portion of sales tax revenue borne by producers.
C) the excess burden of the sales tax.
D) sales tax revenue collected by the government.
9) Refer to Figure 18-1. Area E+H represents
A) the portion of sales tax revenue borne by consumers.
B) the portion of sales tax revenue borne by producers.
C) the excess burden of the sales tax.
D) sales tax revenue collected by the government.
10) Which of the following statements concerning the federal corporate income tax is true?
A) It is an efficient tax because it imposes a small excess burden relative to the tax revenue it
raises.
B) The incidence of the corporate income tax can be determined by using demand and supply
analysis.
C) Determining the incidence of the corporate income tax is complicated because it is not certain
how corporations respond to the tax.
D) The corporate income tax is an example of the benefits-received principle.
11) Most economists agree that some of the burden of the corporate income tax
A) is reduced because the tax is progressive.
B) is shared by the federal government.
C) is reduced because the tax is used to attain a social objective.
D) is passed on to consumers in the form of higher prices.
12) A study by the Congressional Budget Office (CBO) regarding the corporate income tax
included the following statement: “A corporation may write its check to the Internal Revenue
Service for payment of the corporate income tax, but the money must come from somewhere…”
The comments that followed this statement argued that
A) corporations pass on some of the burden of the tax to investors in the company, to workers,
and to consumers.
B) the corporate income tax is a reliable source of revenue because corporations cannot avoid
paying the tax.
C) it is necessary to retain the tax because it is based on the ability-to-pay principle.
D) the tax is more progressive than the individual income tax.
13) “For a given supply curve, the excess burden of a tax will be greater when the demand for a
product is less elastic than when the demand is more elastic.” This statement is
A) correct.
B) incorrect because the incidence of the tax, not the burden of the tax, is affected by the
elasticity of demand.
C) incorrect. When demand is less elastic, the burden of the tax is smaller than when the demand
is more elastic.
D) incorrect. The statement confuses demand with quantity demanded.
14) For a given supply curve, how does the elasticity of demand affect the burden of a tax
imposed on a product?
A) The excess burden of the tax will be minimized when the demand is unit-elastic.
B) The excess burden of the tax will be greater when the elasticity of supply is greater than the
elasticity of demand.
C) The excess burden of the tax will be greater when the demand is less elastic than when it is
more elastic.
D) The excess burden of the tax will be greater when the demand is more elastic than when it is
less elastic.
15) The actual division of a tax between buyers and sellers in a market is the excess burden of
the tax.
16) The person or firm that pays a tax bears the burden of the tax.
17) When the demand for a product is less elastic than the supply, consumers pay the majority of
the tax on the product.
18) What is meant by “tax incidence”?
19) Explain why it is more difficult to determine the incidence of the corporate income tax than
it is to determine the incidence of the tax on gasoline.
20) If grocery stores were legally required to charge a 10-cent fee for disposable grocery bags,
who would bear the largest burden of this fee?
45
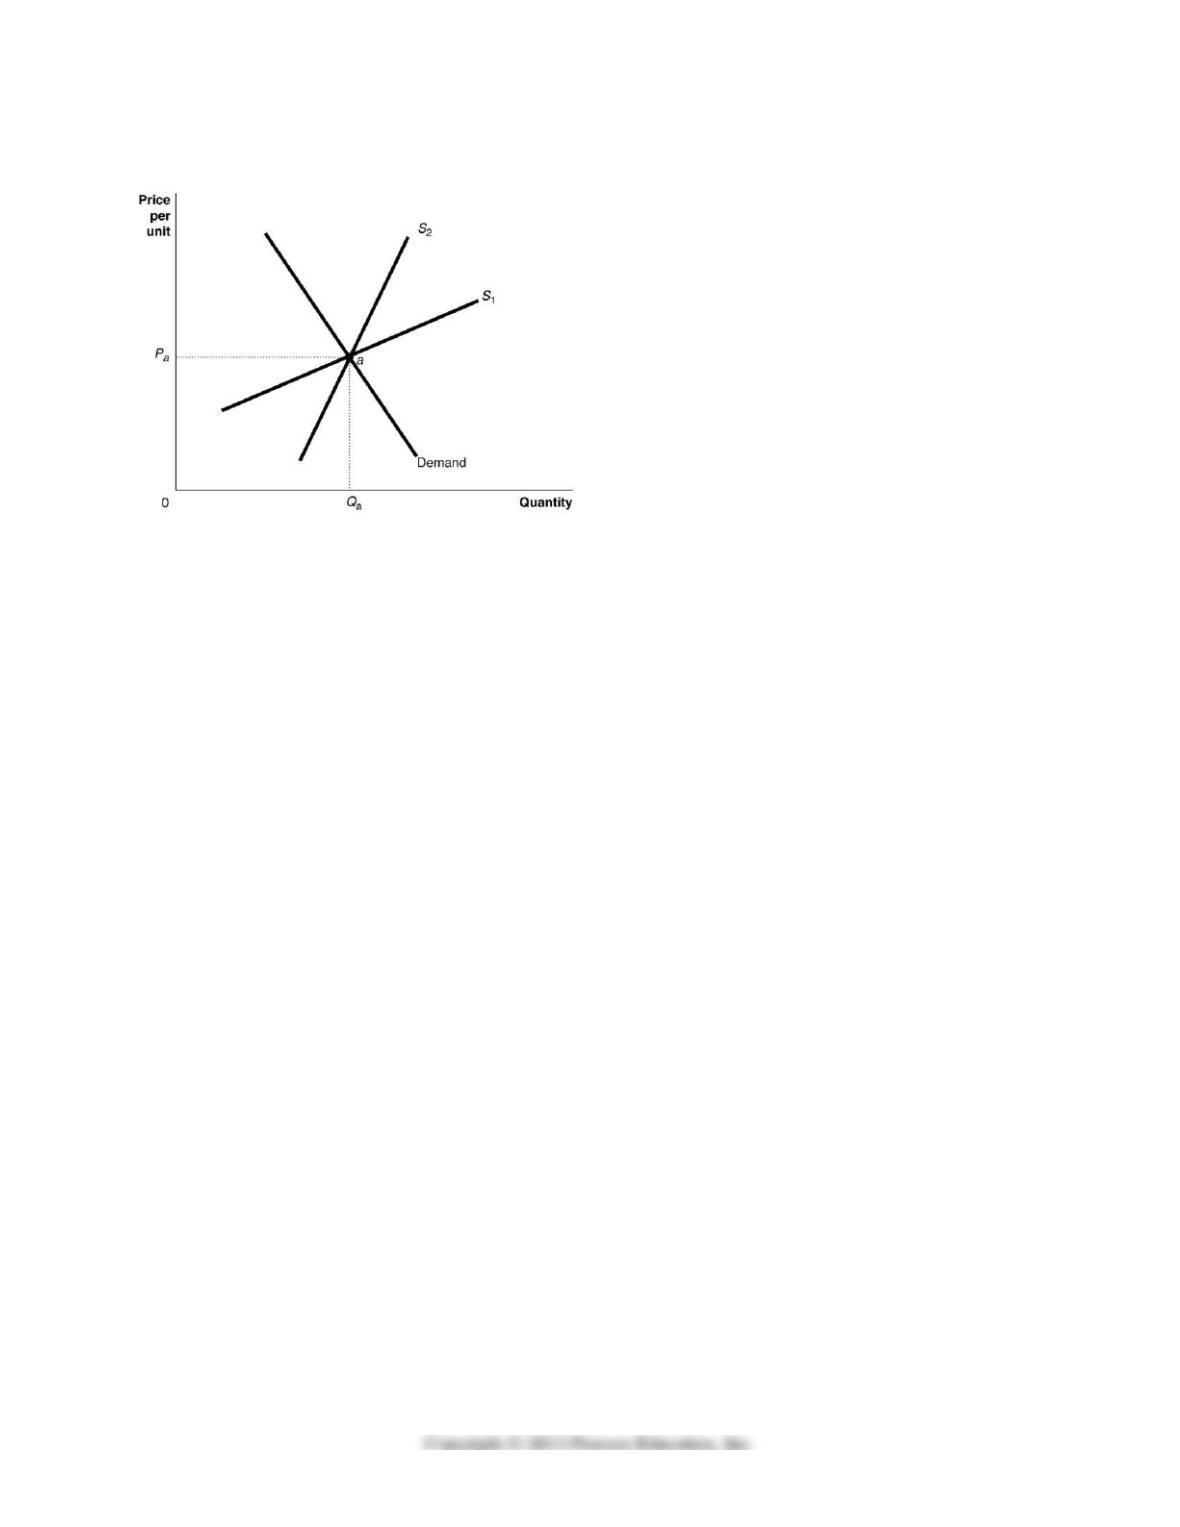
Figure 18-2
21) Refer to Figure 18-2. The figure above shows a demand curve and two supply curves, one
more elastic than the other. Use Figure 18-2 to answer the following questions.
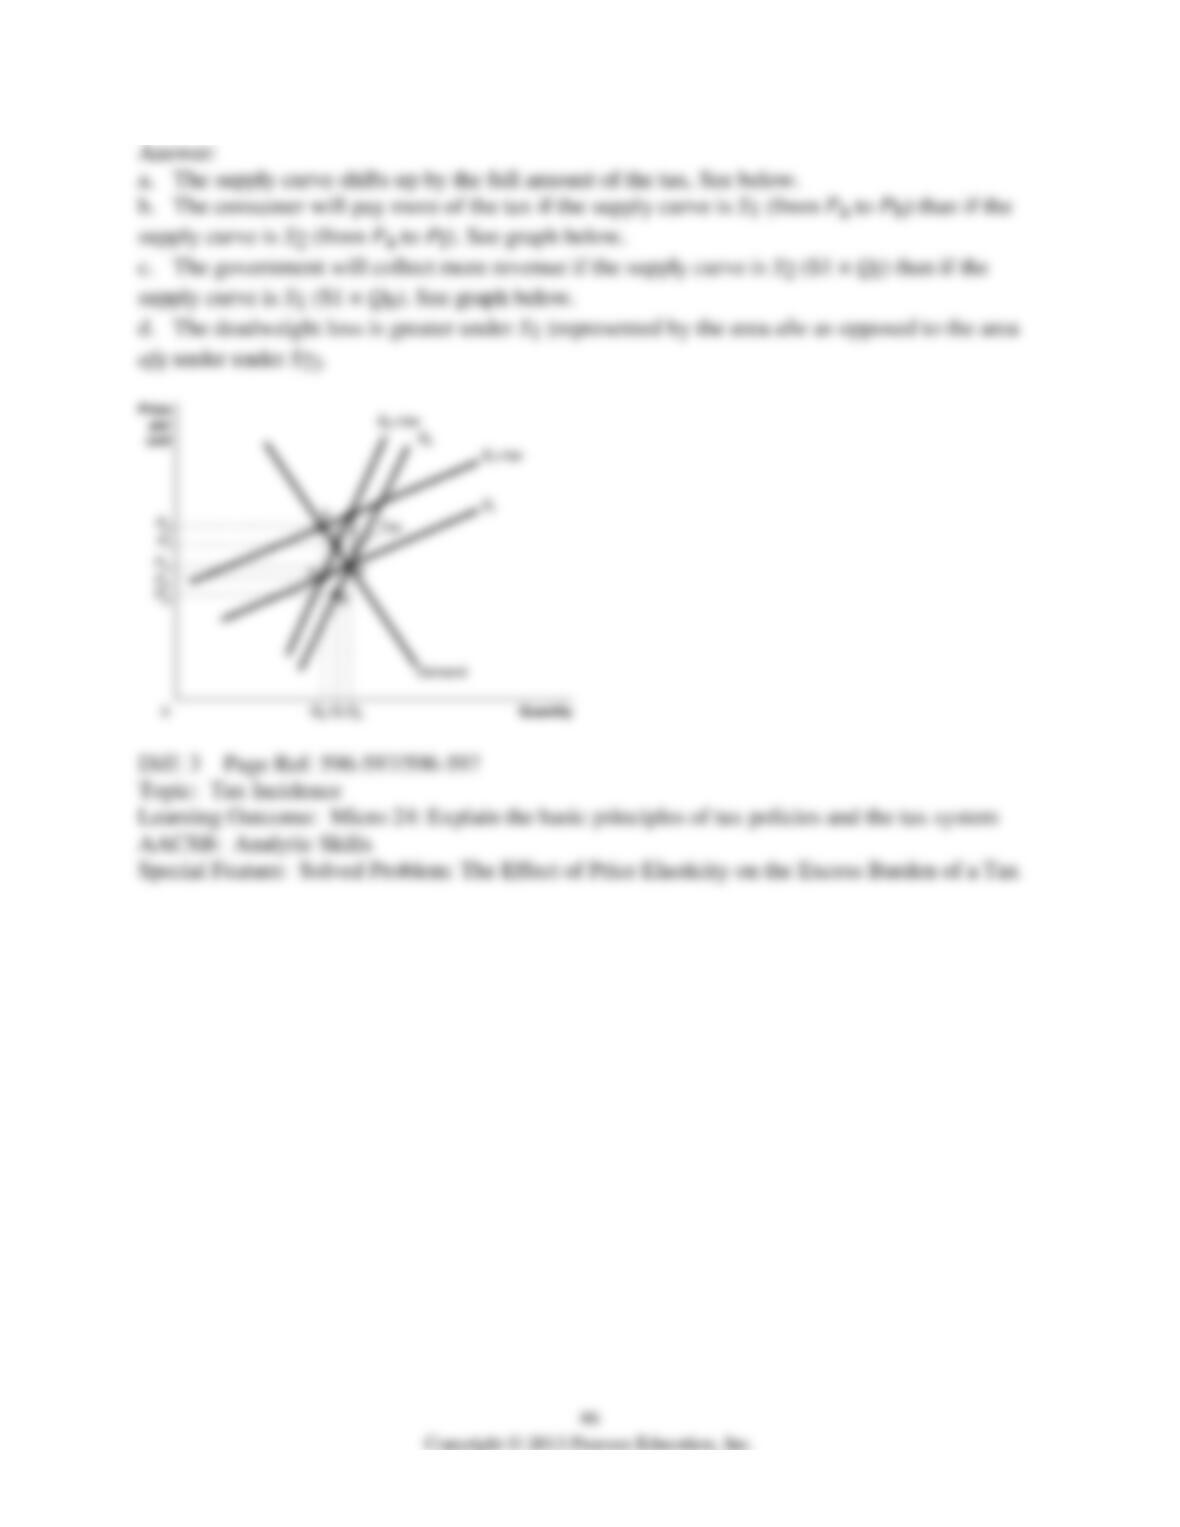
a. Suppose the government imposes an excise tax of $1.00 on every unit sold. Use the graph to
illustrate the impact of this tax.
b. If the government imposes an excise tax of $1.00 on every unit sold, will the consumer pay
more of the tax if the supply curve is S1 or S2? Refer to the graphs in your answer.
c. If an excise tax of $1.00 on every unit sold is imposed, will the revenue collected by the
government be greater if the supply curve is S1 or S2?
d. If the government imposes an excise tax of $1.00 on every unit sold, will the deadweight loss
be greater if the supply curve is S1 or S2?
18.4 Income Distribution and Poverty
1) Which of the following statements about the distribution of income in the United States is
true?
A) The United States has the most unequal distribution of income of any high-income country in
the world.
B) The United States has a more unequal distribution of income than Bolivia and Botswana.
C) The distribution of income in the United States is fairly equal and there have been no
dramatic changes over time.
D) The distribution of income in the United States is unequal and has become significantly more
unequal over time.
2) Which of the following statements best represents the opinion of many economists regarding
the impact that changes in tax laws have had on recent changes in income inequality in the
United States?
A) Reductions in income tax rates have favored high-income individuals more than low-income
individuals. As a result, reductions in federal income tax rates have led to more income
inequality.
B) Reductions in income tax rates have created greater incentives for low-income individuals to
work, save and invest. As a result, reductions in federal income tax rates have led to less income
inequality.
C) Reductions in income tax rates probably have had little impact on the distribution of income.
D) Reductions in income tax rates have been offset by increases in corporate income tax rates
and payroll taxes. As a result, greater income inequality in the 1990s has been followed by a
more equal distribution of income since 2001.
3) The federal government defines the poverty line as
A) a level of annual income equal to the amount necessary to purchase the minimal quantity of
food required for adequate nutrition.
B) a level of annual income equal to three times the amount of money necessary to purchase the
minimal quantity of food required for adequate nutrition.
C) the average income level of welfare recipients.
D) an annual income of $11,800 for a family of four in 2011.
4) The poverty rate is defined as the percentage of the
A) labor force that is poor according to the federal government’s definition of poverty.
B) population that is exempt from paying federal income taxes.
C) population who qualify to receive welfare payments and food stamps.
D) population that is poor according to the federal government’s definition of poverty.
5) Which of the following groups had the highest poverty rate in 2010 in the United States?
A) Asians
B) White males
C) Hispanics
D) Female heads of families
6) What does a Lorenz curve illustrate?
A) a comparison of the distribution of income in two different countries
B) the distribution of income within a country in a given time period
C) the share of taxes paid by different groups of households
D) the change over time in the percentage of households with incomes that place them below the
poverty line
7) Which of the following summarizes the information provided by a Lorenz curve?
A) the Lorenz coefficient
B) the income distribution ratio
C) the Gini coefficient
D) the slope (the rise divided by the run) of the Lorenz curve at a particular point on the curve
8) A Gini coefficient of ________ means that an income distribution is perfectly equal and a
Gini coefficient of ________ means the income distribution is perfectly unequal.
A) 0; 1
B) 1; 0
C) 0, 100
D) 100, 0
9) Income inequality in the United States has increased somewhat over the past 25 years. Two
factors that appear to have contributed to this are
A) tax cuts on high income individuals and large increases in prices of stocks.
B) strong economic growth and low inflation.
C) rapid technological change and expanding international trade.
D) outsourcing of jobs by U.S. firms and cuts in taxes on capital gains.
10) As a group, people with high incomes are likely to have
A) greater-than-average family inheritances and greater than average SAT scores.
B) greater-than-average holdings of stocks and bonds and lower-than-average productivity.
C) greater-than-average productivity and greater-than-average amounts of capital.
D) a stable marriage and no children.
11) Measures of poverty (for example, the poverty line) and the distribution of income (for
example, the Lorenz curve and the Gini coefficient) are misleading for which of the following
two reasons?
A) First, these measures do not take into account income mobility over time. Second, these
measures ignore the effects of government programs meant to reduce poverty.
B) First, none of these measures are adjusted for inflation. Second, they do not measure income
on a per capita basis.
C) First, these measures fail to include the income U.S. citizens earn working for foreign firms
that have operations located in the United States. Second, these measures fail to include income
foreign citizens earn working for U.S. firms that have operations in foreign countries.
D) First, these measures fail to include dividend and interest income earned on stocks and bonds.
Second, these measures fail to include the value of goods and services citizens make for their
own consumption that are not sold in markets.
12) All Gini coefficients must lie between 0 and 1. The lower the value,
A) the more unequal the income distribution.
B) the closer the income distribution is to being equal.
C) the greater the degree of poverty.
D) the lower the degree of poverty according to the federal government’s definition of poverty.
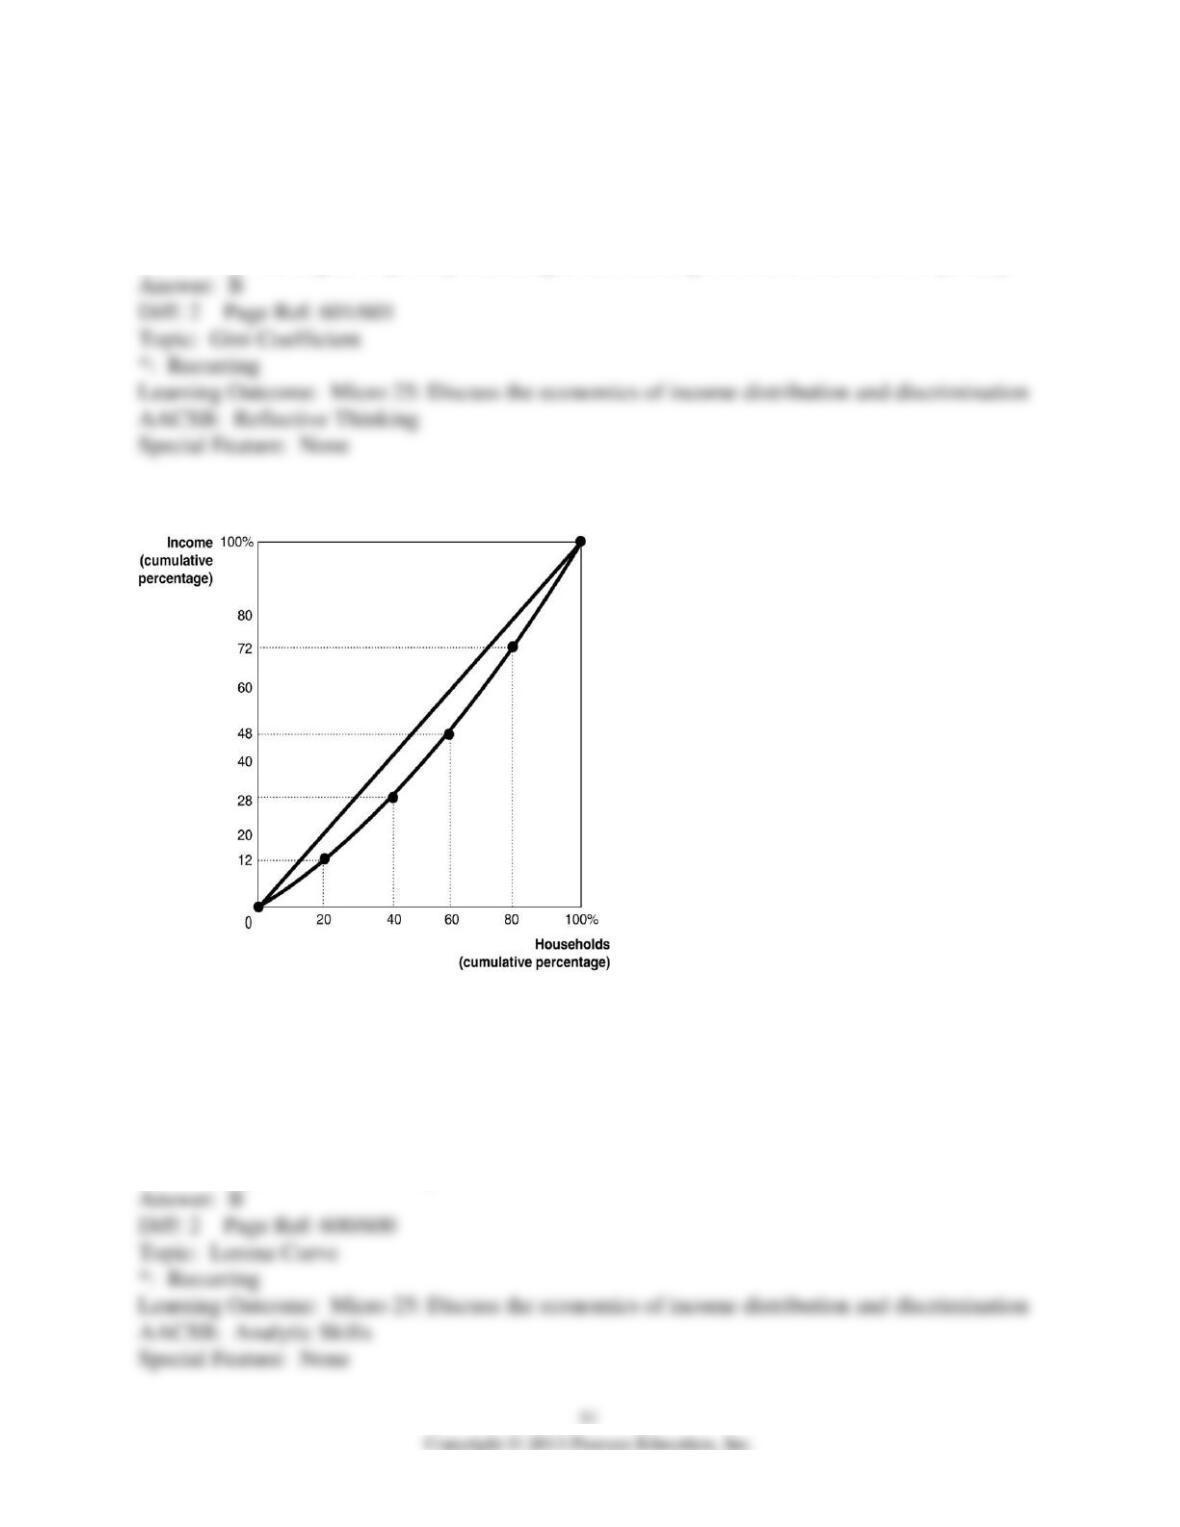
Figure 18-3
Figure 18-3 shows the Lorenz curve for a hypothetical country.
13) Refer to Figure 18-3. The second lowest 20 percent of households
A) earn 12 percent of the society’s total income.
B) earn 16 percent of the society’s total income.
C) earn 28 percent of the society’s total income.
D) earn 40 percent of the society’s total income.
14) Refer to Figure 18-3. The second highest 20 percent of households
A) earn 24 percent of the society’s total income.
B) earn 28 percent of the society’s total income.
C) earn 42 percent of the society’s total income.
D) earn 72 percent of the society’s total income.
15) If official poverty statistics for the United States included transfer payments individuals
receive from the government, such as Social Security payments and other non-cash benefits such
as food stamps,
A) the poverty rate would be lower.
B) poverty would be eliminated.
C) income inequality would be greater.
D) the poverty rate would be overstated.
16) Studies by the U.S. Census Bureau have shown that
A) families remain below the poverty line for an average of five years.
B) there is significant income mobility in the U.S. over time.
C) income mobility in the U.S. is minimal.
D) over half the people below the poverty line never move out of poverty.
17) Which of the following is a transfer payment?
A) the food stamp program
B) a tax deduction
C) Social Security payments
D) an income tax credit
18) The Gini coefficient for the United States in 1980 was 0.403. In 2011, the coefficient was
equal to 0.468. This means that
A) per capita income in the United States rose from 1980 to 2011.
B) there was a decrease in the amount of government transfer payments from 1980 to 2011.
C) cuts in federal income tax rates in the early 1980s and 2001 helped to reduce income
inequality.
D) income inequality increased from 1980 to 2011.
19) Sheldon Cleaver commented on the difficulty people have in overcoming poverty in the
United States: “Most people whose incomes fall below the poverty line have difficulty pulling
themselves above the line in future years. In this sense, poverty becomes a vicious cycle. I
believe the psychological damage households face when they are branded with the ‘poverty’ label
in our society is a major factor in their remaining in poverty. Despair is a major reason why the
percentage of people with incomes that lie below the poverty line never falls below 10 percent.”
Which of the following correctly evaluates Cleaver’s statement?
A) Cleaver is correct. Economists often fail to take into account psychological factors when they
analyze poverty and the distribution of income in the United States. Policies must take such
factors into account if we are to make progress in eliminating poverty.
B) Cleaver is correct when he notes that poverty is a chronic problem. The best way to reduce
poverty is to force the poor to become better educated so that they can work their way out of
poverty.
C) Cleaver is correct, but he is looking at the wrong statistic. The official poverty line
understates the true degree of poverty in the United States.
D) Cleaver assumes that all those with incomes below the poverty line in one year remain in
poverty in subsequent years. In fact, research has shown that the number of people who remain
in poverty for many years is much smaller than the number who are in poverty during any one
year.
20) Economists caution that conventional statistics used to estimate the extent of poverty in the
United States fail to account for benefits people receive that, if considered, would reduce the
amount of poverty. Which of the following is an example of these benefits?
A) Individuals can use tax credits and the personal exemption to reduce their taxable incomes.
This reduces what they owe the government and increases their disposable incomes.
B) The federal income tax system is progressive. As a result, the poor have higher after-tax
incomes than they would have if the income tax system was proportional or progressive.
C) Individuals with low incomes receive non-cash benefits such as free school lunches and food
stamps.
D) The federal minimum wage forces employers to pay workers with low skills an efficiency
wage.
21) Which of the following statements is true?
A) If transfer payments such as Social Security payments to the retired and disabled were
excluded from official statistics used to estimate the percentage of people with incomes below
the poverty line, the amount of poverty in the United States would be much greater.
B) Because the federal income tax system is progressive, measuring poverty using after-tax
incomes results in a higher poverty rate than if poverty is measured using before-tax incomes .
C) If non-cash benefits such as food stamps and rent subsidies were added to the incomes of low-
income families, poverty would be eliminated.
D) In the United States, income remaining after federal taxes are paid is more equally distributed
than income before taxes.
22) Between 1970 and 2006, the poverty rate in East Asia declined dramatically from 58.8
percent to 1.7 percent, while the poverty rate in Sub-Saharan Africa decreased from 39.9 percent
to only 31.8 percent. The main reason for this is that
A) the population growth rate decreased in East Asia and increased in Sub-Saharan Africa.
B) Governments in East Asia increased transfer payments to poor families over this period of
time. The governments of Sub-Saharan Africa had practically no transfer payment programs
from 1970 to 2006.
C) The countries of East Asia have progressive income tax systems. The countries of Sub-
Saharan Africa all have regressive income tax systems.
D) East Asia experienced higher economic growth than Sub-Saharan Africa.
23) The decision to make the U.S. income tax system progressive was
A) a progressive decision.
B) a positive decision.
C) a decision that was needed to minimize the excess burden of taxation.
D) a normative decision.
24) A government-imposed tax on soft drinks would shift the supply curve for soft drinks to the
left, ________ the equilibrium price and ________ the equilibrium quantity.
A) increasing; increasing
B) increasing; decreasing
C) decreasing; increasing
D) decreasing; decreasing
25) The Center for Science in the Public Interest has stated that an 8-cent tax on a 12-ounce
serving of a soda would raise ________ per year.
A) $500 million
B) $1.5 billion
C) $11 billion
D) $225 billion
26) The burden of a tax on soft drinks would fall more on ________ the more ________.
A) producers; inelastic the demand curve.
B) consumers; inelastic the demand curve.
C) producers; elastic the supply curve.
D) consumers; inelastic the supply curve.
27) A Lorenz curve summarizes the information provided by a Gini coefficient.
28) Income inequality increases as the Gini coefficient approaches 1.
29) From 1970 to 2006, the poverty rate in East Asia rose slightly but the level of poverty in sub-
Saharan Africa fell dramatically.
30) What is the difference between the poverty line and the poverty rate?
31) What is a Lorenz curve and what is a Gini coefficient?
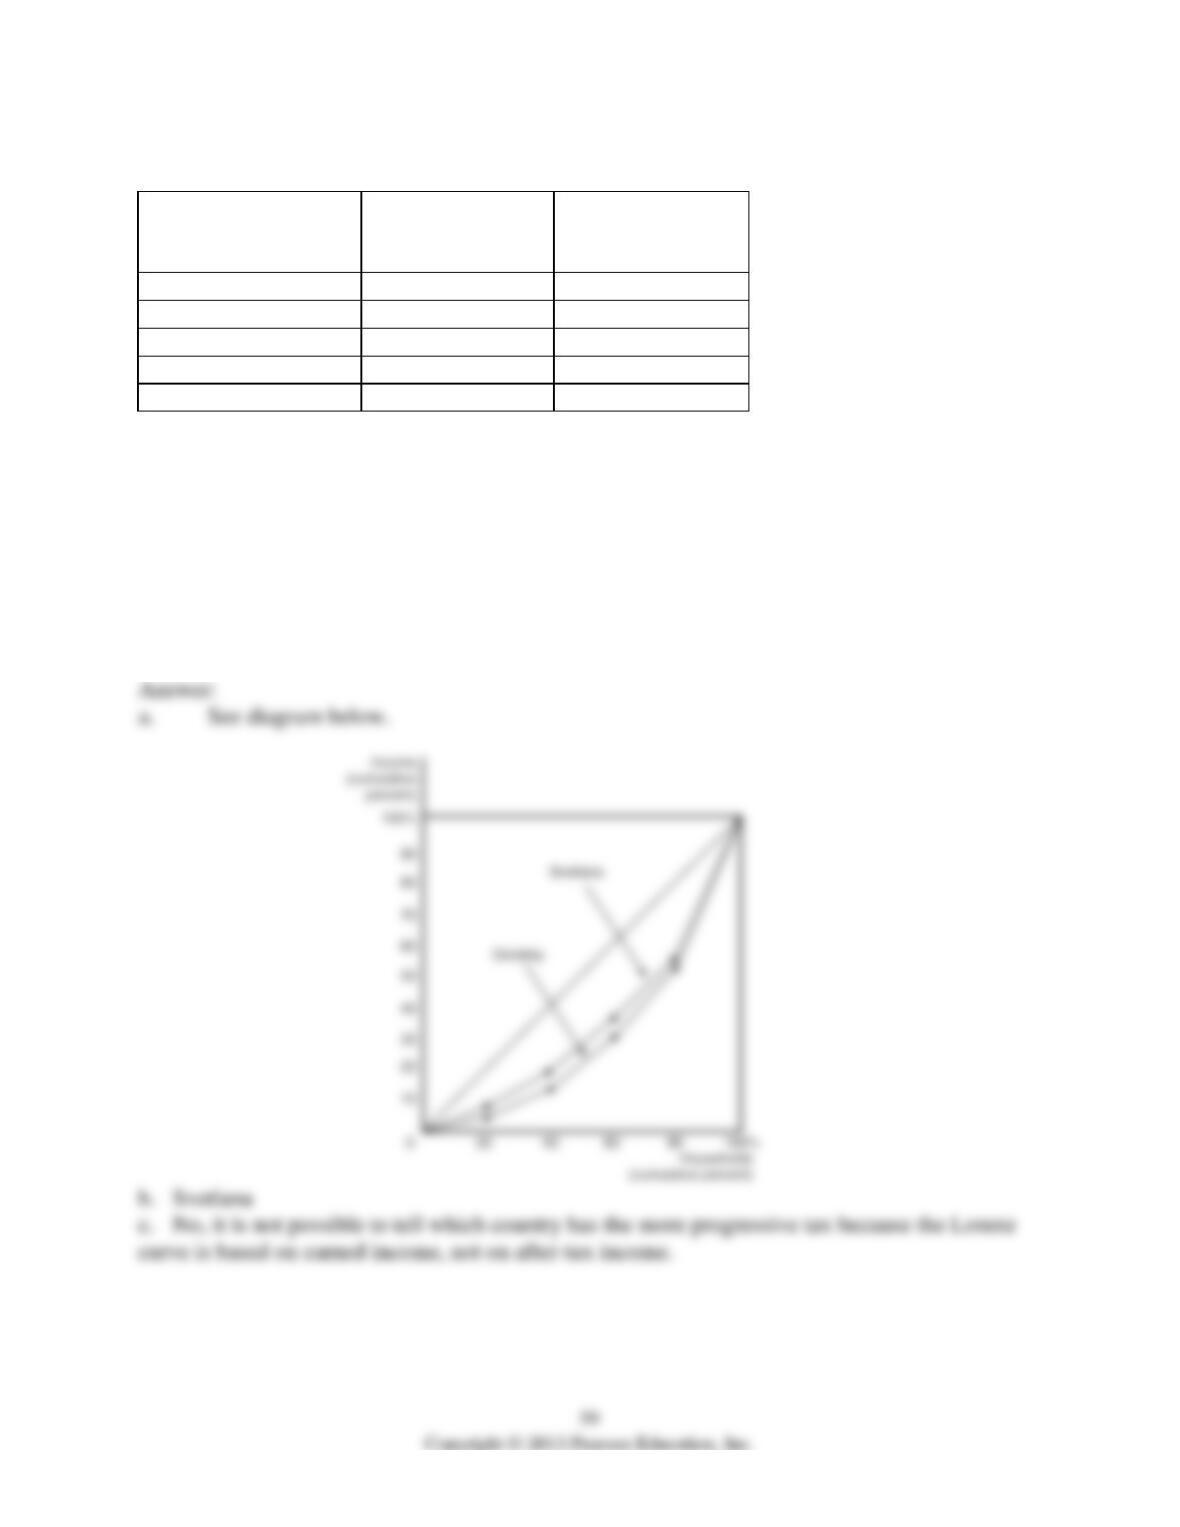
Table 18-7
Income Quintile
Svetlana
Percentage of
Total Income
Grodsky
Percentage of Total
Income
Lowest 20%
8%
4%
Second quintile
12%
10%
Third quintile
16%
16%
Fourth quintile
20%
24%
Highest 20%
44%
46%
Table 18-7 shows income distribution data for two countries. Use this data to answer the
following questions.
32) Refer to Table 18-7.
a. Draw a Lorenz curve for each country.
b. Which country has the more equal distribution of income?
c. Based on the Lorenz curve for the two countries, can you determine which country has the
more progressive tax system? Explain your answer.
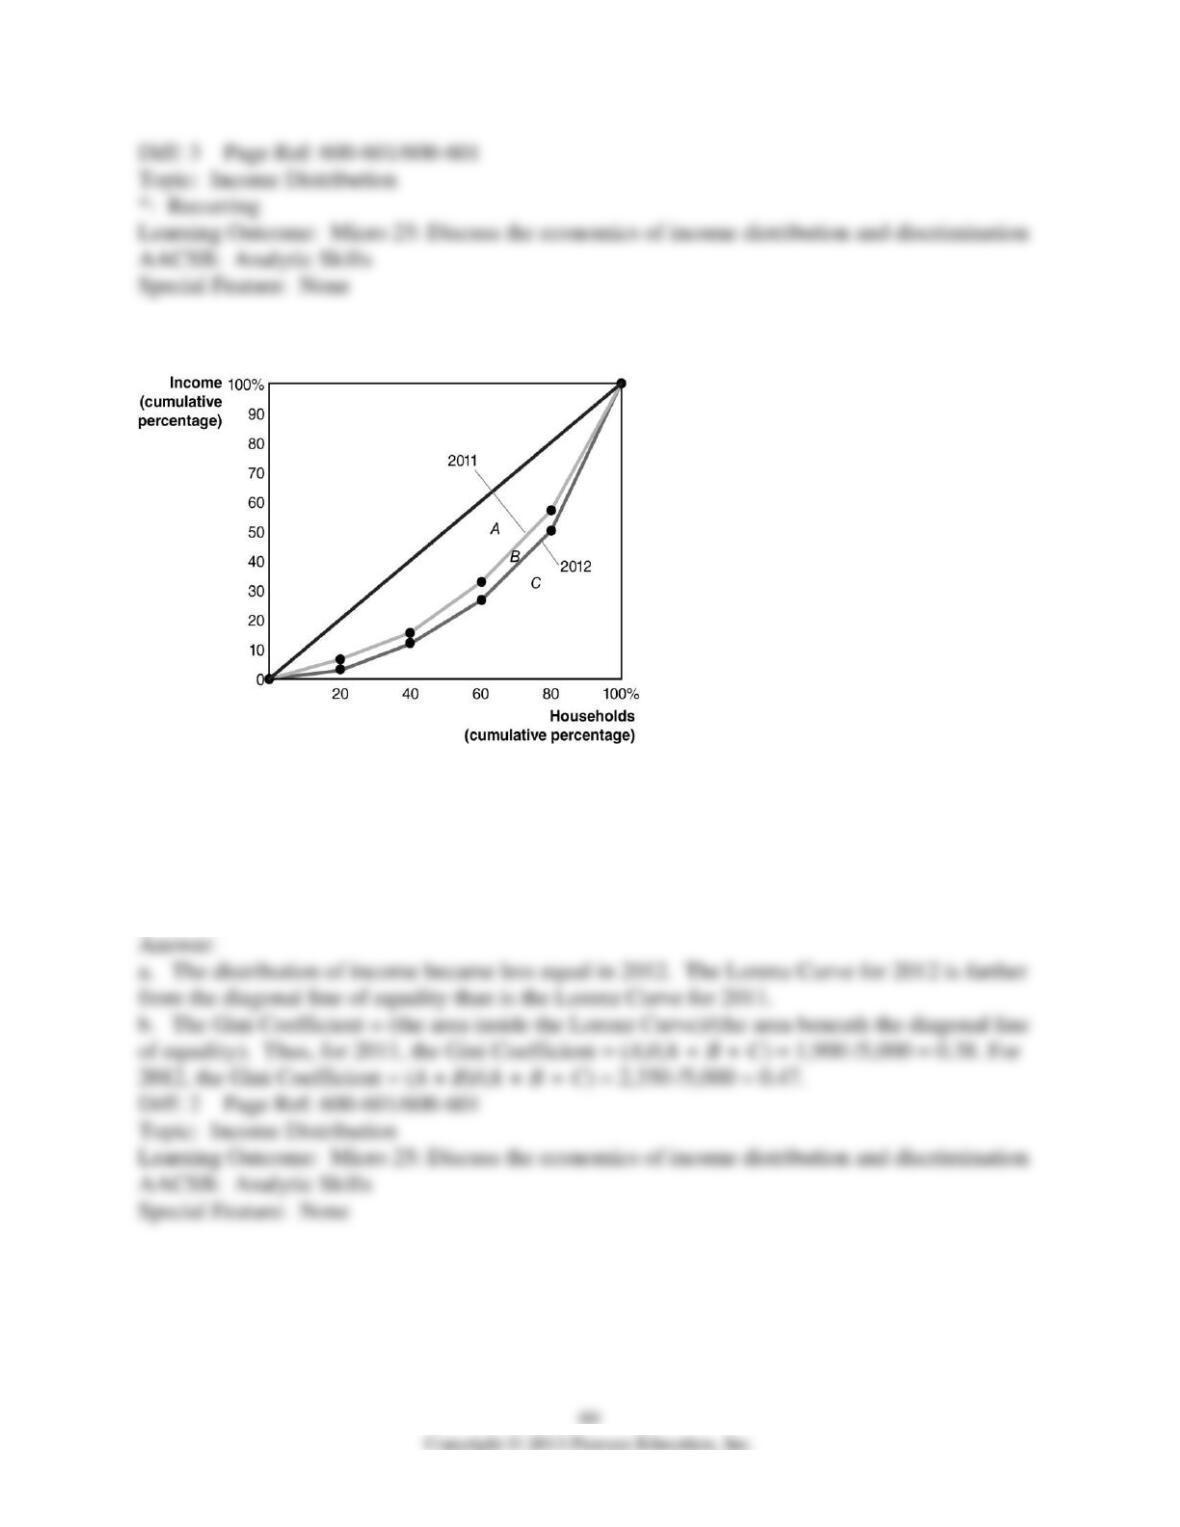
Figure 18-4
33) Refer to Figure 18-4 to answer the following questions.
a. Did the distribution of income become more equal in 2012 than it was in 2011, or did it
become less equal? Explain.
b. If area A = 1,900, area B = 450, and area C = 2,650, calculate the Gini coefficient for 2011
and the Gini coefficient for 2012.