Chapter 18: Building Multiple Regression Models Name __________________
Quiz A
Use the following information for problems 1-6.
A sample of 30 companies was randomly selected for a study investigating what factors
affect the size of company bonuses. Data were collected on the number of employees at
the company and whether or not the employees were unionized (1 = yes,
0 = no). Below are the multiple regression results.
Dependent Variable is Average Annual Bonus
Predictor Coef SE Coef T P
Constant 347.9 872.2 0.40 0.693
Employees 0.6547 0.1105 5.92 0.000
Union 1259.5 605.8 2.08 0.047
S = 1631.56 R-Sq = 62.4% R-Sq(adj) = 59.6%
Analysis of Variance
Source DF SS MS F P
Regression 2 119368382 59684191 22.42 0.000
Residual Error 27 71873285 2661974
Total 29 191241667
18.1.2 Interpret a multiple regression equation and/or results.
1. Write out the estimated regression equation, which variables are significant in this
regression equation (using α = 0.05)? Explain.
18.5.2 Interpret a multiple regression equation and/or results.
2. If another variable, yearly revenue was included in this multiple regression model,
should collinearity be suspected? If so, what would help to determine whether this is
a problem?

18-2 Chapter 18 Building Multiple Regression Models
18.1.1 Understand and use dummy variables and/or interaction terms in regression
models.
3. Interpret the coefficient of the Union.
18.1.1 Understand and use dummy variables and/or interaction terms in regression
models.
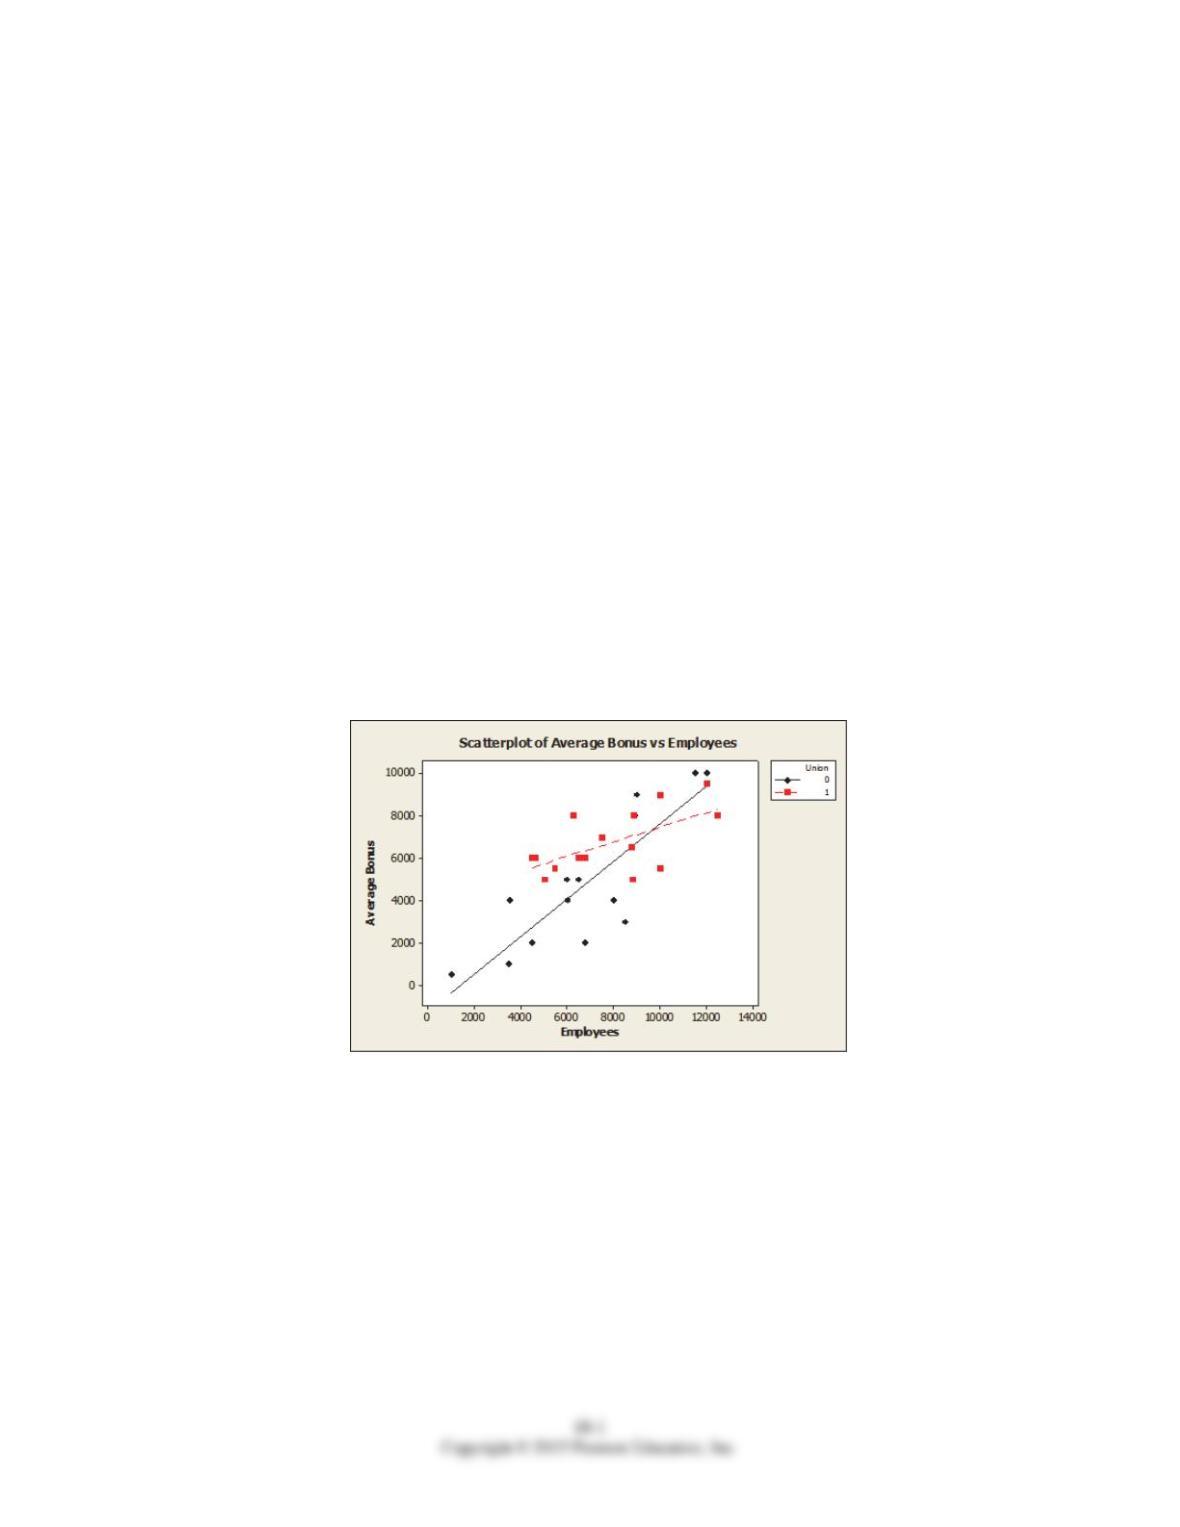
4. Based on the scatterplot, do you think using Union as an indicator variable in this
model is appropriate? Explain.
18.4.3 Build multiple regression models.
5. An alternative multiple regression model is fit to these data and the results are shown
below. Which model is better? Explain.
Dependent Variable is Average Annual Bonus
Predictor Coef SE Coef T P
Constant -1241.0 982.3 -1.26 0.218
Employees 0.8872 0.1318 6.73 0.000
Union 5253 1579 3.33 0.003
Emp*Union -0.05424 0.02012 -2.70 0.012
S = 1469.91 R-Sq = 70.6% R-Sq(adj) = 67.2%
Analysis of Variance
Source DF SS MS F P
Regression 3 135065225 45021742 20.84 0.000
Residual Error 26 56176442 2160632
Total 29 191241667
18.2.1 Understand and use dummy variables and/or interaction terms in regression
models.
6. Using the better model, predict the annual average bonus for a company with 7500
employees that are not unionized.
Quiz A 18-3
Chapter 18: Building Multiple Regression Models
Quiz A, Key
18-4 Chapter 18 Building Multiple Regression Models
Quiz B 18-5
Chapter 18: Building Multiple Regression Models Name __________________
Quiz B
Use the following information for problems 1-6.
A sample of firms was selected from the high tech industry (Industry = 1) and the
financial services sector (Industry = 0). Data were collected on the following variables:
turnover rate, job growth, number of employees, and innovative index (higher scores
indicate a more innovative and creative organizational culture). Below are the multiple
regression results.
Dependent Variable is Turnover Rate
Predictor Coef SE Coef T P
Constant 9.2439 0.7871 11.74 0.000
Innovative Index -0.02402 0.01524 -1.58 0.134
Job Growth -0.50127 0.07287 -6.88 0.000
Employees 0.0006144 0.0005461 1.13 0.276
Industry -2.8329 0.4699 -6.03 0.000
S = 0.739664 R-Sq = 95.6% R-Sq(adj) = 94.6%
Analysis of Variance
Source DF SS MS F P
Regression 4 202.517 50.629 92.54 0.000
Residual Error 17 9.301 0.547
Total 21 211.818
18.1.2 Interpret a multiple regression equation and/or results.
1. Write out the estimated regression equation, which independent variables are
significant in this regression equation (using α = .05)? Explain.

18-6 Chapter 18 Building Multiple Regression Models
18.1.1 Understand and use dummy variables and/or interaction terms in regression
models.
2. Interpret the coefficient of Industry.
18.4.3 Build multiple regression models.
3. An alternative multiple regression model is fit to these data and the results are shown
below. Which model is better? Explain.
Dependent Variable is Turnover Rate
Predictor Coef SE Coef T P
Constant 8.8384 0.2776 31.83 0.000
Job Growth -0.57358 0.06686 -8.58 0.000
Industry -3.1395 0.4236 -7.41 0.000
S = 0.795553 R-Sq = 94.3% R-Sq(adj) = 93.7%
Analysis of Variance
Source DF SS MS F P
Regression 2 199.793 99.896 157.84 0.000
Residual Error 19 12.025 0.633
Total 21 211.818
18.1.1 Understand and use dummy variables and/or interaction terms in regression
models.
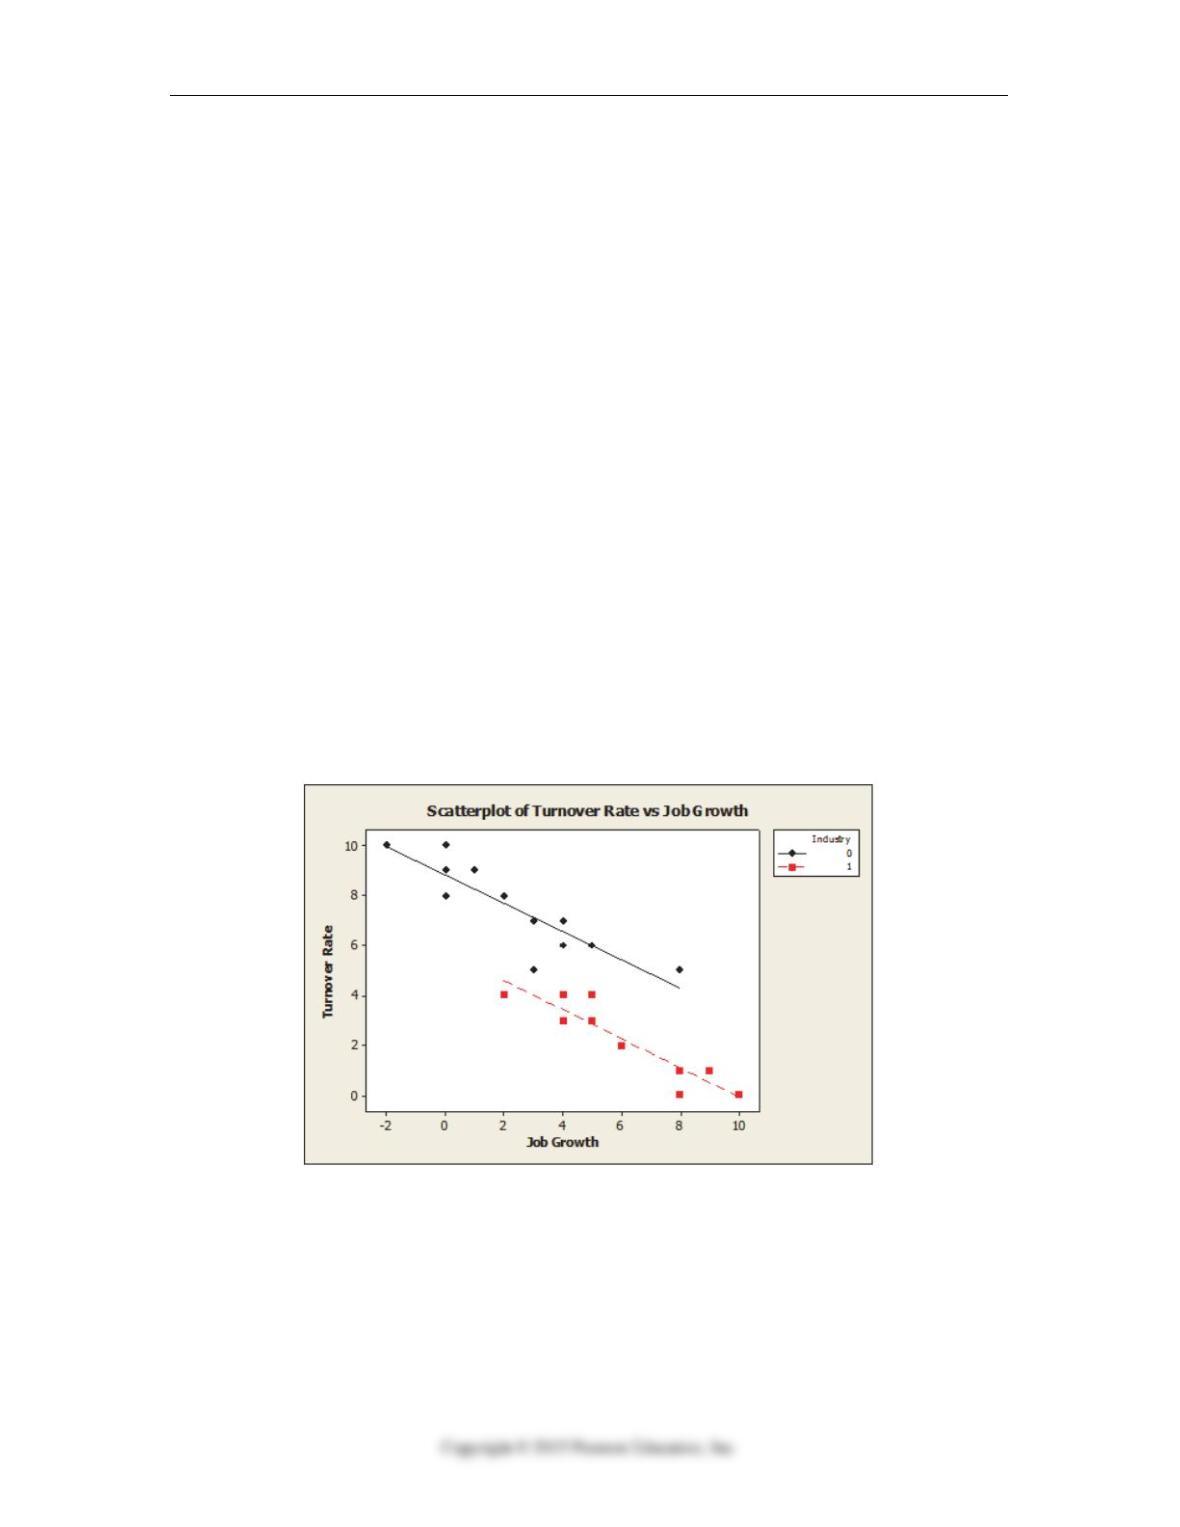
4. Based on the scatterplot, is it appropriate to use Industry as an indicator variable in
this regression model? Explain.
18.2.1 Understand and use dummy variables and/or interaction terms in regression
models.
5. Using the better model, predict turnover rate for a firm in the financial services sector
with 1000 employees, an innovativeness index of 50 and 2% job growth rate.
18.6.3 Build multiple regression models.
6. On a closer look at the variable Innovative Index, a residual plot showed a violation
of the linearity condition. After attempted re-expression, a scatterplot showed that
turnover rate showed a decrease and then increase as Innovative Index increased.
How should this variable be analyzed using multiple regression? Explain.
Quiz B 18-7
Chapter 18: Building Multiple Regression Models
Quiz B, Key
18-8 Chapter 18 Building Multiple Regression Models
Quiz B 18-9

18-10 Chapter 18 Building Multiple Regression Models
Chapter 18: Building Multiple Regression Models Name:___________________
Quiz C, Multiple Choice
18.1.2 Interpret a multiple regression equation and/or results.
1. Data were collected on company bonuses, the number of employees at the company,
and whether or not the employees were unionized (1 = yes, 0 = no) on a sample of 30
randomly selected. According to the multiple regression model below, at α = .05 we
can conclude that
Dependent Variable is Average Annual Bonus
Predictor Coef SE Coef T P
Constant 347.9 872.2 0.40 0.693
Employees 0.6547 0.1105 5.92 0.000
Union 1259.5 605.8 2.08 0.047
S = 1631.56 R-Sq = 62.4% R-Sq(adj) = 59.6%
Analysis of Variance
Source DF SS MS F P
Regression 2 119368382 59684191 22.42 0.000
Residual Error 27 71873285 2661974
Total 29 191241667
A. the multiple regression model is significant in explaining the size of company
bonuses.
B. the number of employees at the company is a significant variable in explaining
the size of company bonuses.
C. whether or not the employees are unionized is a significant variable in explaining
the size of company bonuses.
D. Both A and B.
E. All of the above.
18.1.1 Understand and use dummy variables and/or interaction terms in regression
models.
2. A multiple regression model was fit to data investigating what factors affect the size
of company bonuses including number of employees and whether or not the
employees were unionized (1 = yes, 0 = no). The regression coefficient of Union is
1259.5. The correct interpretation of this value is that, for unionized companies
compared to non-unionized companies of the same size (same number of employees),
on average the annual average bonus is
A. $605.80 less
B. $605.80 more
C. $1259.50 less
D. $1259.50 more
E. $208 more
Quiz C 18-11
18.2.1 Understand and use dummy variables and/or interaction terms in regression
models.
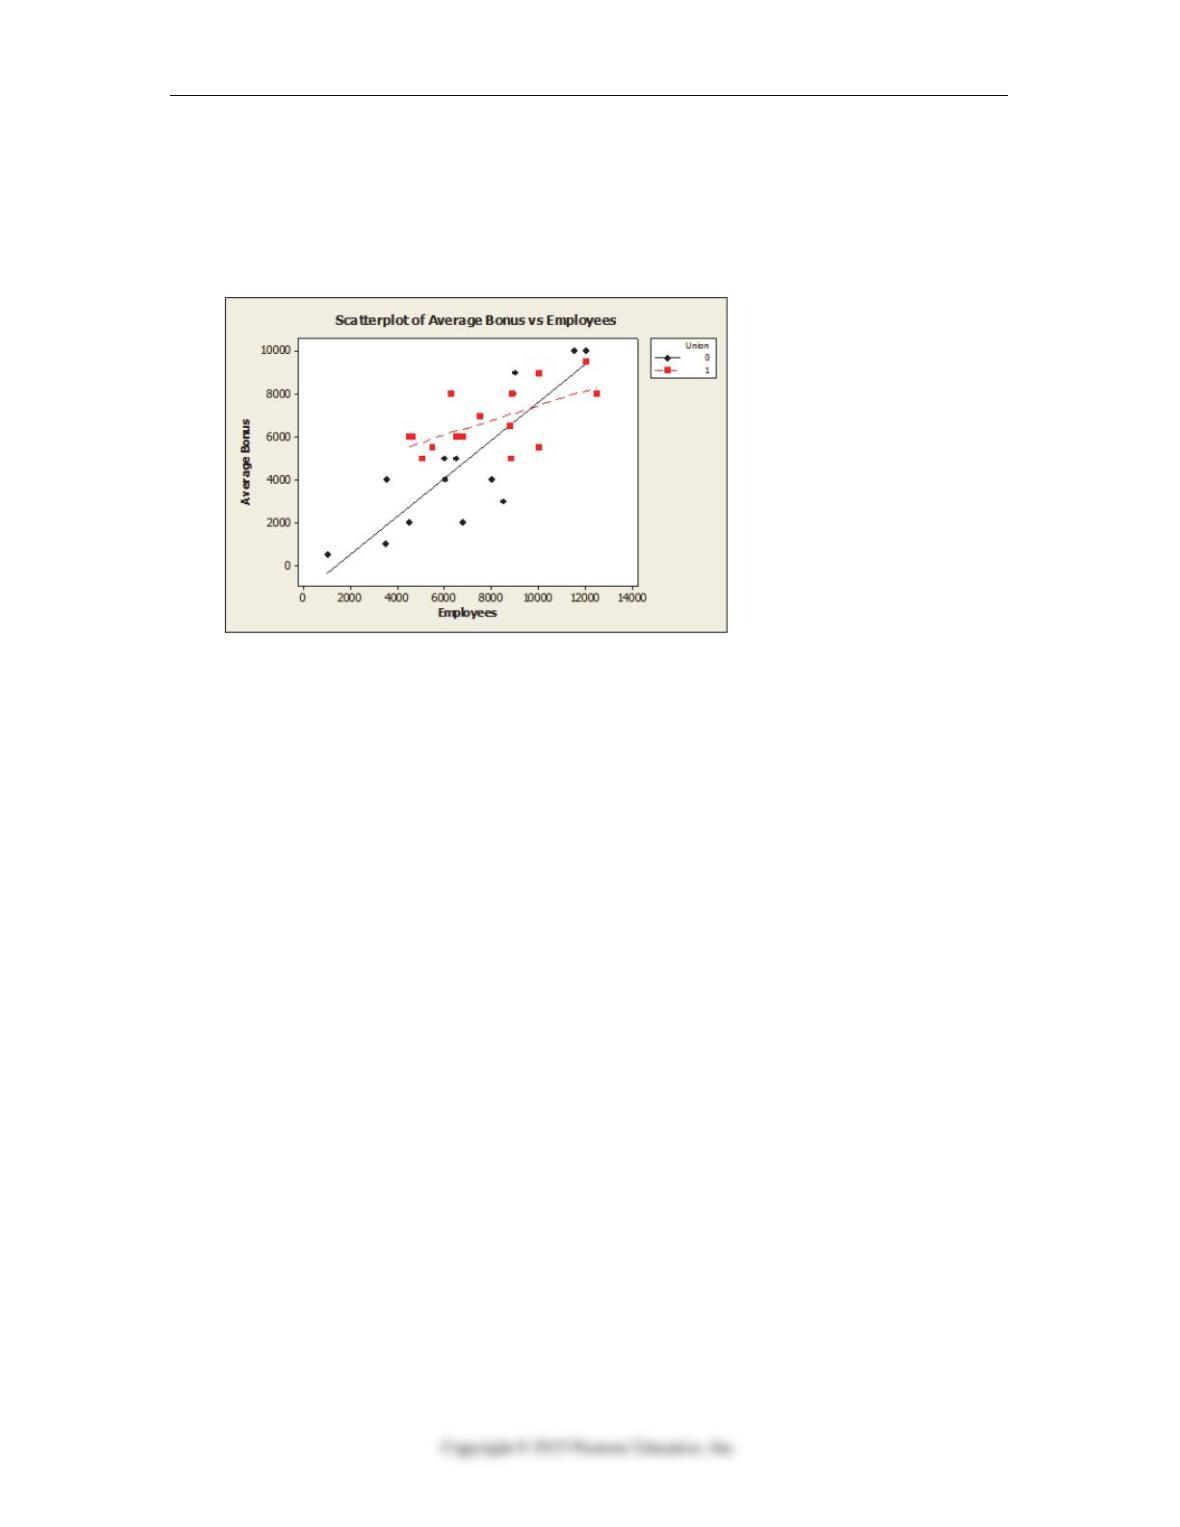
3. Below is a scatterplot of size of company bonuses (Y) by number of employees at the
company (X) for unionized and non-unionized employees. What does the scatterplot
suggest?
A. Using Union as an indicator variable in this model is appropriate.
B. Using the interaction term Employees*Union in the model is appropriate.
C. Union should not be included in the model as a variable.
D. Employees should not be included in the model as a variable.
E. None of the above.
18.2.2 Interpret a multiple regression equation and/or results.
4. A multiple regression model was fit to predict size of company bonuses from number
of employees and unionized employees (1 = yes, 0 = no). The resulting model was:
1241.0 0.8872 5253
0.05424 ∗ . Based on this model, what is the annual average
bonus for a company with 7500 employees that are not unionized?
A. $5413
B. $10,259.20
C. $10,666
D. $5253
E. $7980.25

18-12 Chapter 18 Building Multiple Regression Models
18.2.2 Interpret a multiple regression equation and/or results.
5. A multiple regression model was fit to predict size of company bonuses from number
of employees and unionized employees (1 = yes, 0 = no). The resulting model was:
1241.0 0.8872 5253
0.05424 ∗ . Based on this model, what is the annual average
bonus for a company with 5000 employees that are unionized?
A. $3195
B. $8176.80
C. $5253
D. $7980.25
E. $10,259.20
18.3.5 Identify and assess the impact of influential points.
6. A point with a leverage value of 0 as an effect on all of the following regression
statistics except:
A. Intercept
B. R2
C. F-statistic
D. t-statistic
E. regression slope
18.4.2 Interpret a multiple regression equation and/or results.
7. Data were collected on Job Growth (%) and Industry in an attempt to develop a
model to predict Turnover Rate from sample of 22 firms from the high tech (Industry
= 1) and the financial services sector (Industry = 0). Based on the output provided,
which of the following statements is true?
Dependent Variable is Turnover Rate
Predictor Coef SE Coef T P
Constant 8.8384 0.2776 31.83 0.000
Job Growth -0.57358 0.06686 -8.58 0.000
Industry -3.1395 0.4236 -7.41 0.000
S = 0.795553 R-Sq = 94.3% R-Sq(adj) = 93.7%
Analysis of Variance
Source DF SS MS F P
Regression 2 199.793 99.896 157.84 0.000
Residual Error 19 12.025 0.633
Total 21 211.818
A. All of the independent variables in this model are significant.
B. This model includes an interaction term.
C. This model does not include an indicator variable.
D. Both A and B.
E. All of the above.

Quiz C 18-13
18.1.1 Understand and use dummy variables and/or interaction terms in regression
models.
8. Data were collected on Job Growth (%) and Industry in an attempt to develop a
model to predict Turnover Rate in a sample of 22 firms from the high tech (Industry =
1) and the financial services sector (Industry = 0). Based on the output provided, the
predicted turnover rate for a firm in the financial services sector with a 2% job growth
rate is
Dependent Variable is Turnover Rate
Predictor Coef SE Coef T P
Constant 8.8384 0.2776 31.83 0.000
Job Growth -0.57358 0.06686 -8.58 0.000
A. 8.25%
B. 7.69%
C. 4.56%
D. 6.19%
E. None of the above.
18.5.2 Interpret a multiple regression equation and/or results.
9. Data were collected on the following variables: turnover rate, job growth, number of
employees, and innovative index and fit in a model to explain Turnover Rate. To
check for the possibility of collinearity, a regression among predictor variables job
growth and employees predicting a third predictor variable, innovative index, was run
and was found to have an R2 = 52.5%. The Variance Inflation Factor (VIF) for the
predictor variable Innovative Index is
A. 52.5
B. 13.15
C. 3.63
D. 2.10
E. 1.00
10. Which of the following statements about collinearity in a multiple regression model is
false?
A. The Variance Inflation Factor can measure the collinearity of a predictor variable.
B. Coefficients of predictor variables will not be affected by collinearity.
C. Collinearity should be suspected if a model has a high R2 and large F but no
significant predictor varialbes.
D. All predictors must be considered in determining collinearity in a multiple
regression model.
E. None of these are false.
18-14 Chapter 18 Building Multiple Regression Models
Chapter 18: Building Multiple Regression Models – Quiz C – Key

Quiz D 18-15
Chapter 18: Building Multiple Regression Models Name___________________
Quiz D, Multiple Choice
18.1.2 Interpret a multiple regression equation and/or results.
1. Data were collected on the following variables: turnover rate, job growth, number of
employees, and innovative index in a sample of firms was selected from the high tech
industry (Industry = 1) and the financial services sector (Industry = 0). Below are the
multiple regression results. Which statement(s) is (are) true about the estimated
multiple regression model?
Dependent Variable is Turnover Rate
Predictor Coef SE Coef T P
Constant 9.2439 0.7871 11.74 0.000
Innovative Index -0.02402 0.01524 -1.58 0.134
Job Growth -0.50127 0.07287 -6.88 0.000
Employees 0.0006144 0.0005461 1.13 0.276
Industry -2.8329 0.4699 -6.03 0.000
S = 0.739664 R-Sq = 95.6% R-Sq(adj) = 94.6%
Analysis of Variance
Source DF SS MS F P
Regression 4 202.517 50.629 92.54 0.000
Residual Error 17 9.301 0.547
Total 21 211.818
A. Turnover rate is the indicator variable.
B. Innovative index is the indicator variable.
C. F test results indicate that the model is significant in explaining Turnover rate.
D. Both B and C.
E. All of the above.

18-16 Chapter 18 Building Multiple Regression Models
18.1.2 Interpret a multiple regression equation and/or results.
2. Data were collected on the following variables: turnover rate, job growth, number of
employees, and innovative index in a sample of firms was selected from the high tech
industry (Industry = 1) and the financial services sector (Industry = 0). Which of the
following independent variables are significant in this regression equation at α = .05?
Dependent Variable is Turnover Rate
Predictor Coef SE Coef T P
Constant 9.2439 0.7871 11.74 0.000
Innovative Index -0.02402 0.01524 -1.58 0.134
Job Growth -0.50127 0.07287 -6.88 0.000
Employees 0.0006144 0.0005461 1.13 0.276
Industry -2.8329 0.4699 -6.03 0.000
A. Innovative Index
B. Job Growth
C. Industry
D. Both A and B.
E. Both B and C.
18.1.2 Interpret a multiple regression equation and/or results.
3. Based on the multiple regression statistics below, how much of the variability in
Turnover Rate is explained by this multiple regression model?
Dependent Variable is Turnover Rate
Analysis of Variance
Source DF SS MS F P
Regression 4 202.517 50.629 92.54 0.000
Residual Error 17 9.301 0.547
Total 21 211.818
S = 0.739664 R-Sq = 95.6% R-Sq(adj) = 94.6%
A. 73.9%
B. 95.6%
C. 9.3%
D. 50.62%
E. None of the above.
Quiz D 18-17
18.1.1 Understand and use dummy variables and/or interaction terms in regression
models.
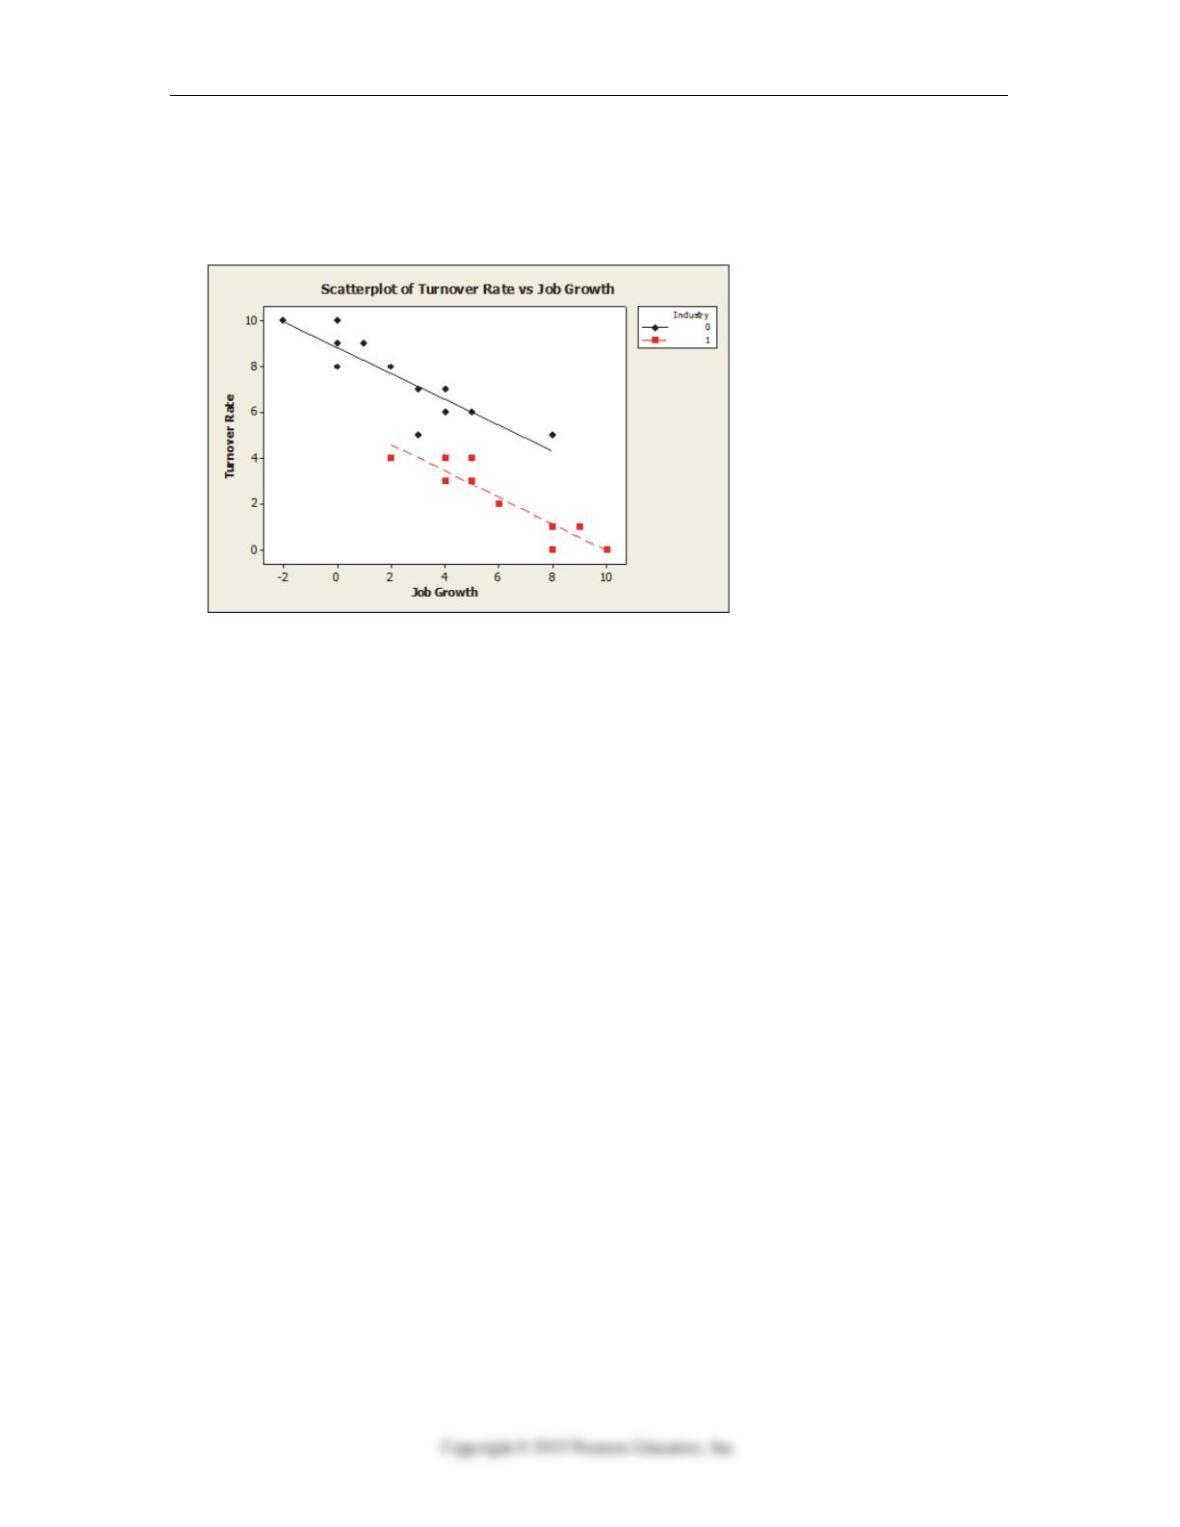
4. What does the scatterplot below suggest about developing a multiple regression
model to predict turnover rate using job growth and industry as predictor variables?
A. Using Job Growth as an indicator variable in this model is appropriate.
B. Using the interaction term Job Growth*Industry in the model is appropriate.
C. Using Industry as an indicator variable in this model is appropriate.
D. Job Growth should not be included in the model as a variable.
E. None of the above.
18.1.1 Understand and use dummy variables and/or interaction terms in regression
models.
5. In a multiple regression model, industry (1=high tech, 0=financial services), job
growth, number of employees, and innovative index were used to predict turnover
rate in a sample of firms. The coefficient of Industry is -2.8329. This means that for
firms with the same innovative index score, job growth and number of employees the
turnover rate will, on average, be
A. 2.83% less for a firm from high tech industry compared to financial services
B. 2.83% less for a firm from the financial services compared to the high tech
industry
C. 2.83% more for a firm from the high tech industry compared to the financial
services
D. 6.03% less for a firm from the high tech industry compared to the financial
services
E. 0.47% less for a firm from the financial services compared to the high tech
industry

18-18 Chapter 18 Building Multiple Regression Models
18.5.2 Interpret a multiple regression equation and/or results.
6. Data were collected on the following variables: turnover rate, job growth, number of
employees, and innovative index and fit in a model to explain Turnover Rate. To
check for the possibility of collinearity, a regression among predictor variables job
growth and employees predicting a third predictor variable, innovative index, was run
and was found to have an R2 = 8.8% and S=319.23. The Variance Inflation Factor
(VIF) for the predictor variable Employees is
A. 8.33
B. 1.10
C. 319.23
D. 1.00
E. 3.20
18.2.2 Interpret a multiple regression equation and/or results.
7. Data were collected on the number of employees and whether or not the employees
were unionized (1 = yes, 0 = no) for a sample of companies to investigate factors that
affect the size of bonuses. Based on the results shown, which of the following
statements is true?
Dependent Variable is Average Annual Bonus
Predictor Coef SE Coef T P
Constant -1241.0 982.3 -1.26 0.218
Employees 0.8872 0.1318 6.73 0.000
Union 5253 1579 3.33 0.003
Emp*Union -0.05424 0.02012 -2.70 0.012
A. The indicator variable in the model is not significant.
B. The interaction term in the model is not significant.
C. The indicator variable in the model is significant.
D. The interaction term should be dropped from the model.
E. None of the above.
18.4.2 Interpret a multiple regression equation and/or results.
8. Which of the following statements about building multiple regression models is true?
A. Automatic model building procedures such as “best subsets” and “stepwise”
always select the best multiple regression model.
B. When comparing among competing multiple regression models, it is best to use
R2 rather than the adjusted R2 for comparison.
C. It is always preferable to include more rather than fewer predictor variables in a
multiple regression model in order to ensure the highest possible value of R.2
D. When comparing among competing multiple regression models, the best models
will have the highest values for se.
E. None of the above.

Quiz D 18-19
18.4.2 Interpret a multiple regression equation and/or results.
9. Data were collected for a study investigating what factors affect the size of company
bonuses. The number of employees at the company and whether or not the
employees were unionized (1 = yes, 0 = no) was included in two competing multiple
regression models. Which of the following statements is true?
Dependent Variable is Average Annual Bonus
Model 1:
Predictor Coef SE Coef T P
Constant 347.9 872.2 0.40 0.693
Employees 0.6547 0.1105 5.92 0.000
Union 1259.5 605.8 2.08 0.047
S = 1631.56 R-Sq = 62.4% R-Sq(adj) = 59.6%
Model 2:
Predictor Coef SE Coef T P
Constant -1241.0 982.3 -1.26 0.218
Employees 0.8872 0.1318 6.73 0.000
Union 5253 1579 3.33 0.003
Emp*Union -0.05424 0.02012 -2.70 0.012
S = 1469.91 R-Sq = 70.6% R-Sq(adj) = 67.2%
A. Model 2 explains less of the variability in average annual bonus than model 1.
B. The standard deviation of residuals is lower for model 1 compared to model 2.
C. Model 1 includes an interaction term.
D. Model 2 is better than model 1.
E. Model 1 is better than model 2.
18.4.2 Interpret a multiple regression equation and/or results.
10. A diagnostic measure used to identify influential cases that may have greatly affected
multiple regression results is
A. Cook’s Distance.
B. Variance Inflation Factor.
C. Variance Influential Factor.
D. Residual’s Distance.
E. Adjusted R2.
18-20 Chapter 18 Building Multiple Regression Models
Chapter 18: Building Multiple Regression Models, Quiz D, Key