Unlock document.
This document is partially blurred.
Unlock all pages and 1 million more documents.
Get Access
Chapter 18—Repeated-Measures
Analysis of Variance
MULTIPLE CHOICE QUESTIONS
18.1+ A repeated-measures analysis of variance differs from a one-way and a factorial
design because
18.2+ All other things equal, the MSerror in a repeated-measures design is _______ than
the corresponding MSerror in a between-subjects design.
18.3 All other things being equal, a repeated-measures design is _______ than the
corresponding between-subjects design.
18.4 For repeated-measures designs with one independent variable (Time),
18.5 If we have a repeated-measures design with subjects receiving four levels of a
treatment, we assume that
Chapter 18
371
18.6 If, in the example of a headache study used in the text, all subjects had been
studied over the same period of time, differences that might be caused by stressful
times (such as Christmas) would
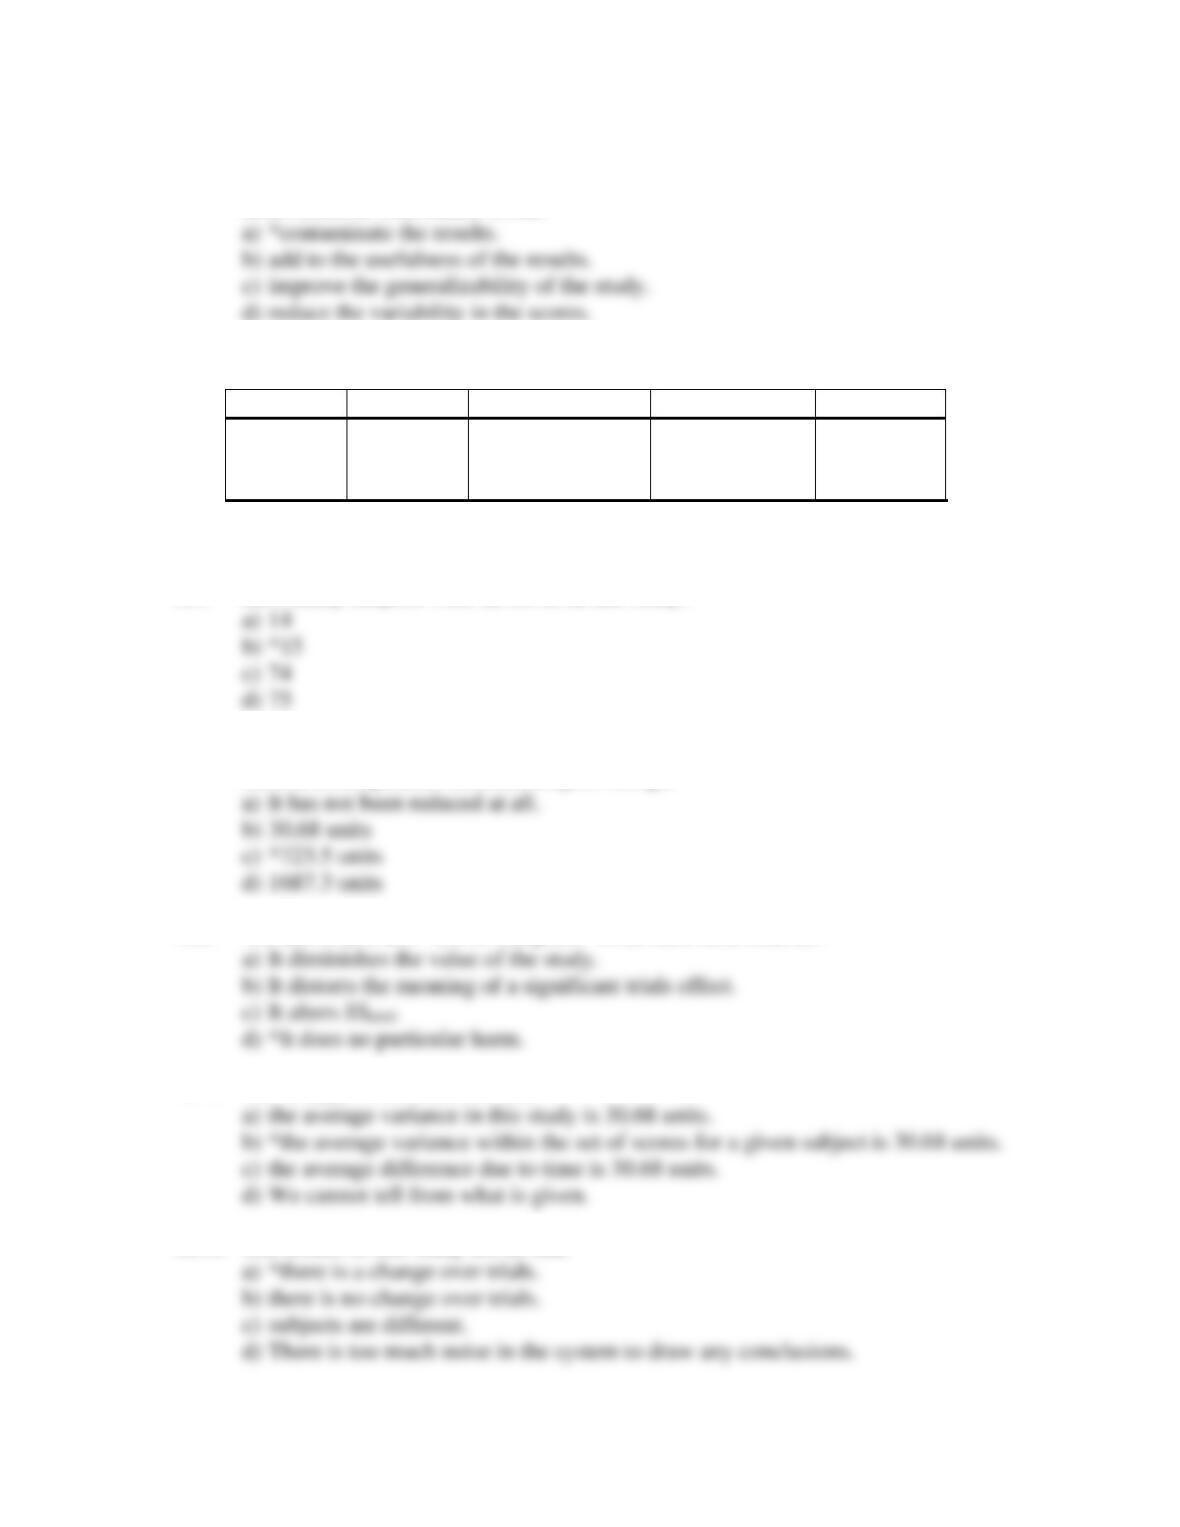
The next few questions are based on the following summary table.
Source
df
SS
MS
F
Subjects
14
723.5
Trials
4
1687.3
421.82
13.74*
Error
56
1718.5
30.68
Total
74
4129.3
*p<.05
18.7+ How many subjects were involved in this study?
18.8+ How much has the error sums of squares been reduced over what it would have
been in a comparable between-subjects design?
18.9+ We don’t have an F test on Subjects. What harm does that do?
18.10 The MSerror = 30.68 tells us that
18.11+ The results of this study tell us that
Test Bank
372
18.12+ How many trials were there in this experiment?
18.13 The error term in this analysis could also be thought of as
18.14 If we wanted to run a set of multiple comparisons on the data analyzed in the
summary table above, we could use
18.15 If we used a Bonferroni test to run multiple comparisons in the above example,
the error term that we would use would be
18.16+ If we compared Time 1 (baseline) against the next time (Time 2) and then against
the last time (follow-up), we would run the Bonferroni at
18.17 In running multiple comparisons in a repeated-measures design we can use
procedures that we would use with independent groups designs because
18.18+ The assumptions behind the analysis of repeated-measures designs include
Chapter 18
18.19 If you are concerned that you have violated the assumptions behind a repeated-
measures design, you can
18.20 The major advantage of repeated-measures designs is that
18.21+ The major disadvantage with repeated-measures designs is that they
d) *are subject to the influence of carry-over effects.
18.22 Counterbalancing is a technique to
18.23 Some summary tables include a term labeled “mean” or “constant,” with a
corresponding F test. This tests the hypothesis that
18.24+ A Greenhouse and Geisser correction is a correction applied to
18.25 If both the Greenhouse and Geisser and the Huynh and Feldt corrections lead to
significant results we should
Test Bank
18.26+ The text used an example in which the author rearranged the data points to look as
if they came from a repeated-measures design. In real life we would not move
our data points around so that we could analyze them as repeated measures. Why
not?
18.27 By shifting the data around the way the author did at the end of the repeated
measures chapter, he was able to show that
18.28 If a repeated-measures analysis of variance usually has an error term that is
smaller that the error term in the corresponding between-subjects design, then we
can assume that
18.29 If any reasonable person would expect that with 4 trials the last trial is almost
certain to be significantly different from the first, then Fisher’s LSD test
18.30+ In a typical learning experiment, a carry-over effect is
18.31 Which of the following demonstrates the similarities of a repeated-measures
analysis of variance for two trials and a t test for related means?
Chapter 18
375
18.32 In the printout of results for a repeated-measures analysis of variance, an F score
for “mean” or “constant” sometimes appears. Why is this statistic often not
interesting even if it is significant?
18.33 In an example in the text, an independent samples analysis of variance example
from a previous chapter was converted to be used in a repeated-measures analysis
of variance. Recalculating the F value with a repeated-measures analysis of
variance yields an F value that is
18.34+ In a learning study using repeated measures, the correlation between early and
later times will likely be low. Analyzing fewer levels of the independent variable
would help to avoid violating the assumption of
18.35+ A researcher wanted to see how watching movies influenced subjects’ IQ scores.
She gave IQ tests to subjects following each of two movies. Half of the subjects
first saw Titanic followed by Schindler’s List, while the other half first saw
Schindler’s List and then Titanic. Varying the movie order is an example of
18.36 If the assumption of constant correlations in a repeated-measures ANOVA is
violated, which of the following is true?
Test Bank
376
18.37 A design in which each subject receives all levels of an independent variable is
called a(n)
18.38 The typical way to control sequence effects is called
18.39 A _______ design is one in which subjects are measured repeatedly over time.
18.40 In a repeated-measures ANOVA, tests to correct the degrees of freedom, such as
Greenhouse-Gelsser and Huynh-Feldt, should be used if
18.41 You want to run a study examining the effects of poverty on the development of
antisocial behavior. You randomly select a large group of normal 12- year-old
children and sort them into three groups on the basis of family income. You meet
with them yearly until they are 25 years old, using a standard assessment of
antisocial behavior. What test should you run to analyze this data?
18.42 If we ran a repeated-measures analysis of variance to track changes in patients'
distorted thoughts over 6 weeks of therapy, we would most likely want to report
the effect size in terms of
Chapter 18
377
TRUE/FALSE QUESTIONS
one independent variable.
years is an example of a between-subjects design.
the same data would = 16.
the total df in a repeated-measures ANOVA based on that data would be 40.
df for time in a repeated-measures ANOVA based on that data would be 3.
interaction between subjects and the repeated-measures factor.
levels of the repeated factor are uncorrelated.
carry-over effects in repeated-measures designs.
ANOVAs when there is limited power due to restricted sample size.
between-subjects design.
OPEN-ENDED QUESTIONS
18.53 Give two examples in which you might use a repeated-measures design.
18.54 Give an example in which counterbalancing might be important for a repeated-
measures design.
18.55 Answer the following questions based on the summary table below.
Source
SS
Df
MS
F
Subjects
850
13
Time
204
2
102
3.40
Error
780
26
30
a) How many people were in the sample?
b) How many times was the dependent variable measured?
c) Was there a difference in the dependent variable over time? Explain.
Test Bank
378
18.56 Calculate and interpret F for the following example.
Source
df
SS
Subjects
15
850.77
Time
4
512.5
Error
60
780.35
Total
79
2143.62
18.57 On the following computer output, the significance of F varies depending on
which test you look at.
Tests of Within-Subjects Effects
Measure: MEASURE_1
6.889E-02
2
3.444E-02
3.480
.049
6.889E-02
1.640
4.200E-02
3.480
.061
6.889E-02
1.889
3.647E-02
3.480
.052
6.889E-02
1.000
6.889E-02
3.480
.089
.218
22
9.899E-03
.218
18.042
1.207E-02
.218
20.781
1.048E-02
.218
11.000
1.980E-02
Sphericity Assumed
Greenhouse-Geisser
Huy nh-Feldt
Lower-bound
Sphericity Assumed
Greenhouse-Geisser
Huy nh-Feldt
Lower-bound
Source
FACTOR1
Error(FACTOR1)
Ty pe III Sum
of Squares
df
Mean Square
F
Sig.
a) Why is this the case?
b) Which F value should be reported? Explain your answer.
18.58 Calculate and interpret F based on the following data.
2.00
3.00
4.00
2.00
2.00
3.00
3.00
4.00
3.00
3.00
3.00
4.00
3.00
4.00
5.00
4.00
4.00
5.00
4.00
5.00
4.00
4.00
4.00
5.00
4.00
5.00
6.00
5.00
5.00
6.00
10
10
10
1
2
3
4
5
6
7
8
9
10
N
Total
Task 1
Task 2
Task 3
18.59 A researcher collected data from behaviorally disturbed youth to see if
introducing a token economy would reduce their disruptive behavior. He
collected 3 weeks of data at baseline, treatment, and withdrawal respectively.
Identify three meaningful multiple comparisons you could calculate based on this
data. Explain your answers.
18.60 Explain why SSsubjects is removed from SSerror in repeated-measures designs.
18.61 Given the following data from a repeated-measures design, what is the value for
SSerror?
SSsubjects = 950, SStime = 1500, SStotal = 3100
Chapter 18
379
18.62 A researcher examined reaction time in 12 people across 3 conditions: regular
cola, caffeine free cola, and water. The overall F was significant, so she
performed multiple comparisons to understand which conditions differed.
Interpret the following multiple comparisons at the .05 level.
X
cola = 2.43s,
X
caffeine free = 2.52s,
X
water = 2.53s. tcola/caffeine free = 2.80; tcola/water
= 2.17;
twater/caffeine free = 0.38
Answers to Open-ended Questions
Chapter 18.
Test Bank
380


