Chapter 18—Activity-Based Costing and Management Key
1. Unit-level activities are performed each time a unit is produced.
2. Factors that measure the consumption of activities by products and other cost objects are value-added costs.
3. Activity drivers should be classified as either unit-level or nonunit-level.
4. Product diversity means that products consume overhead activities in systematically different proportions.
5. The consumption ratio is the amount of each activity consumed by a product.
6. An activity-based costing system first assigns costs to activities and then to cost objects.
7. A volume-based costing system emphasizes direct tracing and driver tracing.
8. An activity dictionary lists the activities in an organization along with some critical activity attributes.
9. Activity attributes are financial and nonfinancial information items that describe individual activities.
10. A work distribution matrix is derived from an interview or a written survey.
11. Resource drivers are factors that measure the consumption of resources by product.
12. To calculate an activity rate, the practical capacity of each activity must be determined.
13. Activity inputs are the resources consumed by the activity in producing its output.
14. Activity analysis is the effort expended to identify those factors that are the root causes of activity costs.
15. One of the questions answered by activity analysis should be “What activities are done?”
16. Activities necessary to remain in business are called valuable activities.
17. Discretionary activities are necessary to comply with legal mandates.
18. Costs that are caused by the inefficient performance of value-added activities are value added costs.
19. The value-added standard is the waste-free component of the value-added activity.
20. One of the three major dimensions of measuring activity performance is quality.
21. One way to improve efficiency is to produce higher activity output with higher cost.
22. Velocity is the length of time that it takes to produce a unit o output from the time raw materials are received
until the good is delivered.
23. Appraisal costs are incurred to determine whether products and services are conforming to their
requirements or customer needs.
24. A defective product is one that does conform to specifications.
25. Environmental costs are costs that are incurred because poor environmental quality may or does exists.
26. Quality improvement can increase profitability by decreasing costs.
27. Zero defects means that most products conform to specifications.
28. Activity elimination focuses on nonvalue-added activities.
29. Environmental internal failure costs are the costs of activities performed after discharging contaminants and
waste into the environment.
30. Control activities are performed by an organization or its customers in response to poor quality.
31. Control activities are performed by an organization to prevent or detect poor quality.
32. Environmental costs are associated with the creation, detection, remediation, and prevention of
environmental degradation.
33. Sustainable development is development that meets the needs of the present without compromising the
ability of future generations to meet their own needs.
34. Match each item with the correct statement below.
1. Factors that measure the consumption of activities
2. Activities that are performed each time a unit is
3. System that emphasizes direct tracing and driver
4. Financial and nonfinancial information items that
activity-based costing
5. Factors that measure the consumption of resources
35. Match each item with the correct statement below.
1. Costs necessary to perform value-added activities
3. Resources consumed by the activity in producing its
activity output
5. Process that answers the question “How many people
36. Match each item with the correct statement below.
1. The length of time it takes to produce a unit of output
from the time raw materials are received until the good is
activity
2. Involves choosing among different sets of activities that
3. Cost assignment method used for a cost of a resource that
4. Increases the efficiency of necessary activities by using
value-added
37. ___________________ are performed each time a unit is produced.
38. _____________________ are factors that measure the consumption of activities by products and other cost
objects and can be classified as either unit-level or nonunit-level.
39. When products consume overhead activities in systematically different proportion due to such things as
product size, product complexity, setup time and size of batches this is known as _________________.
40. The ___________________ is calculated by taking the amount of the activity driver per product and
dividing it by total driver quantity.

41. _________________________ assigns costs to activities and then costs to cost objects.
42. ____________________ are financial and nonfinancial information items that describe individual
activities.
43. A company will sometimes use a ____________________ which identifies the amount of labor consumed
by each activity.
44. Accurate ___________________ allow managers to make better pricing decisions, customer-mix decisions,
and other customer-related decisions that improve profitability.
45. Tracing ________________ costs to suppliers can enable managers to choose the true low-cost supplier.
46. _________________________ is a system-wide, integrated approach that focuses management’s attention
on activities with the objective of improving customer value and profit achieved by providing this value.
47. A focus on cost reduction instead of cost assignment and emphasizing the maximization of systemwide
performance is known as _______________________.
48. A ____________________ is classified as value-added provided it simultaneously meets three conditions.
49. When a new product can be designed to use components already being used by other products this is known
as ________________.

50. ___________________ are incurred to prevent poor quality in the products and services being produced.
51. The cost of recalls would be an example of a(n) ____________________.
52. Reinspection and design changes are examples of _____________________ costs.
53. Cleaning up a polluted lake or an oil spill are examples of __________________ costs.
54. Companies will incur costs to perform such tasks as recycling products, controlling pollution, reducing
contaminates. All of these tasks are examples of _____________________ costs.
55. ______________ is concerned with doing the activity right the first time it is performed.
56. Activities necessary to remain in business are known as _____________________.
57. Setups, material handling, and inspection are all possible examples of
58. ____ is present whenever products have different consumption ratios for different overhead activities.
59. A(n) ____ ratio measures the proportion of an activity consumed by a product.
60. Using only unit-based activity drivers to assign nonunit-related overhead costs can cause
61. Activity drivers can be classified as either ____ or ____.
62. ____ costs in many firms represent a much higher percentage of product costs than direct labor.
63. The activity driver for the shipping activity is the number of orders shipped. Product A uses 20 orders and
Product B uses 60 orders. Calculate the consumption ratios for each product.
64. Receiving provides 12,000 receiving hours and costs $60,000 per year. What is the activity rate for
receiving?
65. Producing 10,000 units of a cell phone requires $300,000 of prime costs, uses 2,000 machine hours, and
takes 1,200 setup hours. The activity rates are $40 per machine hour and $100 per setup hour. What is the unit
cost of a cell phone?
66. The moving activity has an expected cost of $160,000. Expected direct labor hours are 40,000, and the
expected number of moves is 80,000. The best activity rate for moving is
67. Figure 7-4.
Honeydew Company produces two products, a high end laptop computer under the label Bunsen Laptops, and
an inexpensive desktop computer under the label Beaker Computers. The two products use two overhead
activities, with the following costs:
Setting up equipment
$ 2,000
Machining
12,000
The controller has collected the expected annual prime costs for each product, the machine hours, the setup hours, and the expected production.
Bunsen
Beaker
Direct Labor
$20,000
$5,000
Direct Materials
15,000
4,000
Units
2,000
2,000
Machine hours
750
1,500
Setup hours
50
50
Refer to Figure 7-4. Calculate Beaker’s consumption ratio for setup hours.
68. Figure 7-4.
Honeydew Company produces two products, a high end laptop computer under the label Bunsen Laptops, and
an inexpensive desktop computer under the label Beaker Computers. The two products use two overhead
activities, with the following costs:
Setting up equipment
$ 2,000
Machining
12,000
The controller has collected the expected annual prime costs for each product, the machine hours, the setup hours, and the expected production.
Bunsen
Beaker
Direct Labor
$20,000
$5,000
Direct Materials
15,000
4,000
Units
2,000
2,000
Machine hours
750
1,500
Setup hours
50
50
Refer to Figure 7-4. Calculate the overhead cost per unit for Bunsen Laptops, using a plantwide rate based on direct labor costs.
69. Figure 7-4.
Honeydew Company produces two products, a high end laptop computer under the label Bunsen Laptops, and
an inexpensive desktop computer under the label Beaker Computers. The two products use two overhead
activities, with the following costs:
Setting up equipment
$ 2,000
Machining
12,000
The controller has collected the expected annual prime costs for each product, the machine hours, the setup hours, and the expected production.
Bunsen
Beaker
Direct Labor
$20,000
$5,000
Direct Materials
15,000
4,000
Units
2,000
2,000
Machine hours
750
1,500
Setup hours
50
50
Refer to Figure 7-4. Calculate the overhead cost per unit for each Beaker Computer, using overhead rates based on machine hours and setup hours.
70. Figure 7-5.
Rizzo Manufacturing produces two types of cameras: 35mm and digital. The cameras are produced using one
continuous process. Four activities have been identified: machining, setups, receiving, and packing. Resource
drivers have been used to assign costs to each activity. The overhead activities, their costs, and the other related
data are as follows:
Product
Machine Hours
Setups
Receiving Orders
Packing Orders
35mm
10,000
100
200
400
Digital
10,000
250
800
2,000
Costs
$60,000
$40,000
$8,000
$24,000
Refer to Figure 7-5. Calculate the total overhead assigned to the 35mm cameras using only machine hours to calculate a plantwide rate.
71. Figure 7-5.
Rizzo Manufacturing produces two types of cameras: 35mm and digital. The cameras are produced using one
continuous process. Four activities have been identified: machining, setups, receiving, and packing. Resource
drivers have been used to assign costs to each activity. The overhead activities, their costs, and the other related
data are as follows:
Product
Machine Hours
Setups
Receiving Orders
Packing Orders
35mm
10,000
100
200
400
Digital
10,000
250
800
2,000
Costs
$60,000
$40,000
$8,000
$24,000
Refer to Figure 7-5. Calculate a consumption ratio for setups on the digital cameras.
72. Figure 7-5.
Rizzo Manufacturing produces two types of cameras: 35mm and digital. The cameras are produced using one
continuous process. Four activities have been identified: machining, setups, receiving, and packing. Resource
drivers have been used to assign costs to each activity. The overhead activities, their costs, and the other related
data are as follows:
Product
Machine Hours
Setups
Receiving Orders
Packing Orders
35mm
10,000
100
200
400
Digital
10,000
250
800
2,000
Costs
$60,000
$40,000
$8,000
$24,000
Refer to Figure 7-5. Using an activity rate for receiving based on receiving orders, assign receiving costs to the 35mm camera.
73. Figure 7-5.
Rizzo Manufacturing produces two types of cameras: 35mm and digital. The cameras are produced using one
continuous process. Four activities have been identified: machining, setups, receiving, and packing. Resource
drivers have been used to assign costs to each activity. The overhead activities, their costs, and the other related
data are as follows:
Product
Machine Hours
Setups
Receiving Orders
Packing Orders
35mm
10,000
100
200
400
Digital
10,000
250
800
2,000
Costs
$60,000
$40,000
$8,000
$24,000
Refer to Figure 7-5. Calculate an activity rate for packing based on packing orders.
74. A costing system that first assigns costs to activities and then to products is
75. A list of activities accompanied by information that describes each activity is an activity ____.
76. ____ are assigned using direct tracing and resource drivers.
77. In an activity dictionary, types of resources consumed is an example of a(n)
78. A(n) ____ is derived from the interview process (or written survey).
79. To calculate an activity rate, the ____ of each activity must be determined.
80. Interviews and surveys are used to identify
81. ____ can help a company become more competitive by providing more accurate cost data.
82. A company has two inspectors, each earning a salary of $75,000. One inspector works exclusively on
inspecting parts received from outside suppliers, while the other spends 30 percent of her time inspecting parts
and 70 percent of her time inspecting final products. How much labor cost should be assigned to the activity,
inspecting parts?
83. Last year, Stevita Inc. shipped 3,000,000 kilograms of goods to customers at a cost of $2,400,000. If an
individual customer orders 20,000 kilograms and produces $400,000 of revenue (total revenue is $40 million),
the amount of shipping cost assigned to the customer using activity-based costing would be:
84. Rollo Company has developed cost formulas for the drivers of the following production activities:
Driver
Activity
Fixed
Variable
Labor hours
Materials
-0-
20
Labor hours
Labor
-0-
10
Machine hours
Maintenance
10,000
8
Machine hours
Machining
50,000
2
Number of setups
Inspections
30,000
200
Number of setups
Setups
-0-
300
Number of purchase orders
Purchasing
75,000
3
The budgeted inspection cost for 20 setups is
85. Figure 7-1.
The receiving department of Owen has three activities: unloading, counting goods, and inspecting. Unloading
requires a forklift that is leased for $15,000 per year. The forklift is used only for unloading. The fuel for the
forklift is $2,000 per year. Inspection requires special testing equipment that has a depreciation of $500 per year
and an operating cost of $1,000 per year. Receiving has four employees who each have an average salary of
$35,000 per year. The work distribution matrix for the receiving personnel is as follows:
Percentage of Time
Activity
on Each Activity
Unloading
25%
Counting
40%
Inspecting
35%
Refer to Figure 7-1. Calculate the cost of unloading.
86. Figure 7-1.
The receiving department of Owen has three activities: unloading, counting goods, and inspecting. Unloading
requires a forklift that is leased for $15,000 per year. The forklift is used only for unloading. The fuel for the
forklift is $2,000 per year. Inspection requires special testing equipment that has a depreciation of $500 per year
and an operating cost of $1,000 per year. Receiving has four employees who each have an average salary of
$35,000 per year. The work distribution matrix for the receiving personnel is as follows:
Percentage of Time
Activity
on Each Activity
Unloading
25%
Counting
40%
Inspecting
35%
Refer to Figure 7-1. Calculate the cost of counting.
87. Figure 7-1.
The receiving department of Owen has three activities: unloading, counting goods, and inspecting. Unloading
requires a forklift that is leased for $15,000 per year. The forklift is used only for unloading. The fuel for the
forklift is $2,000 per year. Inspection requires special testing equipment that has a depreciation of $500 per year
and an operating cost of $1,000 per year. Receiving has four employees who each have an average salary of
$35,000 per year. The work distribution matrix for the receiving personnel is as follows:
Percentage of Time
Activity
on Each Activity
Unloading
25%
Counting
40%
Inspecting
35%
Refer to Figure 7-1. Calculate the cost for inspection.
88. Which of the following is not a possible source of customer diversity?
89. Figure 7-2.
Steller Manufacturing has two classes of distributors: JIT distributors and non-JIT distributors. The JIT
distributor places small, frequent orders and the non-JIT distributor tends to place larger, less frequent orders.
Both types of distributors purchase the same product. The customer activities and costs for the previous quarter
are found below:
Activity
JIT distributors
Non-JIT distributors
Sales Orders
400
25
Sales Calls
20
20
Service Calls
180
80
Average Order Size
75
1,200
Manufacturing cost/unit
$40
$40
Customer Costs:
Processing Sales Orders
$150,000
Selling Goods
$145,000
Servicing Goods
$185,000
Total
$480,000
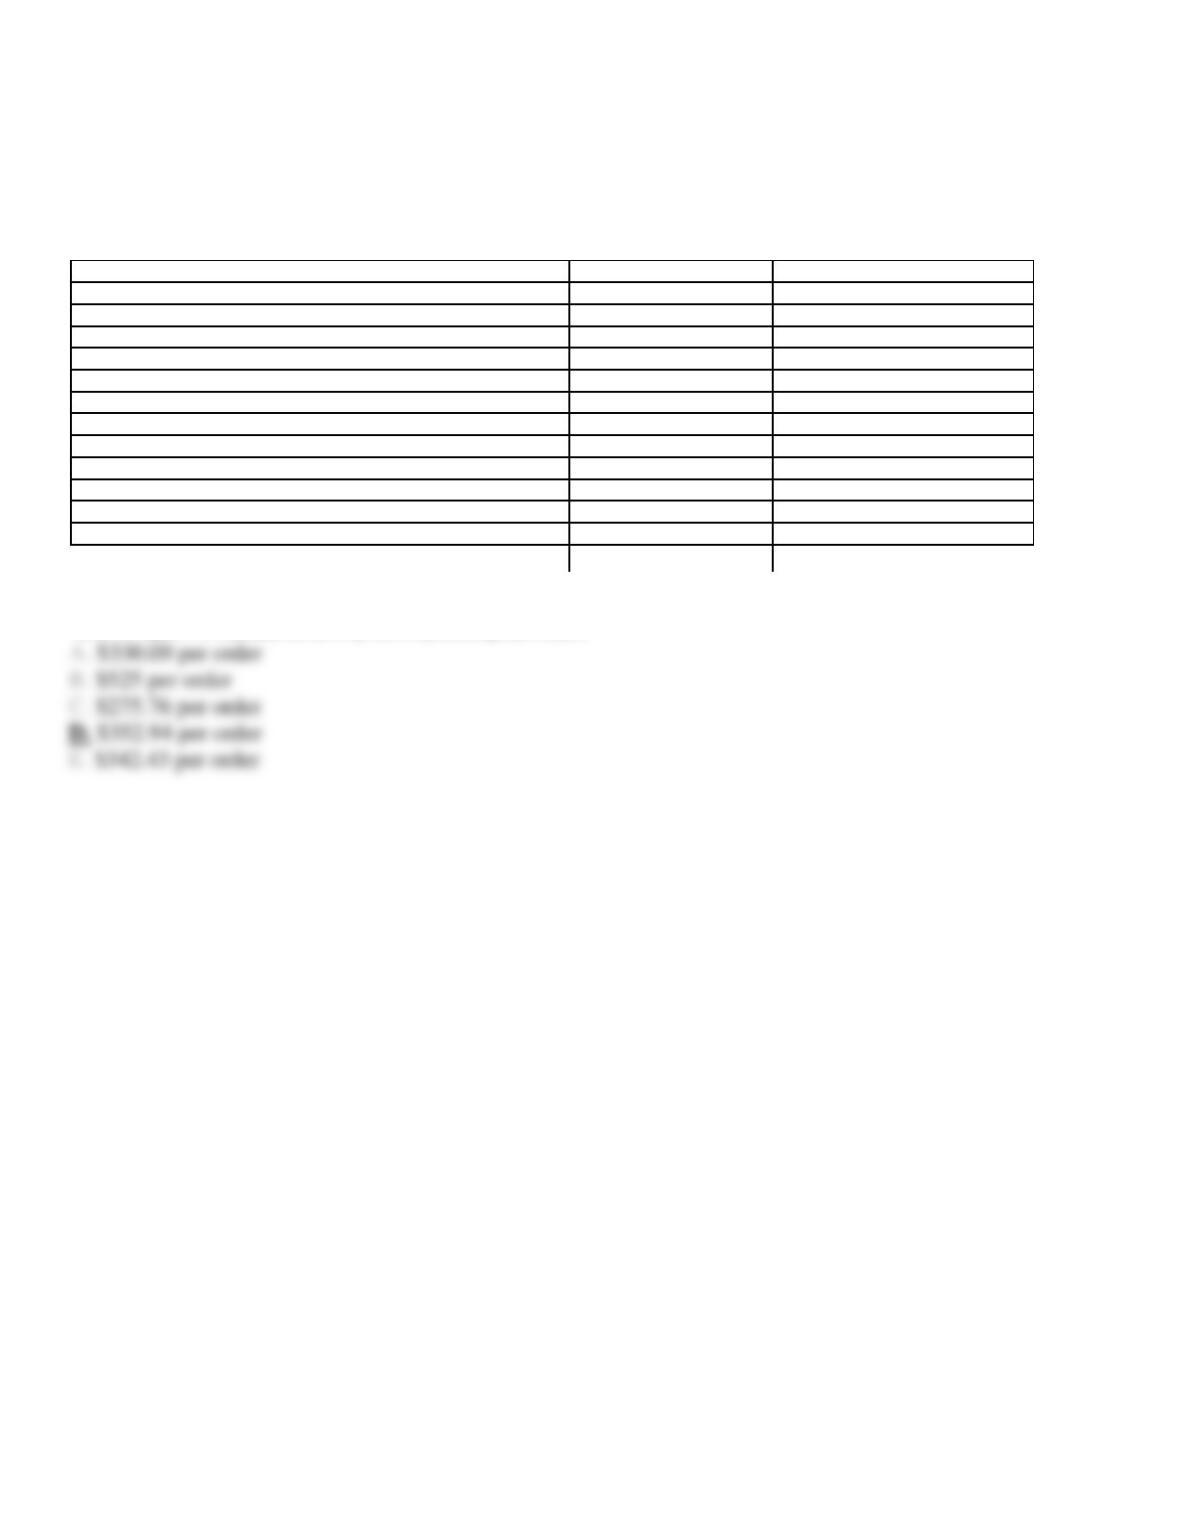
Refer to Figure 7-2. Calculate the activity rate for processing sales orders.
90. Figure 7-2.
Steller Manufacturing has two classes of distributors: JIT distributors and non-JIT distributors. The JIT
distributor places small, frequent orders and the non-JIT distributor tends to place larger, less frequent orders.
Both types of distributors purchase the same product. The customer activities and costs for the previous quarter
are found below:
Activity
JIT distributors
Non-JIT distributors
Sales Orders
400
25
Sales Calls
20
20
Service Calls
180
80
Average Order Size
75
1,200
Manufacturing cost/unit
$40
$40
Customer Costs:
Processing Sales Orders
$150,000
Selling Goods
$145,000
Servicing Goods
$185,000
Total
$480,000
Refer to Figure 7-2. Calculate the activity rate for selling goods.
91. Figure 7-2.
Steller Manufacturing has two classes of distributors: JIT distributors and non-JIT distributors. The JIT
distributor places small, frequent orders and the non-JIT distributor tends to place larger, less frequent orders.
Both types of distributors purchase the same product. The customer activities and costs for the previous quarter
are found below:
Activity
JIT distributors
Non-JIT distributors
Sales Orders
400
25
Sales Calls
20
20
Service Calls
180
80
Average Order Size
75
1,200
Manufacturing cost/unit
$40
$40
Customer Costs:
Processing Sales Orders
$150,000
Selling Goods
$145,000
Servicing Goods
$185,000
Total
$480,000
Refer to Figure 7-2. Calculate the activity rate for servicing goods.