
Saving, Investment, and the Financial System 6459
89.
A government budget deficit affects the supply of loanable funds, rather than the demand for
loanable funds,
because
a.
in our model of the loanable funds market, we define “loanable funds” as the flow of resources
available to fund private investment.
b.
in our model of the loanable funds market, we define “loanable funds” as the flow of resources
available from private saving.
c.
markets for government debt are fundamentally different from markets for private debt.
d.
of our assumption that the economy is closed.
90.
If we were to change the interpretation of the term “loanable funds” in such a way that
government budget deficits would affect the demand for loanable funds, rather than the supply of
loanable funds, then
a.
crowding out would not be a consequence of an increase in the budget deficit.
b.
higher interest rates would not be a consequence of an increase in the budget deficit.
c.
an increase in the budget deficit would cause the demand for loanable funds to decrease.
d.
we would be making only a semantic change in how we analyze the effects of government
budget deficits.

91.
Which of the following statements is not correct?
a.
If GDP is rising faster than debt, the government is, in some sense, living within its means.
b.
The ratio of debt to GDP in the United States has always been less than one.
c.
Debts during wars may distribute the burden of fighting the war more evenly across
generations.
d.
During times of peace in the United States, the ratio of debt to GDP sometimes rose.
92.
The ratio of debt to GDP in the United States
a.
tends to rise during wars.
b.
rose during the decade that began in 2001.
c.
fell during the late 1990s.
d.
All of the above are correct.

93.
The source of the supply of loanable funds is
a.
saving, and the source of the demand for loanable funds is investment.
b.
consumption, and the source of the demand for loanable funds is investment.
c.
investment, and the source of the demand for loanable funds is saving.
d.
the interest rate, and the source of the demand for loanable funds is saving.
94.
In the market for loanable funds, the interaction of the demand for, and supply of, loanable funds
determines the
equilibrium level of
a.
the inflation rate.
b.
gross domestic product.
c.
the real interest rate.
d.
the nominal interest rate.

95.
Suppose the government changed the tax laws, with the result that people were encouraged to
consume more and
save less. Using the loanable funds model, a consequence would be
a.
lower interest rates and lower investment.
b.
lower interest rates and greater investment.
c.
higher interest rates and lower investment.
d.
higher interest rates and higher investment.
96.
According to the loanable funds model, which of the following events would result in higher
interest rates and
greater saving?
a.
Firms become pessimistic about the future and, as a result, they cut back on their plans to buy
new
equipment and build new factories.
b.
The government goes from running a budget deficit to running a budget surplus.
c.
Congress passes a reform of the tax laws that encourages greater saving.
d.
Congress passes a reform of the tax laws that encourages greater investment.

97.
Which of the following counts as part of the supply of loanable funds?
a.
bank deposits and purchases of bonds
b.
bank deposits but not purchases of bonds
c.
purchases of bonds but not bank deposits
d.
neither purchases of bonds nor bank deposits
98.
Which of the following is included in the demand for loanable funds?
a.
investment and government borrowing
b.
investment but not government borrowing
c.
government borrowing but not investment
d.
neither government borrowing nor investment

99.
Which of the following is correct?
a.
In a closed economy, equilibrium in the market for loanable funds occurs where saving =
investment.
b.
Investment is the source for the supply of loanable funds.
c.
If there is a surplus in the market for loanable funds, the interest rate rises.
d.
All of the above are correct
100.
A policy that induces people to save more shifts
a.
the supply of loanable funds and raises interest rates.
b.
the supply of loanable funds and reduces interest rates.
c.
the demand for loanable funds and raises interest rates.
d.
the demand for loanable funds and reduces interest rates.

101.
A policy that induces people to save more shifts
a.
the supply of loanable funds rightward and increases investment.
b.
the supply of loanable funds leftward and decreases investment.
c.
the supply of loanable funds rightward and decreases investment.
d.
the supply of loanable funds leftward and increases investment.
102.
If the government instituted an investment tax credit, then which of the following would be higher
in equilibrium?
a.
saving and the interest rate
b.
saving but not the interest rate
c.
the interest rate but not saving
d.
neither saving nor the interest rate

103.
If the budget deficit increases then
a.
saving and the interest rate rise
b.
saving rises and the interest rate falls
c.
saving falls and the interest rate rises
d.
saving and the interest rate falls
104.
Which of the following are effects of an increased budget deficit?
a.
the supply of loanable funds does not change; a higher interest rate reduces private saving
b.
the supply of loanable funds does not change; a higher interest rate raises private saving
c.
at any interest rate the supply of loanable funds is less; a higher interest rate reduces private
saving
d.
at any interest rate the supply of loanable funds is less; a higher interest rate raises private
saving
Saving, Investment, and the Financial System 6467
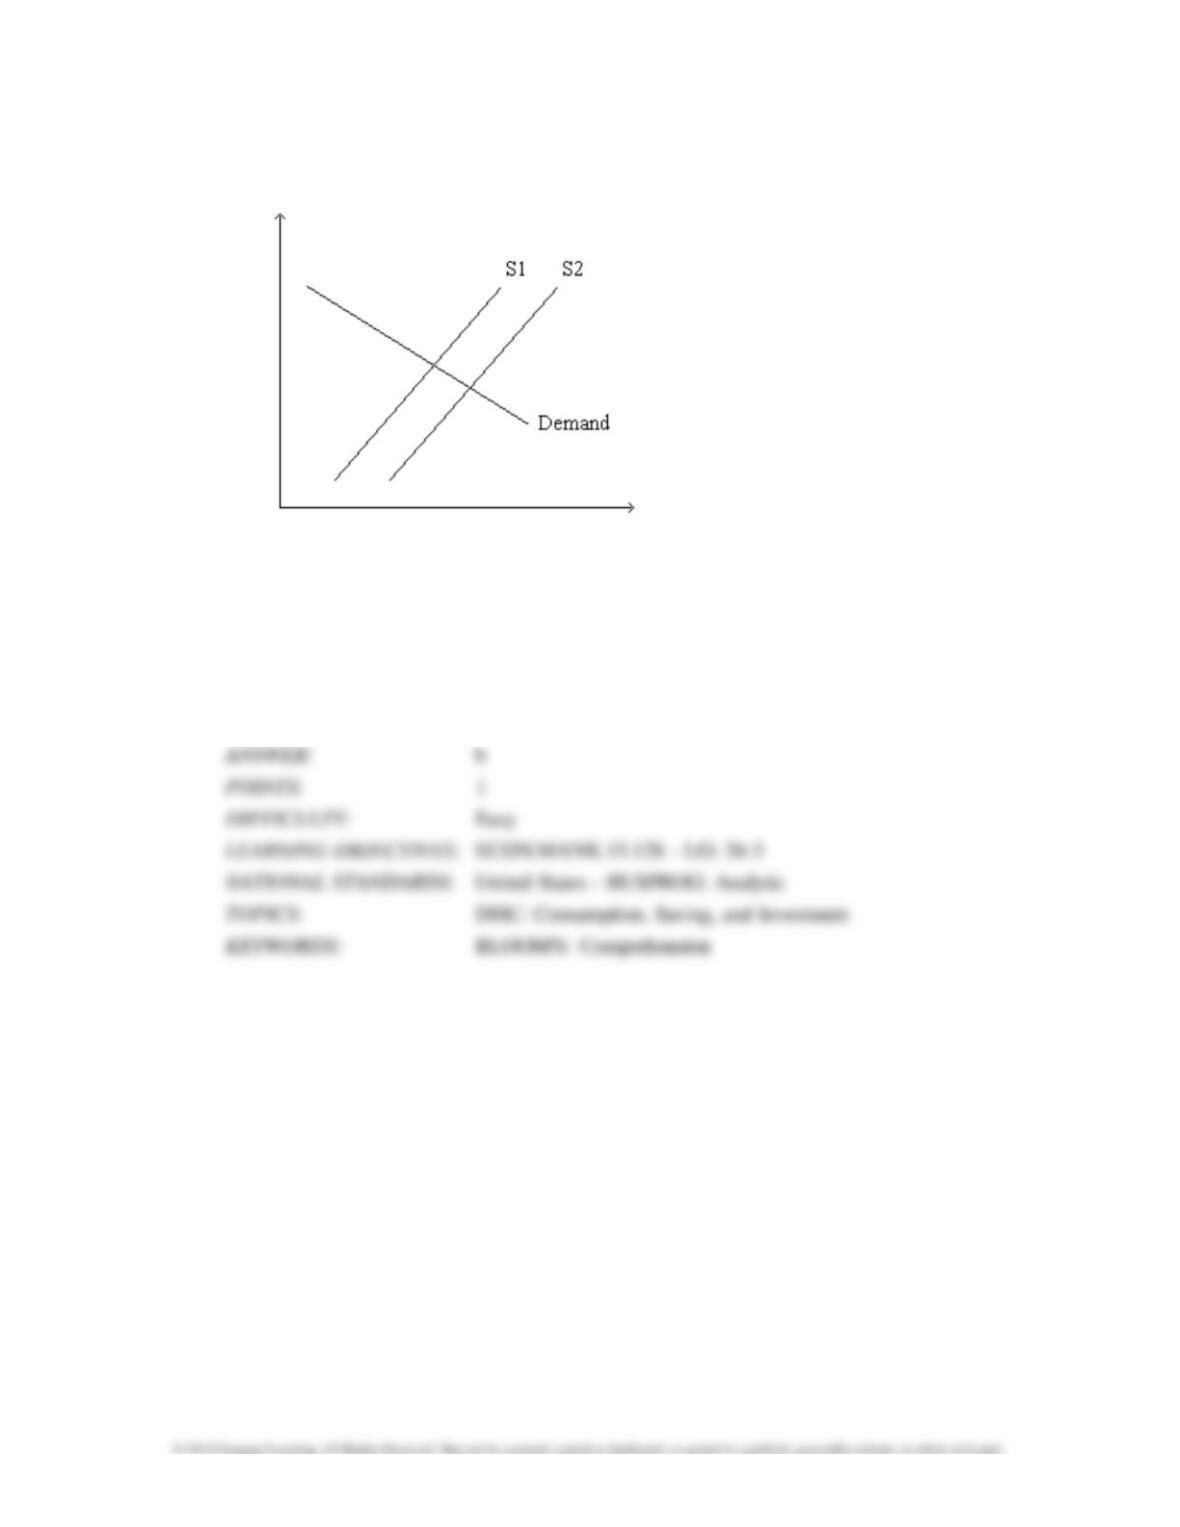
Figure 26-1. The figure depicts a demand-for-loanable-funds curve and two supply-of–
loanable-funds
curves.
105.
Refer to Figure 26-1. What is measured along the vertical axis of the graph?
a.
the nominal interest rate
b.
the real interest rate
c.
the quantity of investment
d.
the quantity of saving

106.
Refer to Figure 26–1. Which of the following events would shift the supply curve from S1 to
S2?
a.
In response to tax reform, firms are encouraged to invest more than they previously invested.
b.
In response to tax reform, households are encouraged to save more than they previously
saved.
c.
Government goes from running a balanced budget to running a budget deficit.
d.
Any of the above events would shift the supply curve from S1 to S2.
Saving, Investment, and the Financial System 6469
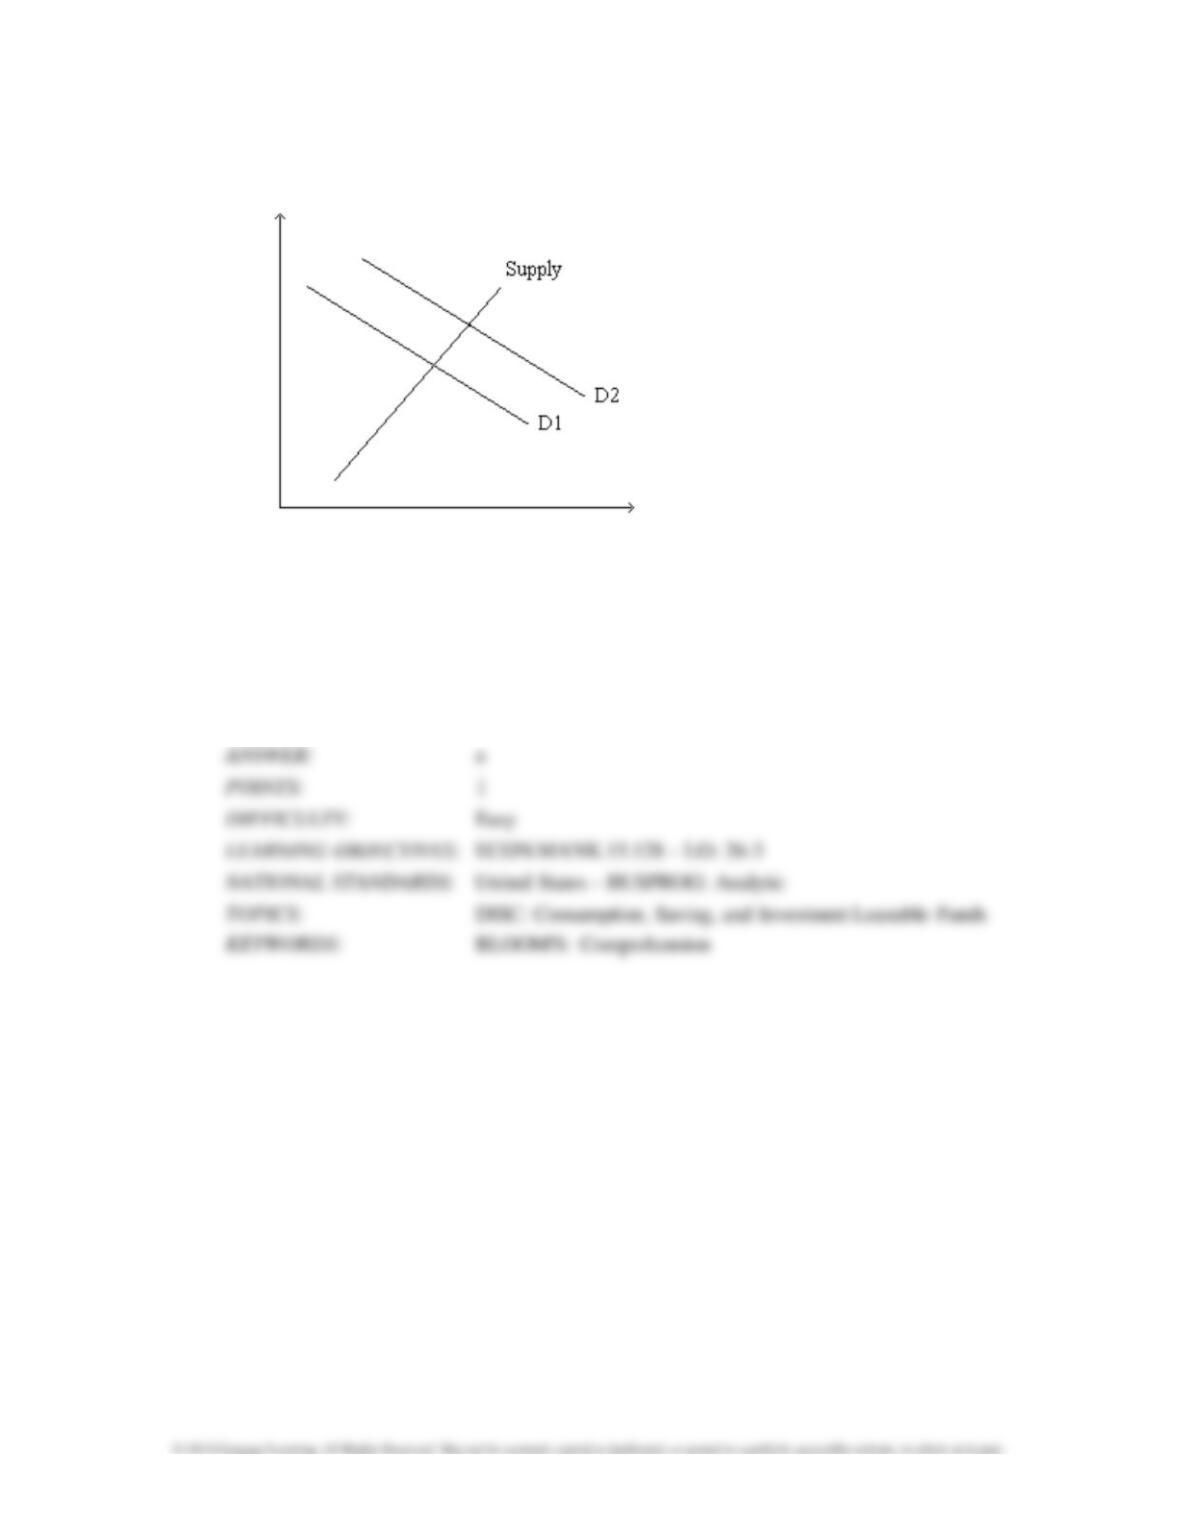
Figure 26-2. The figure depicts a supply-of-loanable-funds curve and two demand-for-
loanable-funds
curves.
107.
Refer to Figure 26-2. What is measured along the horizontal axis of the graph?
a.
the quantity of loanable funds
b.
the size of the government budget deficit or surplus
c.
the real interest rate
d.
the nominal interest rate
108.
Refer to Figure 26-2. Which of the following events would shift the demand curve from D1 to
D2?
a.
The government goes from running a budget deficit to running a budget surplus.
b.
Firms become optimistic about the future and, as a result, they plan to increase their purchases
of new
equipment and construction of new factories.
c.
A change in the tax laws encourages people to consume less and save more.
d.
A change in the tax laws encourages people to consume more and save less.
Saving, Investment, and the Financial System 6471
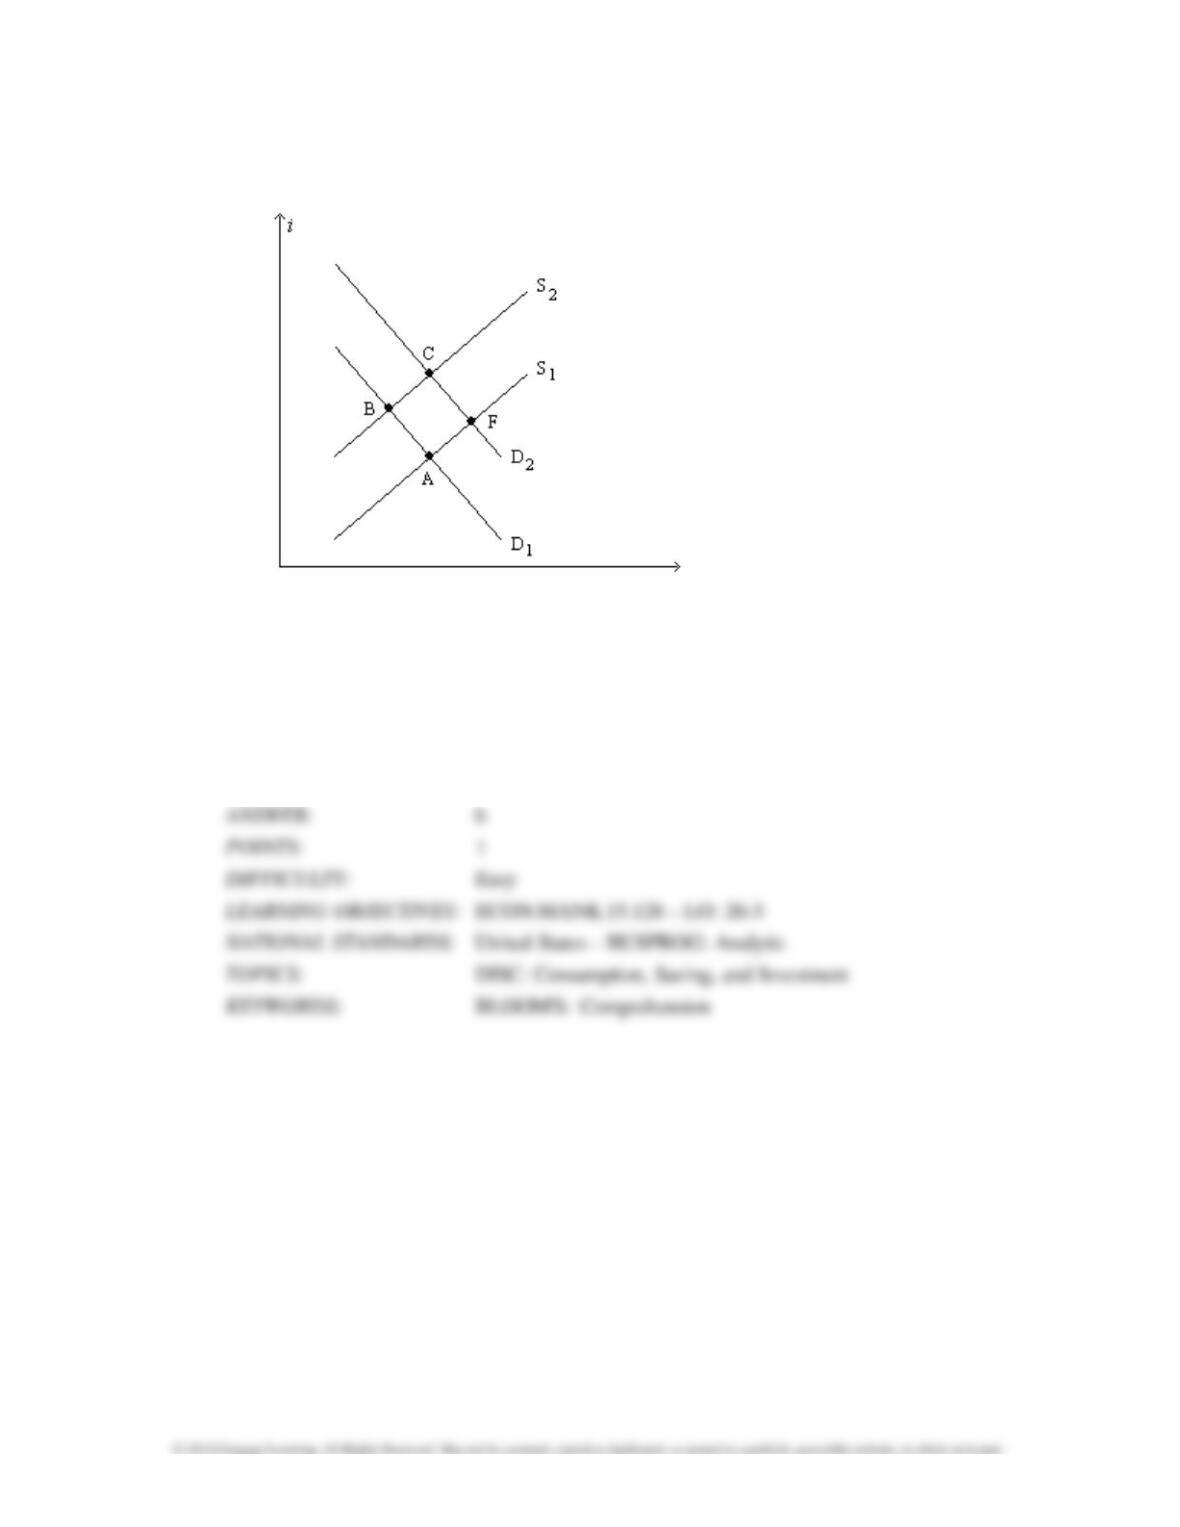
Figure 26-3. The figure shows two demand-for-loanable-funds curves and two supply-of–
loanable-funds curves.
109.
Refer to Figure 26-3. What, specifically, does the label on the vertical axis, i, represent?
a.
the nominal interest rate
b.
the real interest rate
c.
the inflation rate
d.
the dividend yield

110.
Refer to Figure 26-3. A shift of the supply curve from S1 to S2 is called
a.
an increase in the supply of loanable funds.
b.
an increase in the quantity of loanable funds supplied.
c.
a decrease in the supply of loanable funds.
d.
a decrease in the quantity of loanable funds supplied.
111.
Refer to Figure 26–3. A shift of the demand curve from D1 to D2 is called
a.
an increase in the demand for loanable funds, and that increase would originate from people
who had some
extra income they wanted to lend.
b.
an increase in the demand for loanable funds, and that increase would originate from
households and firms
who wish to borrow to make investments.
c.
a decrease in the demand for loanable funds, and that decrease would originate from people
who had some
extra income they wanted to lend.
d.
a decrease in the demand for loanable funds, and that decrease would originate from
households and firms
who wish to borrow to make investments.

112.
Refer to Figure 26-3. Which of the following movements shows the effects of the government
going from a
budget surplus to a budget deficit?
a.
a movement from Point A to Point B
b.
a movement from Point B to Point A
c.
a movement from Point A to Point F
d.
a movement from Point B to Point C
113.
Refer to Figure 26-3. Which of the following movements shows the effects of households’
decision to save more?
a.
a movement from Point A to Point B
b.
a movement from Point F to Point A
c.
a movement from Point C to Point F
d.
a movement from Point B to Point C
114.
Refer to Figure 26-3. Which of the following movements would be consistent with the
government budget going
from deficit to surplus and the simultaneous enactment of an
investment tax credit?
a.
a movement from Point A to Point C
b.
a movement from Point B to Point A
c.
a movement from Point B to Point F
d.
a movement from Point C to Point B
Saving, Investment, and the Financial System 6475
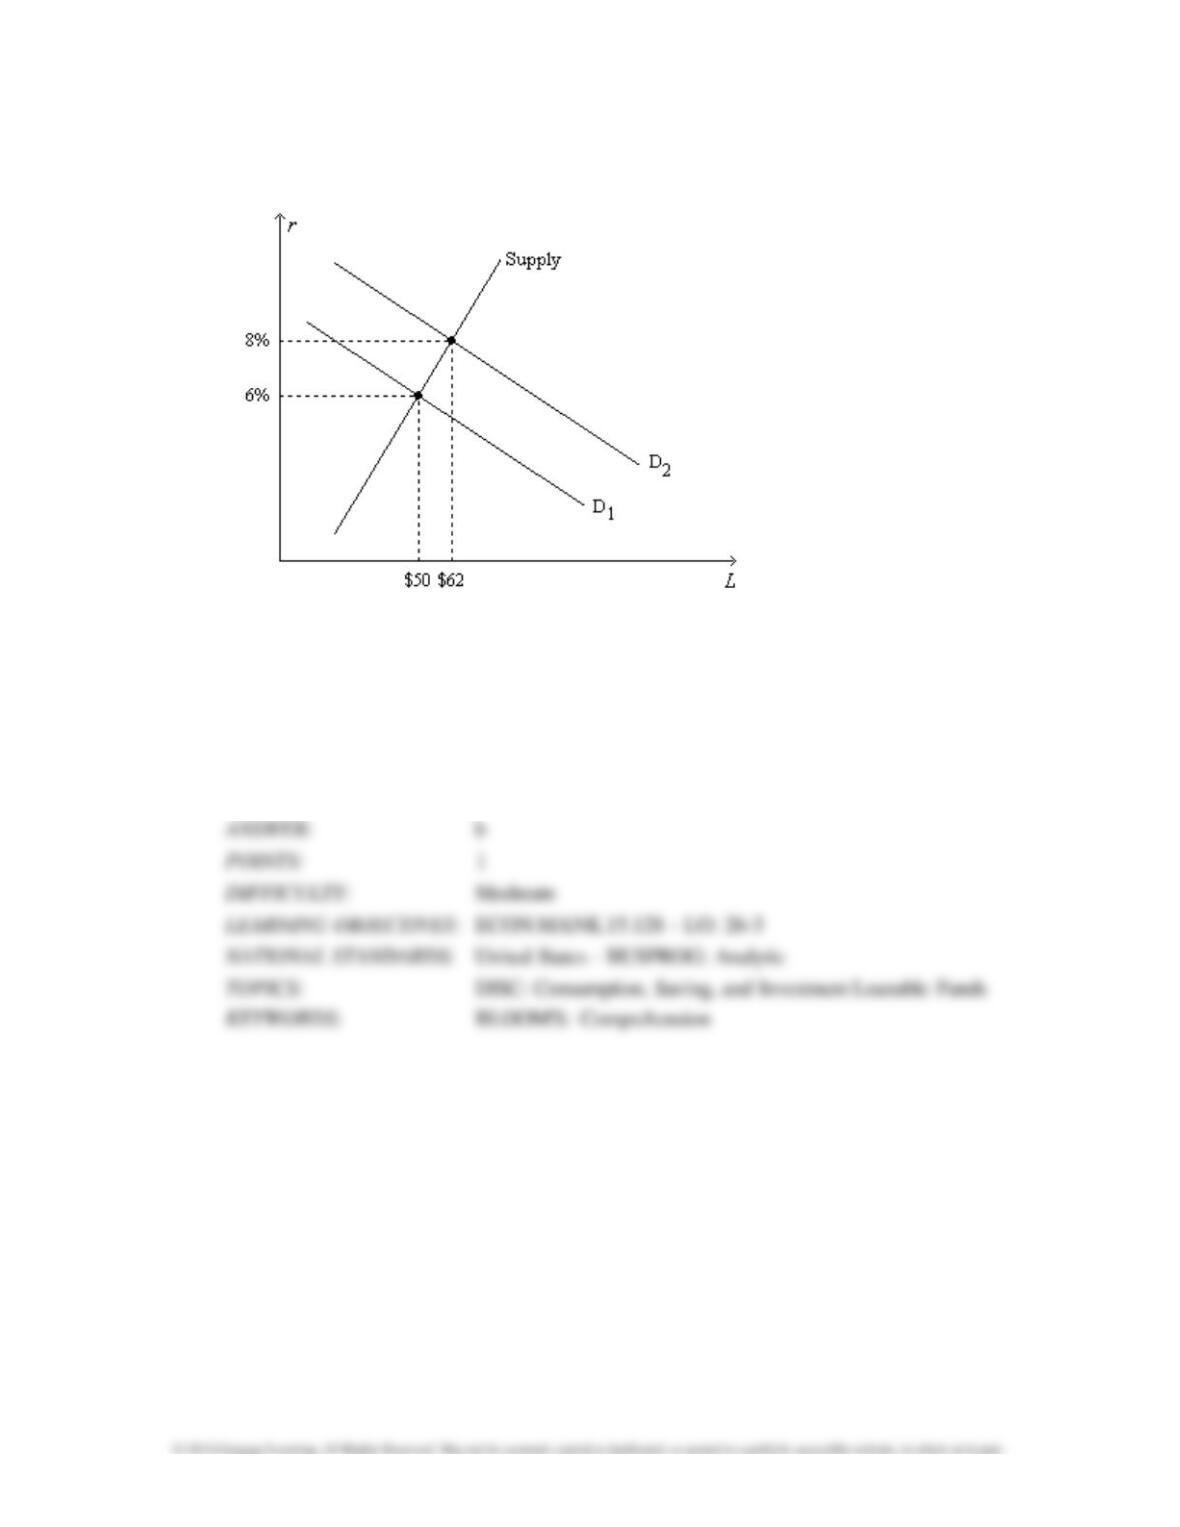
Figure 26-4. On the horizontal axis of the graph, L represents the quantity of loanable funds in
billions of dollars.
115.
Refer to Figure 26–4. Which of the following events could explain a shift of the demand-for-
loanable-funds curve
from D1 to D2?
a.
The tax code is reformed to encourage greater saving.
b.
The tax code is reformed to encourage greater investment.
c.
The government starts running a budget deficit.
d.
The government starts running a budget surplus.

116.
Refer to Figure 26-4. The position and/or slope of the Supply curve are influenced by
a.
the level of public saving.
b.
the level of national saving.
c.
decisions made by people who have extra income they want to save and lend out.
d.
All of the above are correct.
117.
Refer to Figure 26–4. Regard the position of the Supply curve as fixed, as on the graph. If the
real interest rate is
8 percent, the inflation rate is 3 percent, and the market for loanable funds is
in equilibrium, then the position of the
demand-for-loanable-funds curve must be
a. D1.
b. D2.
c. between D1 and D2.
d. to the right of D2.

118.
Refer to Figure 26-4. Regard the position of the Supply curve as fixed, as on the graph. If the
real interest rate is
4 percent, the inflation rate is 2 percent, and the market for loanable funds is
in equilibrium, then the position of the
demand-for-loanable-funds curve must be
a. D1.
b. D2.
c. between D1 and D2.
d. to the left of D1.
119.
Refer to Figure 26-4. If the equilibrium quantity of loanable funds is $56 billion and if the rate
of inflation is 4
percent, then the equilibrium real interest rate is
a.
lower than 6 percent.
b.
6 percent.
c.
between 6 percent and 8 percent.
d.
higher than 8 percent.

120.
Refer to Figure 26–4. If the equilibrium quantity of loanable funds is $50 billion and if the
equilibrium nominal
interest rate is 8 percent, then
a.
there is an excess supply of loanable funds at a real interest rate of 6 percent.
b.
there is an excess demand for loanable funds at a real interest rate of 8 percent.
c.
the rate of inflation is approximately 2 percent.
d.
the rate of inflation is approximately 14 percent.
121.
Refer to Figure 26–4. If the equilibrium quantity of loanable funds is $56 billion and if the rate
of inflation is 5
percent, then the equilibrium nominal interest rate is
a.
11 percent.
b.
approximately 6 percent.
c.
between 6 percent and 8 percent.
d.
between 11 percent and 13 percent.