Chapter 18: Pricing and Profitability Analysis
157. Hang 10 Inc. produces two types of surfboards: basic and deluxe. The basic surfboard sells for $25 and
the deluxe sells for $100. Hang 10 is budgeting sales for 2016 of 1,000 basic surfboards and 650 deluxe.
Variable costs associated with the basic surfboard amount to $10 and $40 for the deluxe. Actual units
sold were 1,200 basic and 550 deluxe.
Required:
a. Calculate the contribution margin variance
b. Calculate the sales mix variance
Chapter 18: Pricing and Profitability Analysis
Chapter 18: Pricing and Profitability Analysis
158. Morgantown Avionics produces two types of altimeters, an Analog model and a Digital model. Budgeted and actual
data for the two models are shown below:
Budgeted Amounts:
Analog Model
Digital Model
Total
Sales:
($90 25,000)
$2,250,000
($150 15,000)
$2,250,000
$4,500,000
Variable Expenses
500,000
750,000
$1,250,000
Contribution Margin
$1,750,000
$1,500,000
$3,250,000
Actual Amounts:
Analog Model
Digital Model
Total
Sales:
($88 25,900)
$2,279,200
($160 13,500)
$2,160,000
$4,439,200
Variable Expenses
518,000
675,000
1,193,000
Contribution Margin
$1,761,200
$1,485,000
$3,246,200
Calculate:
a. Contribution margin variance
b. Budgeted average unit contribution margin
c. Contribution margin volume variance
Chapter 18: Pricing and Profitability Analysis
159. The following information about Morgantown Avionics’ two Altimeter models is provided:
Budgeted
Actual
Analog model sales in units
25,000
25,900
Digital model sales in units
15,000
13,500
Analog model budgeted contribution margin
$70
Digital model budgeted contribution margin
$100
Budgeted average unit contribution margin
$81.25
Total contribution margin
$3,250,000
$3,246,200
Calculate the sales mix variance.
Chapter 18: Pricing and Profitability Analysis
160. The following information about Morgantown Avionics’ two Altimeter models is provided:
Budgeted
Actual
Analog model sales in units
25,000
25,900
Digital model sales in units
15,000
13,500
Total contribution margin
$3,250,000
Budgeted average unit contribution margin
$81.25
Budgeted unit sales for the entire Avionics industry were 2,500,000 of all model types and actual unit sales for the
industry were 2,550,000.
Calculate:
a. Market share variance (take percentages out to 4 significant digits)
b. Market size variance
Chapter 18: Pricing and Profitability Analysis
161. Custom Choppers, Inc. produces two types of motorcycles, a standard model which sells for $5,000, and a
customized model which sells for $10,000. Budgeted sales for the year are 300 standard models and 100
customized models. Variable expenses are $1,500 for the standard model and $3,500 for the customized model.
Actual sales were 500 standard models at $6,000 and 150 customized models at $12,000.
Calculate:
a. Contribution Margin Variance
b. Budgeted Average Unit Contribution Margin
c. Contribution Margin Volume Variance
Indicate whether Favorable (F) or Unfavorable (U)
Chapter 18: Pricing and Profitability Analysis
162. The following information about the two motorcycle models produced by Custom Choppers, Inc. is given:
Budgeted
Actual
Standard model sales in units
300
500
Customized model sales in units
100
150
Standard model budgeted contribution margin
$3,500
Customized model budgeted contribution margin
$6,500
Budgeted average unit contribution margin
$4,250
Total contribution margin
$1,700,000
$3,525,000
Calculate the sales mix variance.
Chapter 18: Pricing and Profitability Analysis
163. The following information about Morgantown Avionics’ two Altimeter models is provided:
Budgeted
Actual
Standard model sales in units
300
500
Customized model sales in units
100
150
Total contribution margin
$1,700,000
Budgeted average unit contribution margin
$4,250
Budgeted unit sales for the entire Motorcycle Choppers industry were 4,000 of all model types and actual
unit sales for the industry were 4,600.
Calculate:
a. Market share variance (take percentages out to 4 significant digits)
b. Market size variance
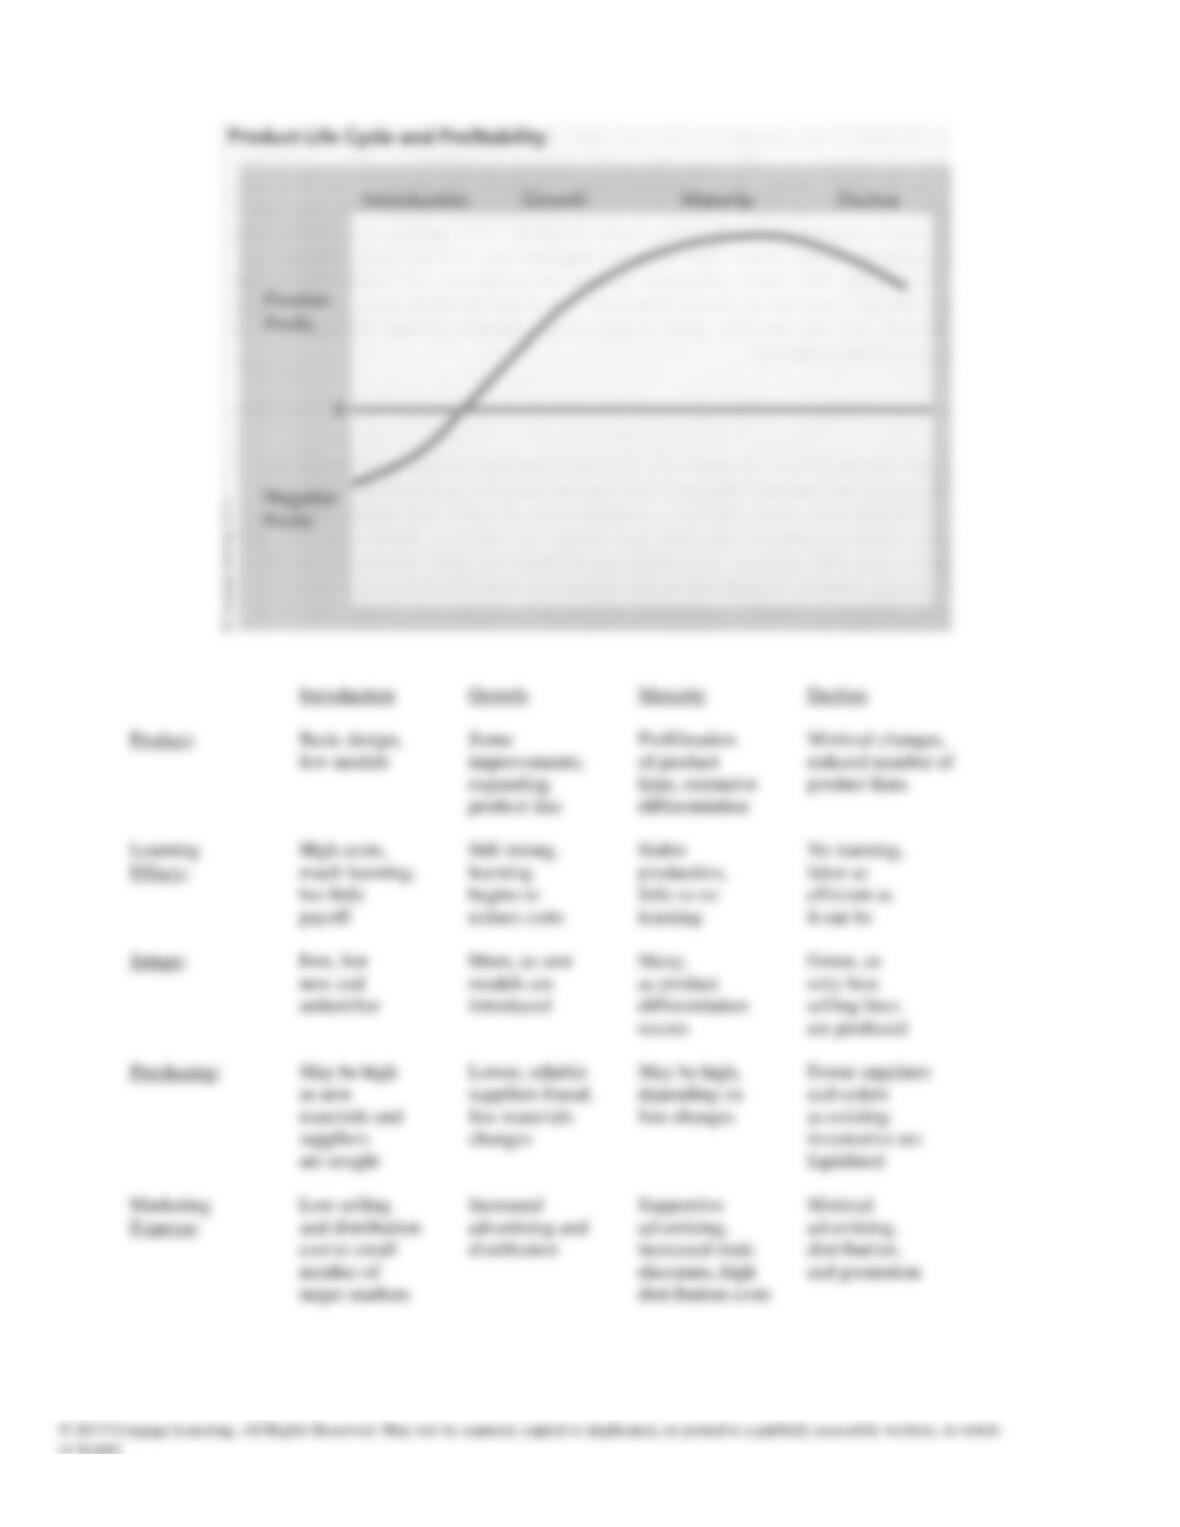
164. Many products have a predictable profit or product
life cycle. Describe the product life cycle from the
marketing perspective. In addition, graph profit
versus the different phases.
Finally, discuss the impact of the product life cycle on products, learning effects, setups, purchasing, and
marketing expenses.
Chapter 18: Pricing and Profitability Analysis

Chapter 18: Pricing and Profitability Analysis
165. Discuss the limitation of profit measurement.