12) Refer to Figure 18-2. If the government imposes an excise tax of $1.00 on every unit sold,
the producer’s burden of the tax
A) is Pa – Pd under either supply curve.
B) is Pb – Pe under either supply curve.
C) is Pa – Pd if the supply curve is S0 and Pb – Pe if the supply curve is S1.
D) is Pc – Pd if the supply curve is S0 and Pc – Pe if the supply curve is S1.
13) Refer to Figure 18-2. If the government imposes an excise tax of $1.00 on every unit sold,
the producer’s burden of the tax
A) is greater under the more elastic supply curve S0.
B) is greater under the less elastic supply curve S0.
C) is greater under the less elastic supply curve S1.
D) is the same under either supply curve because there is a single demand curve that captures
buyers’ market behavior.
14) Refer to Figure 18-2. If the government imposes an excise tax of $1.00 on every unit sold,
the government’s revenue from the tax is represented by the area
A) (PaPc × Qa) if the supply curve is S0 and (PbPc × Qb) if the supply curve is S1.
B) (PaPd × Qa) if the supply curve is S0 and (PbPe × Qb) if the supply curve is S1.
C) (PaPe × Qa) under either supply curve.
D) (PbPe × Qb) under either supply curve.
15) Refer to Figure 18-2. If the government imposes an excise tax of $1.00 on every unit sold,
the government’s revenue from the tax
A) is larger if the supply curve is S0.
B) is larger if the supply curve is S1.
C) is identical under either supply curve.
D) is not maximized.
16) Refer to Figure 18-2. If the government imposes an excise tax of $1.00 on every unit sold,
what is the size of the deadweight loss, if there is any?
A) the area adc if the supply curve is S0 and the area bec if the supply curve is S1.
B) the area afcd if the supply curve is S0 and the area bfce if the supply curve is S1.
C) the area becf under either supply curve.
D) There is no deadweight loss; revenue raised is used to fund government projects.
17) Refer to Figure 18-2. If the government imposes an excise tax of $1.00 on every unit sold,
A) the deadweight loss is identical under either supply curve.
B) the deadweight loss is greater under the supply curve S1.
C) the deadweight loss is greater under the supply curve S0.
D) there is no deadweight loss since revenue raised is used to fund government projects.
18) When the elasticity of demand for a product is smaller than the elasticity of supply, sellers
pay the majority of the tax on the product.
19) If the government wants to minimize the welfare loss of a tax, it should tax goods with more
inelastic demands or supplies.
20) For a given supply curve, the deadweight loss from the imposition of a tax is smaller if
demand is more elastic.
21) Explain the effect of price elasticities of supply and demand on tax incidence.
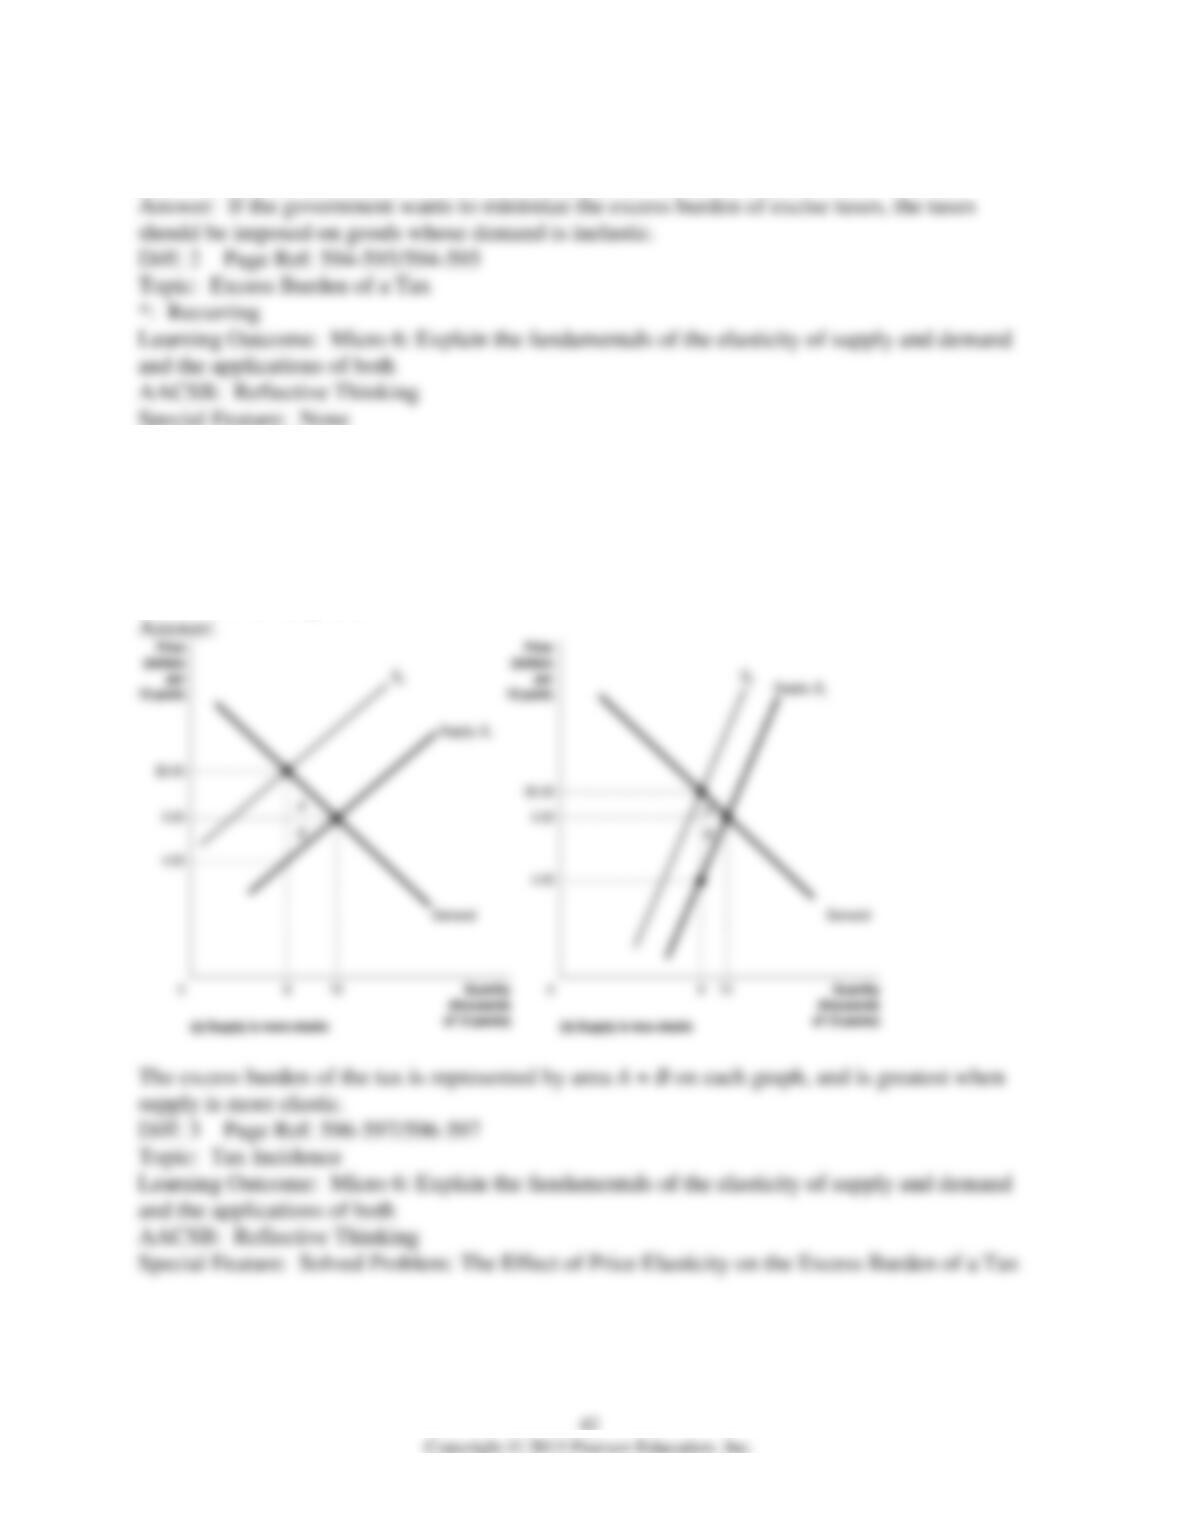
22) If the government is most interested in minimizing excess burden of an excise tax, should it
impose the tax on goods that are elastic or on goods that are inelastic?
23) Suppose the equilibrium price and quantity of a 12-pack of Dr. Pepper are $5.00 and 10,000
12-packs, respectively, and the government decides to impose a $1.00 tax on every 12-pack of
carbonated soft drinks. Draw two supply and demand graphs, one showing the excess burden of
the tax when supply is less elastic and the other showing the excess burden of the tax when
supply is more elastic. Identify the excess burden of the tax on each graph. On which graph is the
excess burden the greatest?
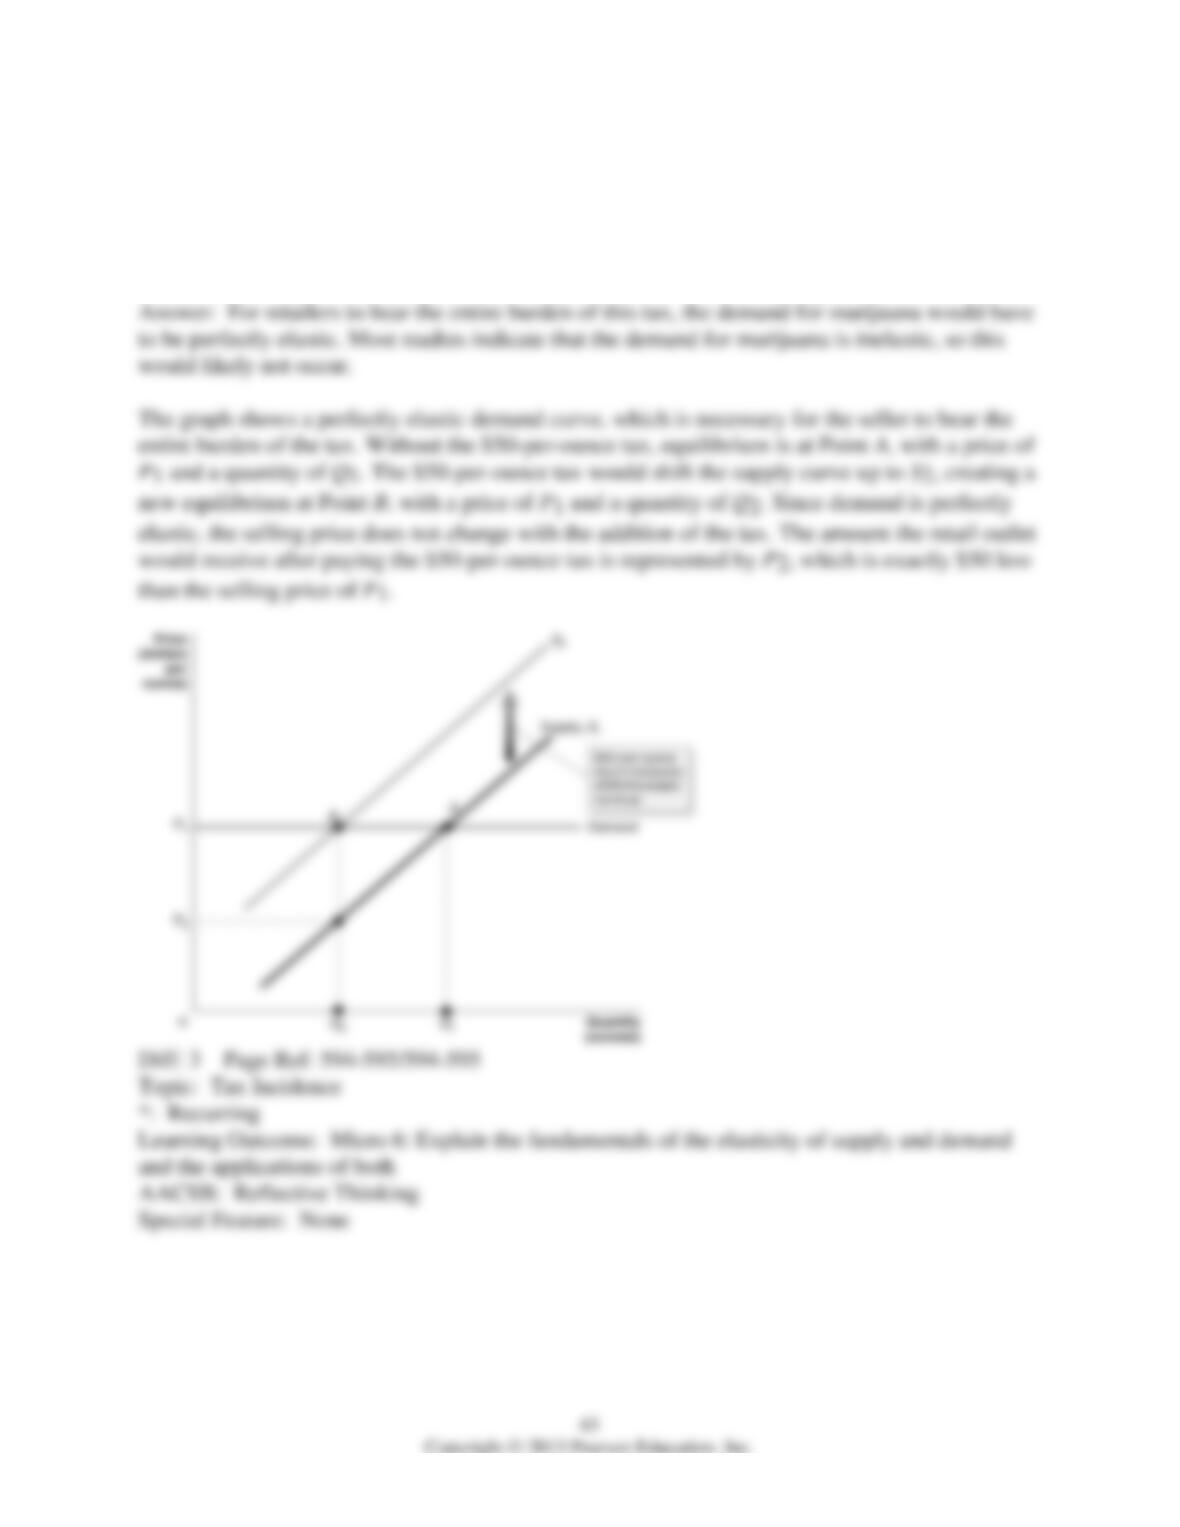
24) Suppose in an effort to raise tax revenue, the state of Vermont decides to legalize the sale of
marijuana. The state will charge a tax of $50 per ounce on each sale, and the state claims that
retailers will bear the entire burden of this tax. Draw a graph illustrating the situation where
retail outlets would bear the entire tax burden of $50 per ounce of marijuana. Explain what
would need to be true about the demand for marijuana for retailers to bear the entire burden of
this tax, and if this would likely occur if marijuana sales were actually legalized.
18.4 Income Distribution and Poverty
1) What is the United States government’s formal definition of the poverty line?
A) It is a level of annual income equal to total income in society divided by the population,
adjusted for a family of four.
B) It is a level of annual income equal to the amount of money necessary to purchase the
minimal quantity of food required for adequate nutrition.
C) It is the annual income level below which a household is exempt from taxes.
D) It is a level of annual income equal to three times the amount of money necessary to purchase
the minimal quantity of food required for adequate nutrition.
2) What is the poverty rate?
A) the rate at which the number of people relative to the size of the population fall below the
poverty line
B) the percentage of the population earning an annual income below the poverty line, according
to the federal government’s definition
C) the percentage of working adults whose annual income is sufficiently low as to be are exempt
from paying income taxes
D) the percentage of households who qualify for government assistance to meet the minimal
requirement for adequate nutrition
3) Between 1980 and 2011, income inequality in the United States has increased in part due to
rapid technological change. How does technological change contribute to income inequality?
A) Advancements in technology displace skilled and unskilled workers in certain fields, leading
to higher unemployment rates.
B) Technology complements the skills of the well-educated while rendering redundant the labor
services of unskilled and low-skilled workers. This causes a decline in the wages of low and
unskilled workers relative to other workers.
C) The opportunity cost of investing in technology is investments in human capital. The resulting
decrease in labor’s marginal productivity has lead to lower wages.
D) Technological change favors the owners of capital and since high income individuals tend to
own capital, income inequality is further exacerbated.
4) Between 1980 and 2011, income inequality in the United States has increased in part due to
expanding international trade. How does expanding international trade contribute to income
inequality?
A) It increases the demand for a wide array of products which in turn increases prices beyond the
reach of average income individuals.
B) It allows producers to exploit workers and reduce the wages they are willing to pay workers.
C) Domestic firms can now hire low-skilled workers anywhere in the world, putting U.S.
workers in competition with foreign workers. This has caused the wages of unskilled workers to
be depressed relative to the wages of other workers.
D) It reduces the cost of producing goods and therefore lowers the value of labor’s services.
5) A statistical tool used to measure inequality is
A) the Lorenz curve.
B) the Gini coefficient.
C) the absolute poverty rate.
D) the relative poverty rate
6) The Gini coefficient is measured by
A) summing up the cumulative income percentages on the Lorenz curve.
B) summing up the total income earned by the population and dividing by the size of the
population.
C) using the formula: area between perfect inequality and Lorenz curve ÷ area between the line
of perfect equality to the Lorenz curve.
D) using the formula: area between the line of perfect equality and the Lorenz curve ÷ the area
under the line of perfect equality.
7) As the value of the Gini coefficient approaches zero,
A) income distribution becomes less unequal.
B) income distribution becomes more unequal.
C) the percentage of the population under the poverty line increases.
D) the percentage of the population under the poverty line decreases.
8) As the value of the Gini coefficient approaches one,
A) income distribution becomes less unequal.
B) income distribution becomes more unequal.
C) the percentage of the population under the poverty line increases.
D) the percentage of the population under the poverty line decreases.
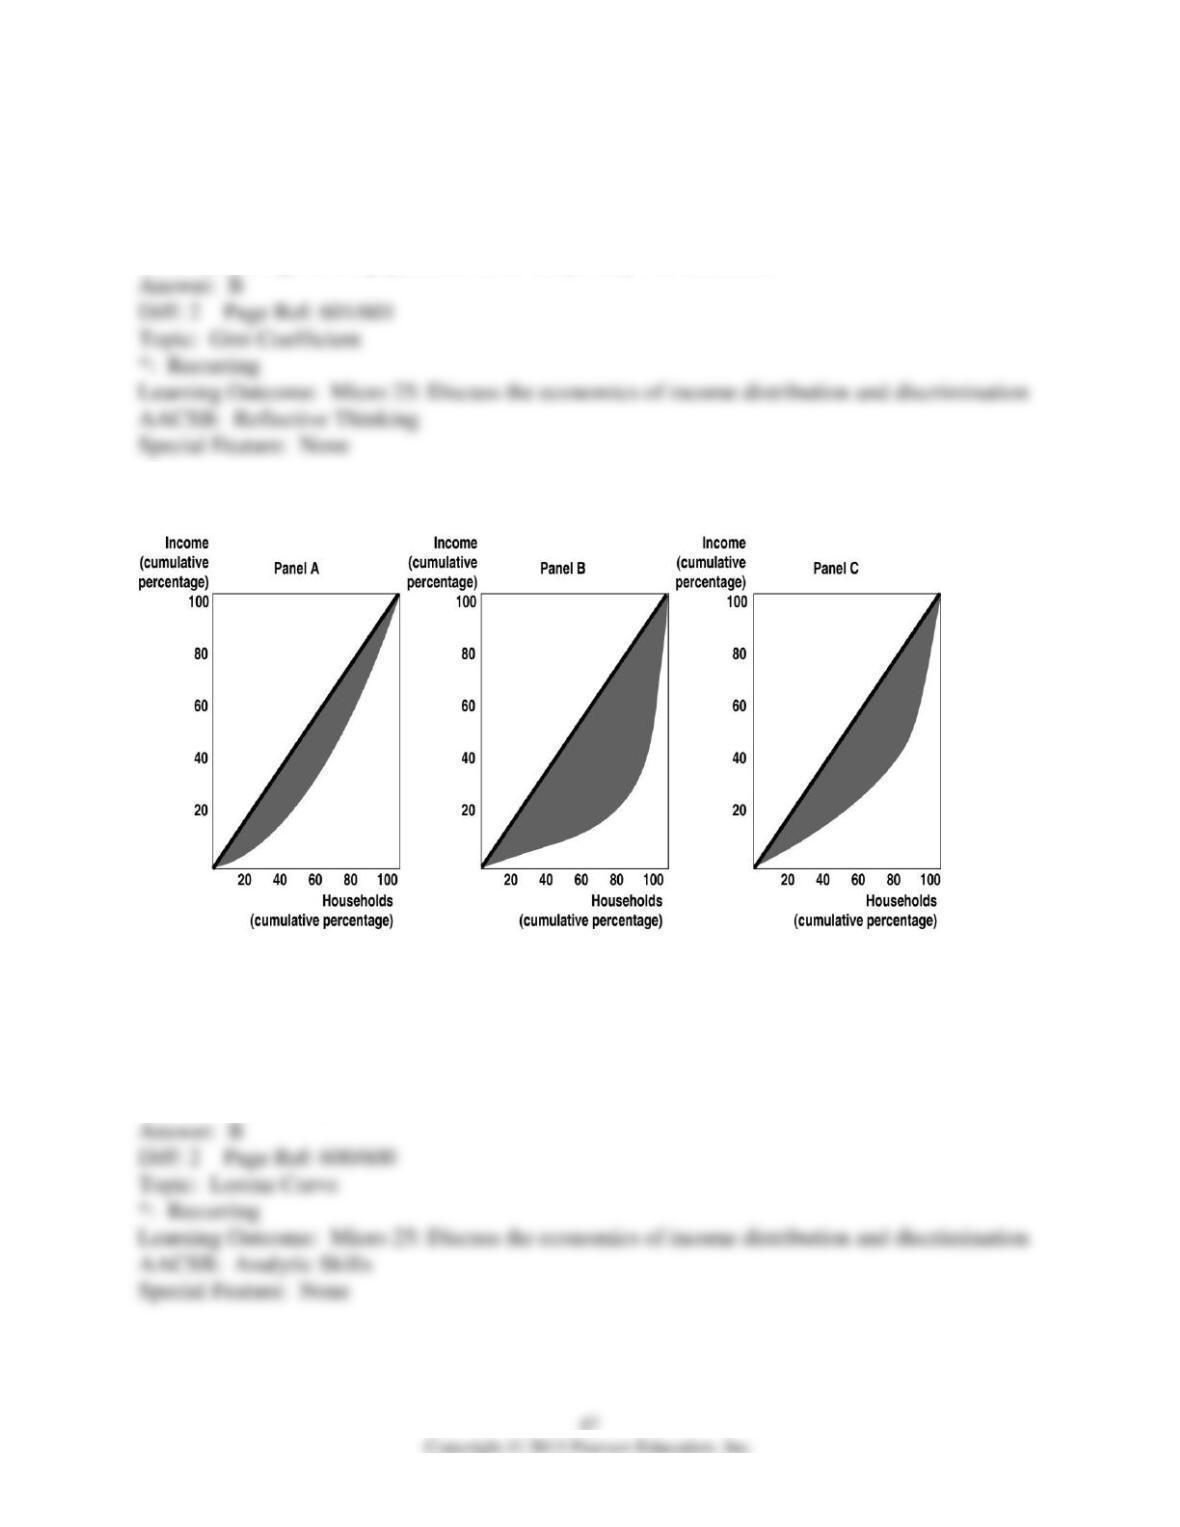
Figure 18-3
9) Refer to Figure 18-3. Rank the above panels in terms of most unequal income distribution to
least unequal income distribution.
A) Panel A, Panel B, Panel C
B) Panel B, Panel C, Panel A
C) Panel A, Panel C, Panel B
D) Panel C, Panel B, Panel A
10) Suppose the United States has a Gini coefficient of 0.4 and Sweden has a Gini coefficient of
0.25. Which of the following statements is true?
A) The distribution of income is more equal in the United States.
B) The distribution of income is more equal in the Sweden.
C) Income distribution is changing faster in the United States.
D) Without information on population, it is not possible to compare income distribution between
countries.
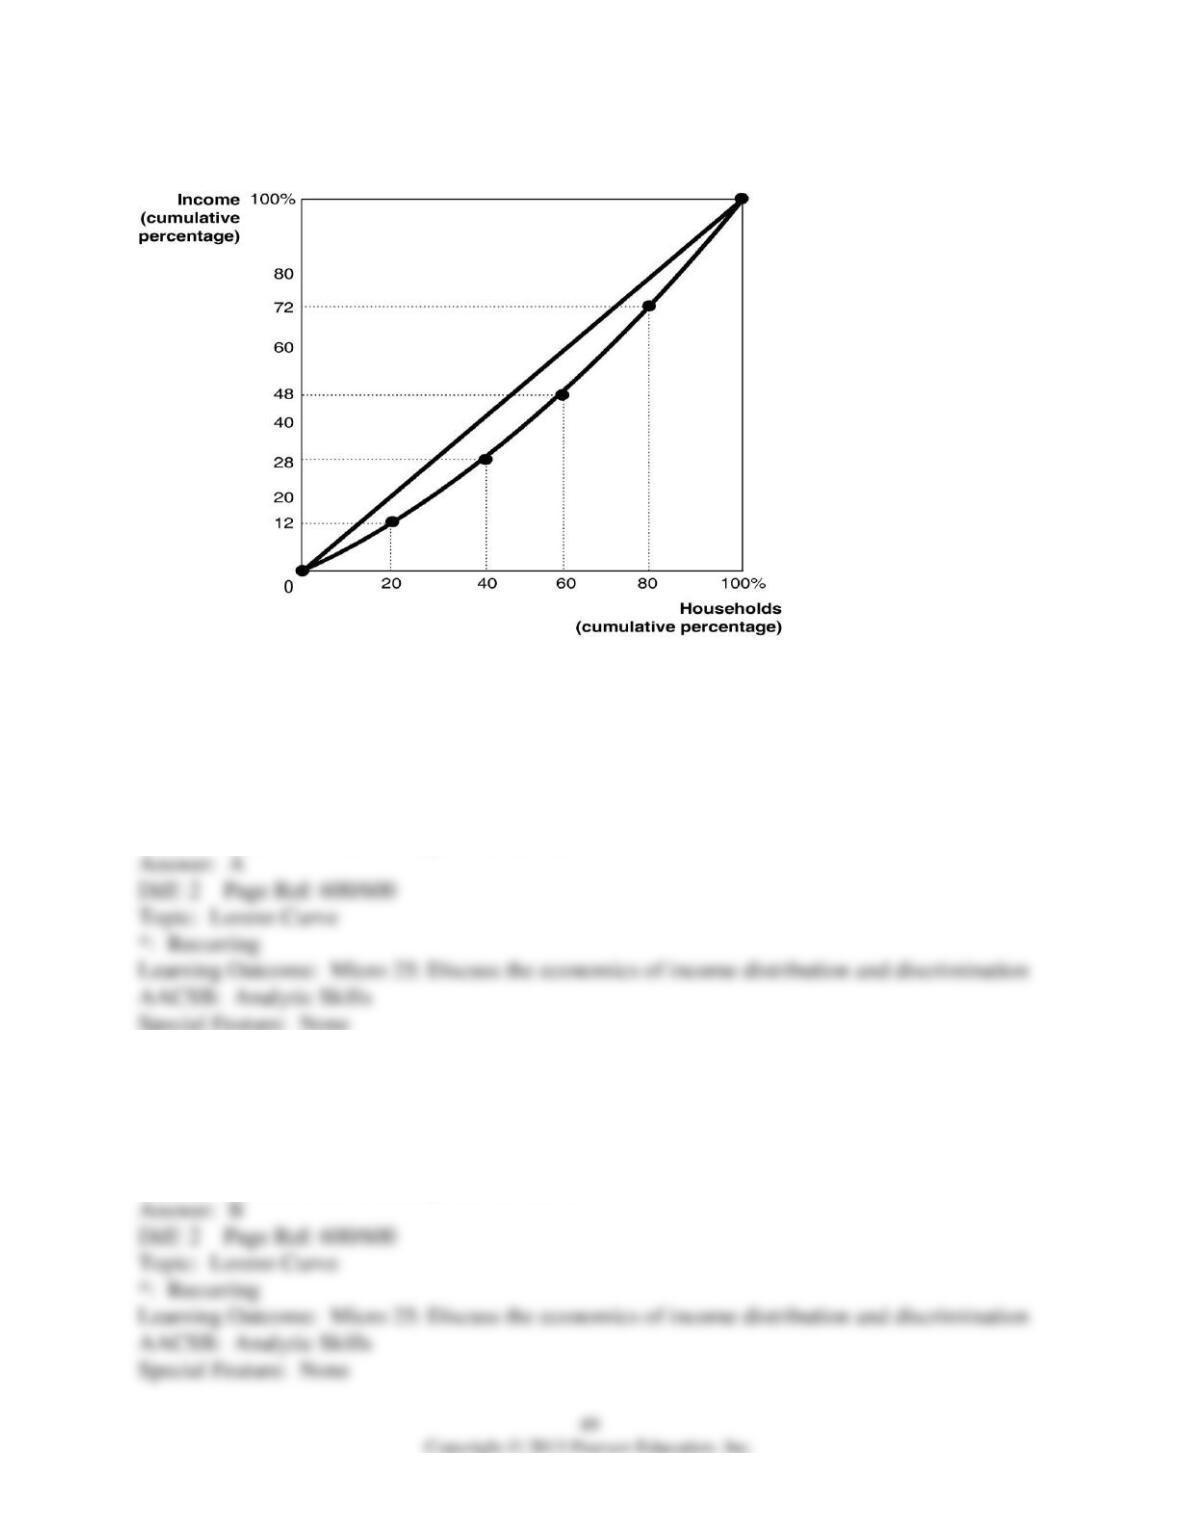
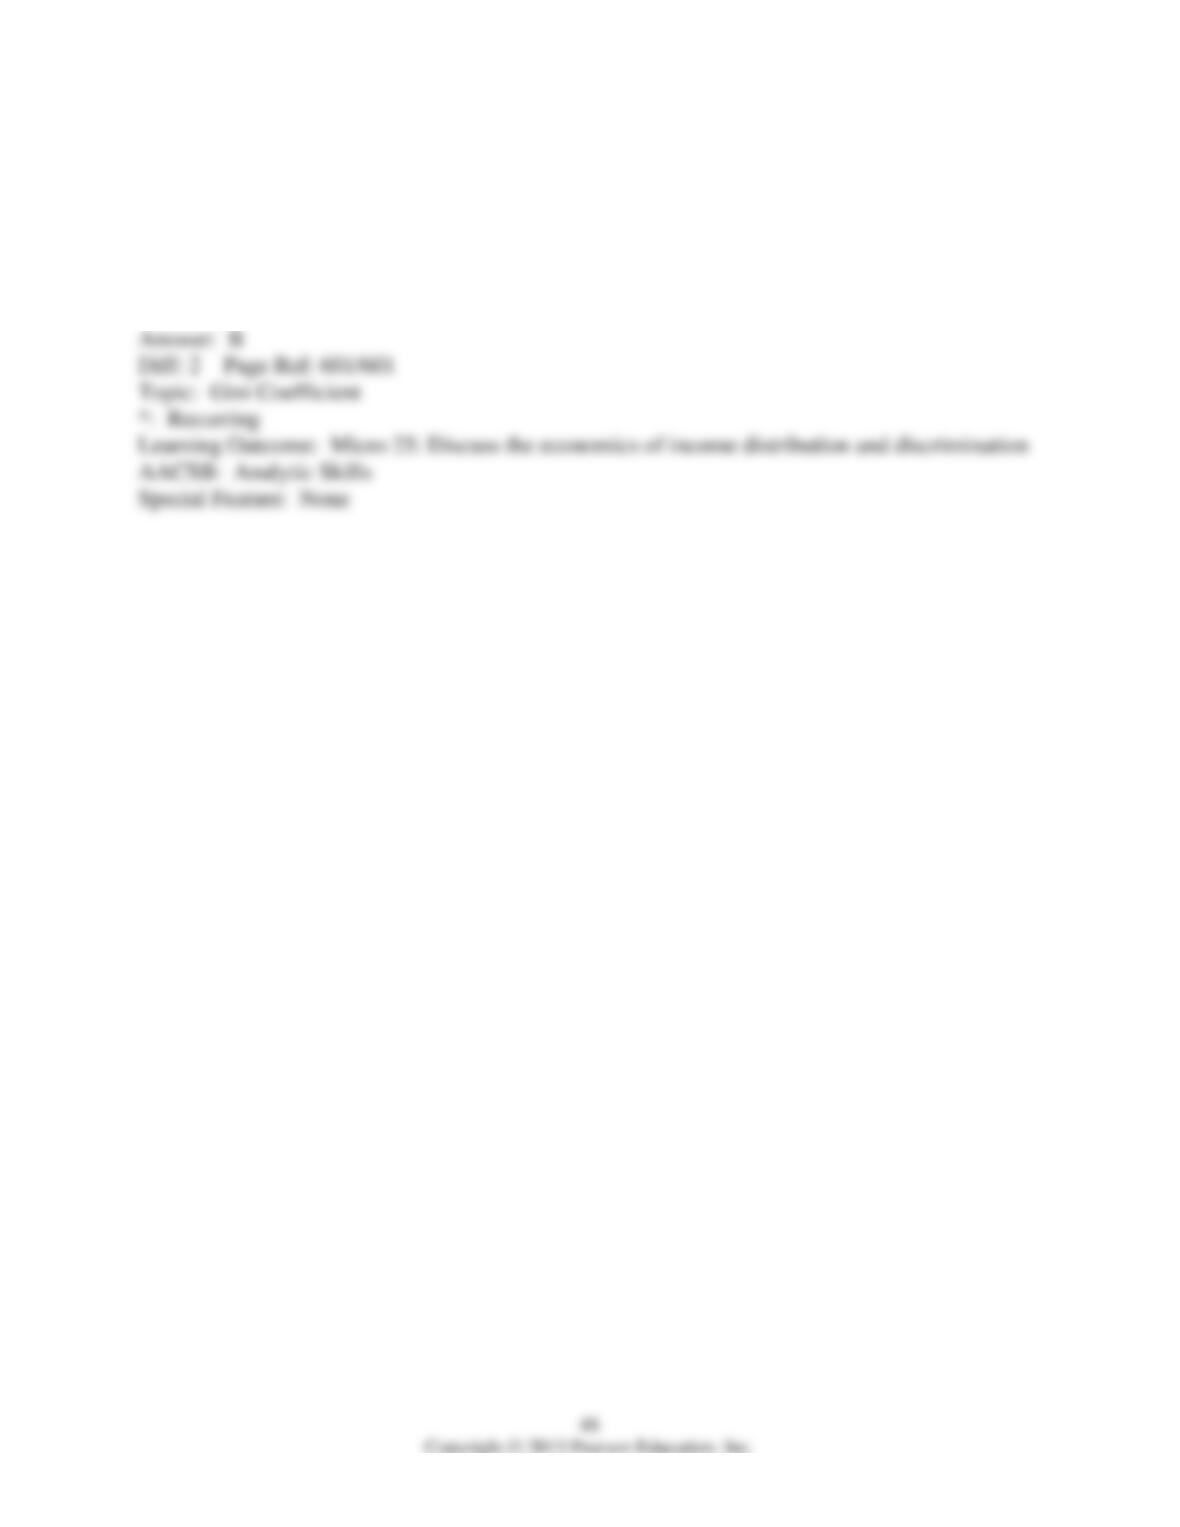
Figure 18-4
Figure 18-4 shows the Lorenz curve for a hypothetical country.
11) Refer to Figure 18-4. The middle 20 percent of households
A) earn 20 percent of the society’s total income.
B) earn 36 percent of the society’s total income.
C) earn 48 percent of the society’s total income.
D) earn 50 percent of the society’s total income.
12) Refer to Figure 18-4. The highest 20 percent of households
A) earn 24 percent of the society’s total income.
B) earn 28 percent of the society’s total income.
C) earn 42 percent of the society’s total income.
D) earn 72 percent of the society’s total income.
Figure 18-5
Figure 18-5 shows the Lorenz curves for Islandia and Syldavia.
13) Refer to Figure 18-5. Which country has the more unequal distribution of income?
A) Islandia
B) Syldavia
C) They may have the same absolute income distribution although their relative income
distribution is different.
D) There is insufficient information to answer the question.
14) Refer to Figure 18-5. If area X = 2,060, area Y = 240, and area Z = 2,700, calculate the Gini
coefficient for Islandia.
A) 0.41
B) 0.45
C) 0.70
D) 0.76
15) Refer to Figure 18-5. If area X = 2,060, area Y = 240, and area Z= 2,700, calculate the Gini
coefficient for Syldavia.
A) 0.05
B) 0.12
C) 0.46
D) 0.85
16) In the United States,
A) the income tax system has little or no impact on the distribution of income.
B) the after-tax income distribution of income is more equal than the before-tax distribution.
C) once a person is in poverty, it is very difficult for a person to get out of poverty.
D) the degree of income mobility is relatively low.
17) Which of the following tax systems would help reduce income inequality the most?
A) a regressive tax system
B) a proportional tax system
C) a progressive tax system
D) a consumption tax system

18) Absolute poverty measures vary from country to country. For example, in 2011, the poverty
line in the United States for a family of four with two children was an annual income of $22,350
but economists often use a much lower threshold income of $1 per day when calculating the rate
of poverty in poor countries. How is this absolute poverty measured?
A) by comparing the percentage of households living below the poverty line to the total
population
B) by comparing a household’s income to the income required to maintain the average standard
of living in a society at a particular time
C) by comparing the amount of goods and services that a household’s income can purchase to an
objective measure of the amount of income needed to sustain a certain predetermined standard of
living
D) by comparing the amount of goods and services that a household’s income can purchase in
one country to the amount of goods and services that a household’s income can purchase in
another country of comparable living standard
19) A study published by the Federal Reserve Bank of Chicago indicates that a tax on soda
would affect demographic groups in different ways, and the groups that would feel the greatest
impact of a soda tax are
A) middle-income families and people with no more than a bachelor’s degree.
B) the highest-income families and people with post-graduate degrees.
C) the lowest-income families and people with less education.
D) families with children under the age of 5 and people with at least a high school diploma.
20) A government-imposed tax on soft drinks would shift the ________ curve for soft drinks to
the ________, increasing the equilibrium price and decreasing the equilibrium quantity.
A) demand; right
B) demand; left
C) supply; right
D) supply; left
21) The Center for Science in the Public Interest claims that an 8-cent tax on a 12-ounce serving
of soda would raise ________ per year.
A) $385 million
B) $1.9 billion
C) $11 billion
D) $137.5 billion
22) If the Gini coefficient for Cartland is 1, it means that income distribution is perfectly equal in
this society.
23) Holding all other factors constant, income earned from capital is more unequally distributed
than income earned from labor.
24) Rapid economic growth tends to increase the degree of income mobility.
25) Describe the main factors economists believe cause inequality of income.
26) Compare the distribution of income in the United States with the distribution of income in
other high-income countries.
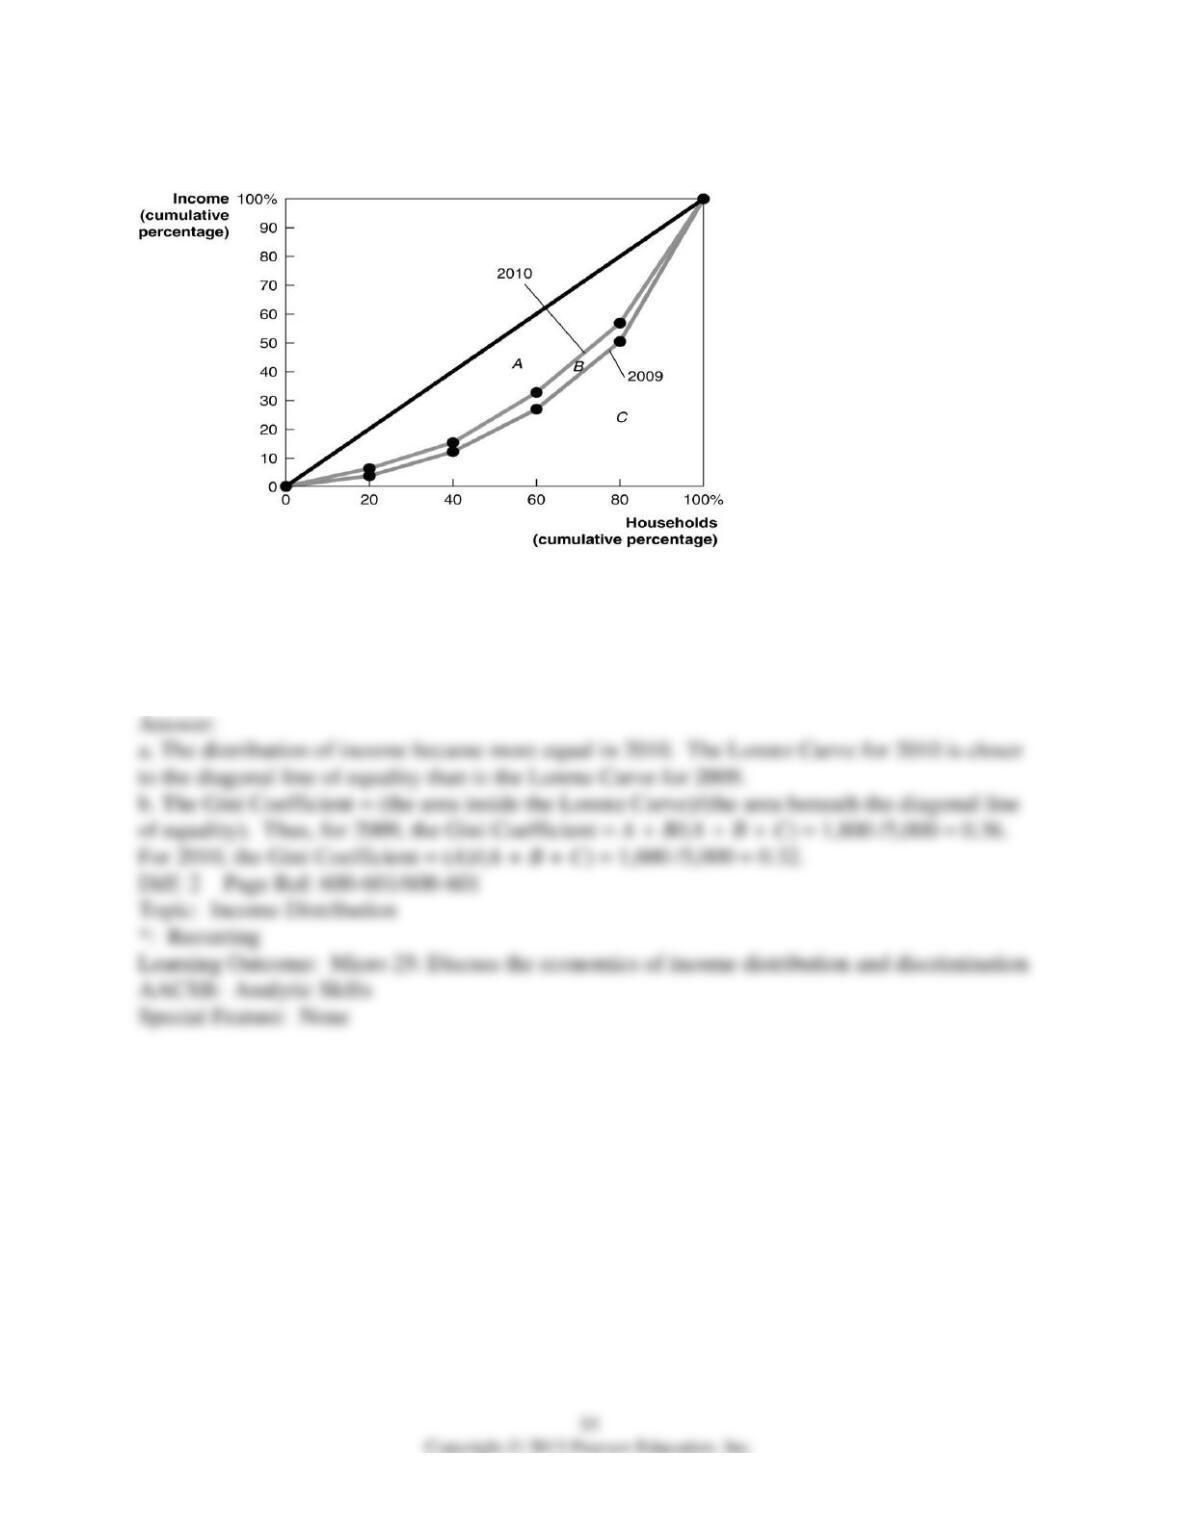
Figure 18-6
27) Refer to Figure 18-6 to answer the following questions.
a. Did the distribution of income become more equal in 2010 that it was in 2009, or did it
become less equal? Explain.
b. If area A = 1,600, area B = 200, and area C = 3,200, calculate the Gini coefficient for 2009 and
the Gini coefficient for 2010.
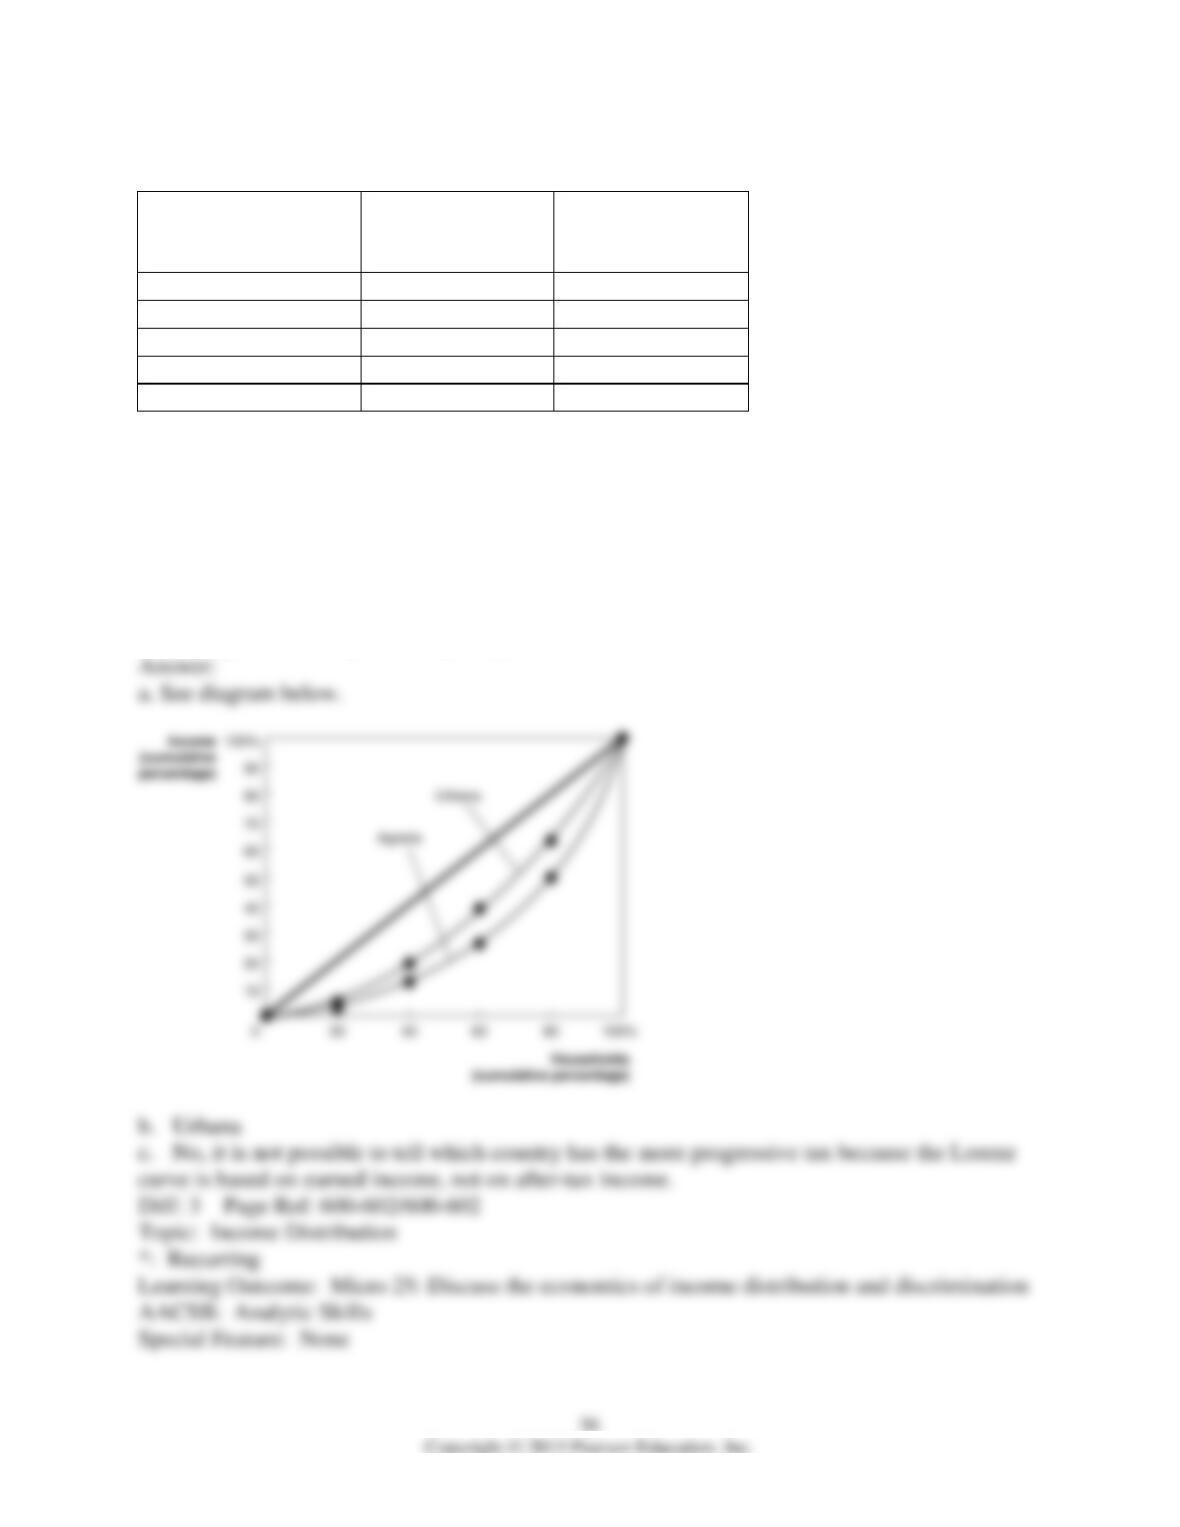
Table 18-6
Income Quintile
Agraria
Percentage of
Total Income
Urbana
Percentage of Total
Income
Lowest 20%
3%
5%
Second quintile
9%
14%
Third quintile
14%
20%
Fourth quintile
24%
24%
Highest 20%
50%
37%
Table 18-6 shows income distribution data for two countries. Use this data to answer the
following questions.
28) Refer to Table 18-8.
a. Draw a Lorenz curve for each country.
b. Which country has the more equal distribution of income?
c. Based on the Lorenz curve for the two countries, can you determine which country has the
more progressive tax system? Explain your answer.