1
Environment: Science Behind the Stories, 2e Cdn. Ed. (Withgott)
Chapter 18 Managing Our Waste
18.1 Graph and Figure Interpretation Questions
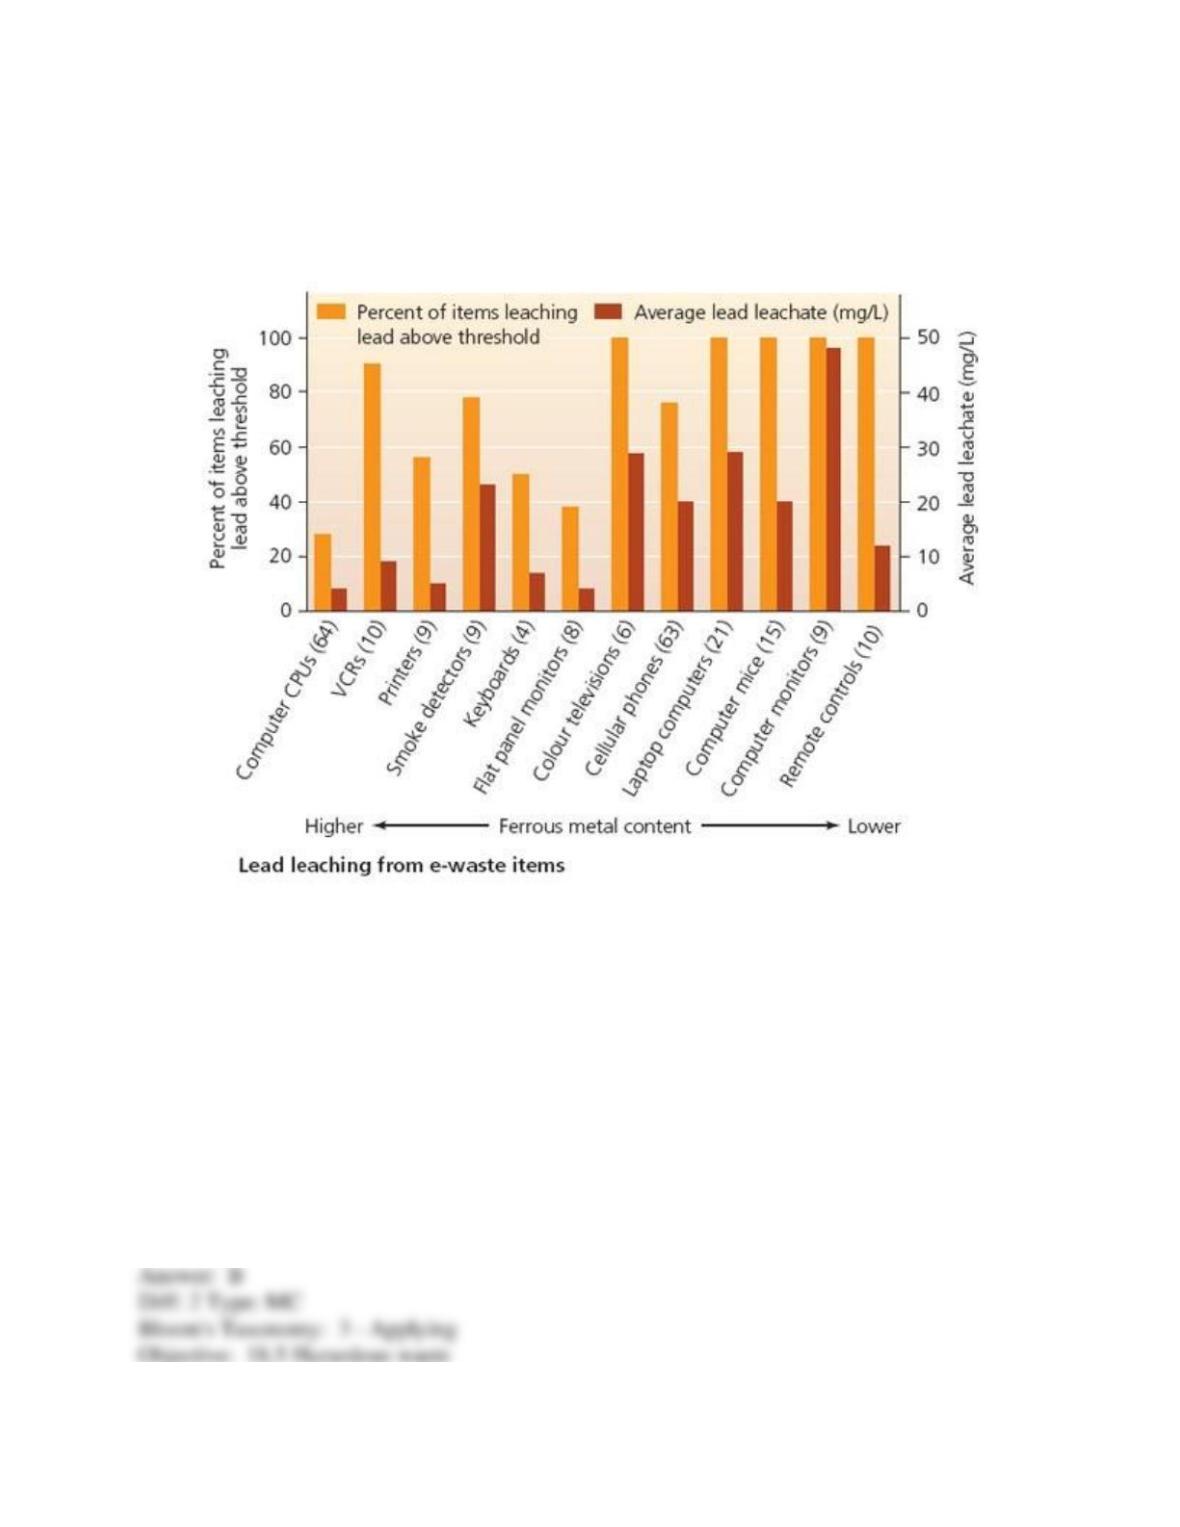
Figure 18.1 Discarded electronic waste can leach heavy metals including lead. The light-
coloured bar shows the percentage of electronic devices leaching. The U.S. EPA’s regulatory
threshold for lead leachate is 5 mg/L. The graph shows the percentage of devices that exceed the
threshold, as well as the average concentration of lead leachate from each waste category.
Use Figure 18.1 to answer the following questions.
1) Refer to Figure 18.1. You want to reduce lead pollution from a landfill. The recycling of
which computer equipment should be your priority?
A) computer mice
B) computer monitors
C) laptops
D) computer CPUs
E) VCRs
2) Refer to Figure 18.1. Lead pollution is less of a problem in the case of ________.
A) electronic devices containing a lower content of iron
B) electronic devices containing a higher content of iron
C) discarded monitors
D) discarded colour televisions
E) discarded smoke detectors
3) Refer to Figure 18.1. On average, ________ leach about ________ times more lead than
________.
A) computer mice; 3 times; remote controls
B) computer monitors; 10 times; flat panel monitors
C) printers; 2 times; computer CPUs
D) colour televisions; 2.5 times; flat panel monitors
E) remote controls; 20%; smoke detectors
4) Refer to Figure 18.1. Which computer equipment has the highest lead content?
A) computer CPUs
B) computer monitors
C) printers
D) keyboard
E) laptop
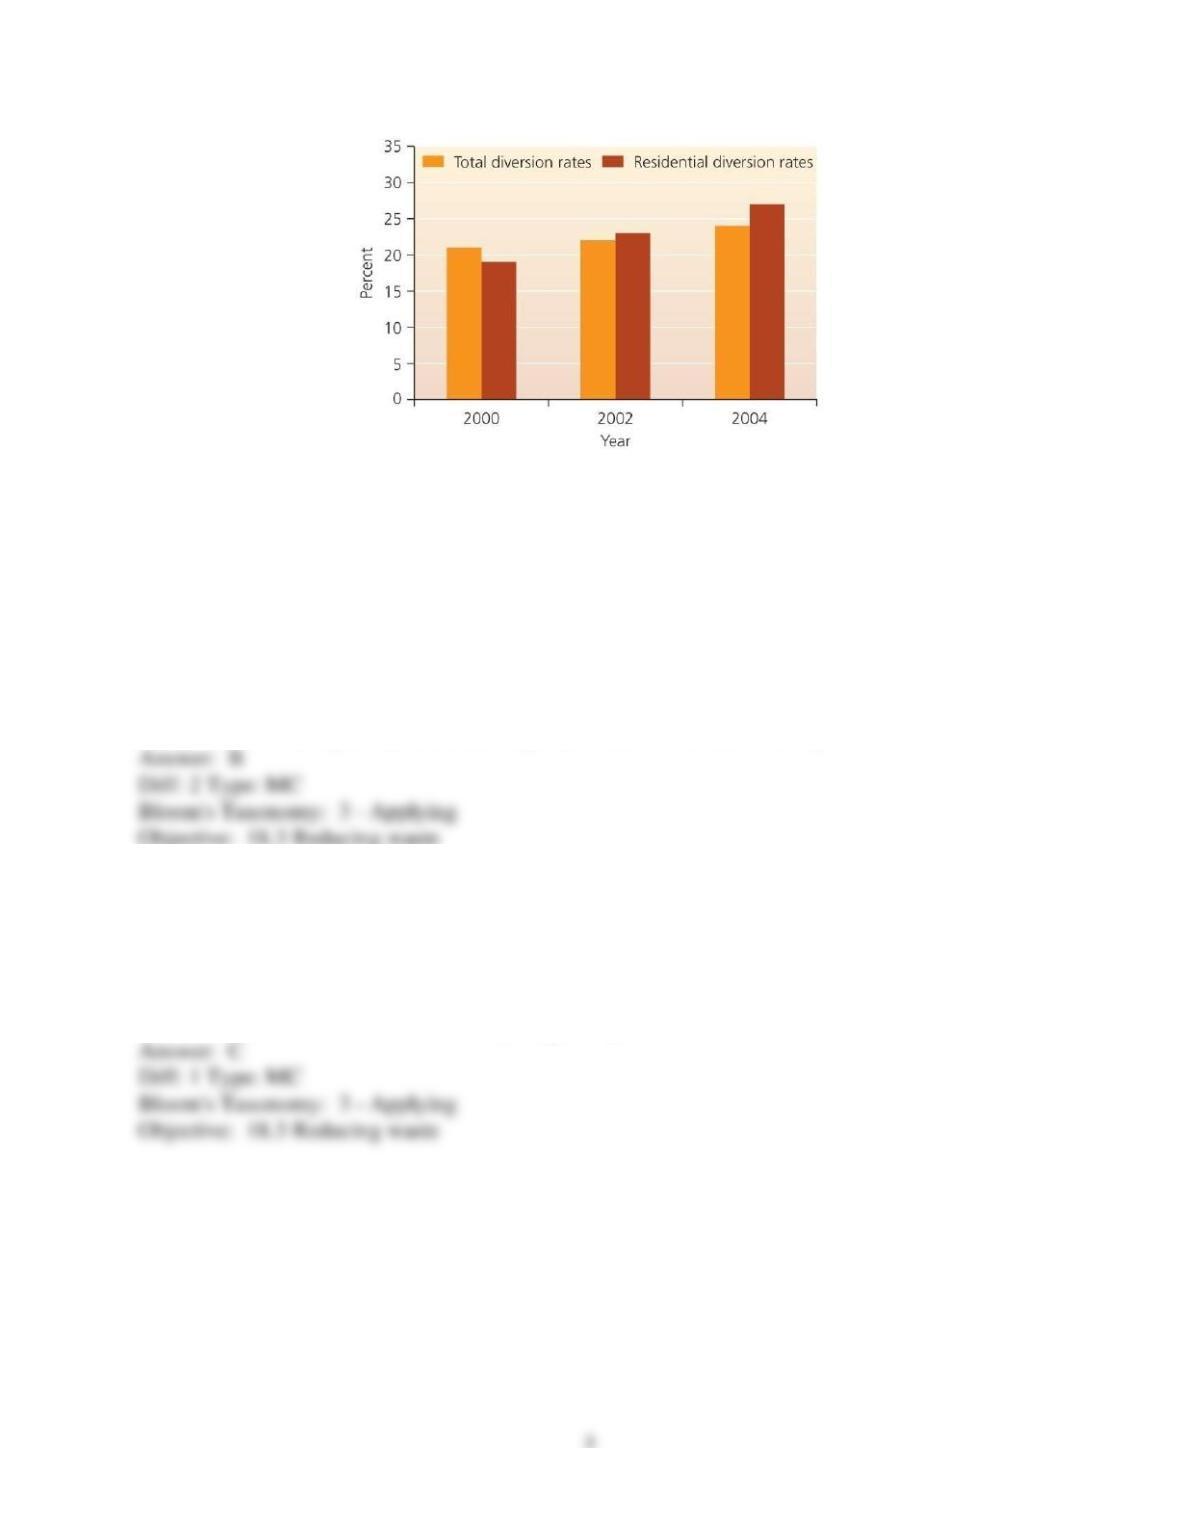
Figure 18.2
Use Figure 18.2 to answer the following questions.
5) Refer to Figure 18.2. From 2000 to 2004, the trend has been that ________ over time.
A) less waste was sent to landfills
B) more overall recycling occurred
C) less waste was recovered for recycling
D) less overall waste was produced
E) there have been equal ratios of land disposal, combustion, and recovery
6) Refer to Figure 18.2. Which year demonstrated the greatest volume of recycling?
A) 2000
B) 2002
C) 2004
D) The volume was the same in all years.
E) There was no trend toward more recycling at any time.
7) Refer to Figure 18.2. In which year was residential recycling (diversion) highest?
A) 2000
B) 2002
C) 2004
D) It was the same in all years.
E) There was no trend toward residential recycling at any time.
18.2 Matching Questions
Match the following.
A) yard debris
B) organics
C) paper
D) glass
E) metals
F) food scraps
G) syringes, hospital gowns, and diapers
H) plastic
1) The largest component of Canadian municipal solid waste
2) The second–largest component of Canadian municipal solid waste
3) Often the primary contributor to solid waste in developing nations
4) Waste that has taken up a substantially greater share of the waste stream since 1960
5) Waste component from the Islip, New York, barge that was rejected by North Carolina,
Louisiana, and Mexico in 1987, so it was returned to New York
6) This waste can be removed from soil or water via phytoremediation
Diff: 2 Type: MA
Bloom’s Taxonomy: 2 – Understanding
Objective: 18.5 Hazardous waste
18.3 Short Answer Questions
1) Are disposable diapers a significant contributor to the volume of trash in landfills? Are there
any other concerns associated with the landfilled diapers?
2) Briefly describe the technologies that have been developed to mitigate or eliminate incinerator
emissions.
3) Briefly describe the different categories of waste.
4) Why has waste management become an important pursuit for cities, industries, and
individuals?
5) What is WTE?
6) Describe the advantages of composting.
7) ________% of Canada’s kitchen or yard waste is composted.
8) Hazardous waste is characterized as having one or more of these four properties: ________.
9) What is a “waste exchange”?
10) All provinces allow consumers to return ________ to specialized recycling centres after use
and receive a refund. However, most recycling centres are in larger municipalities.
11) The Beare Road landfill is now a source of LFGTE, which means it produces ________ for
electricity.
18.4 Multiple‐Choice Questions
1) In developed countries, which of the following generates the largest amount of hazardous
waste, and which is the largest unregulated source of the hazardous waste?
A) industry; households
B) households; industry
C) industry; agriculture
D) industry in both cases
E) households in both cases
2) ________ has/have the smallest amount of per capita solid waste production.
A) Canada
B) The Netherlands
C) The United States
D) Germany and Sweden
E) France
3) To prevent landfill toxins from seeping into groundwater, sanitary landfills are ________.
A) located on slopes for water to run downhill, so the leachate never enters the groundwater
B) lined with plastic and clay
C) lined with cement
D) located in unpopulated areas
E) located on industrial sites where groundwater is not used for drinking or agriculture
4) The best solution to the solid waste problem is to ________.
A) increase the number of WTE facilities
B) increase the number of sanitary landfills
C) reduce the amount of material that enters the waste stream
D) subsidize WTE facilities
E) increase the number of marine burial sites
5) The first can and bottle recycling laws were ________.
A) designed to provide glass for road construction
B) initiated in the 1990s
C) designed to cut down on litter
D) designed to provide a relatively inexpensive source of raw resources for industry
E) in response to the public demand to protect the environment
6) The Beare Road Landfill ________.
A) is an environmental disaster that pollutes Lake Ontario
B) will remain open until late 2020
C) is a site that was converted to a public park and it generates methane for electricity
D) was abandoned in the late 1970s
E) is Toronto’s main landfill site
7) In Canada, waste disposal is regulated by ________ level(s) of government.
A) 2
B) 1
C) 3
D) 4
E) There is no regulation.
8) The earthworms, fungi, and bacteria in your compost pile will NOT be happy if you give them
________.
A) food scraps
B) grass clippings
C) paper
D) autumn leaves
E) plastic
9) In 2008 , Canadian households generated about ________ million tonnes of trash.
A) 11
B) 17
C) 22
D) 27
E) 32
10) In 2008, the ratio of the nonresidential to the residential waste produced in Canada was about
________.
A) 1:3
B) 3:1
C) 1:1
D) 2:3
E) 3:2
11) Until the mid–nineteenth century, New York City’s official method of garbage disposal was
________.
A) composting on New Jersey farms
B) burying waste under the present site of the Statue of Liberty
C) dumping waste at Fresh Kills Landfill
D) dumping waste off piers into the East River
E) burying waste in remote locations in Canada
12) If Canadians recycled all recyclables and composted all compostibles, the volume of
municipal solid waste would drop by about ________%.
A) 45
B) 55
C) 65
D) 75
E) 85
13) In Canada, the two largest components of household waste were ________ and ________.
A) paper, combined: metals and plastics
B) paper; organics
C) organics, combined; metals and plastics
D) organics, combined; wood and glass
E) paper, combined; wood and glass
14) Each Canadian produces approximately ________ of waste per year .
A) 1000 kilograms
B) 50 tonnes
C) 10 tonnes
D) 500 kilograms
E) 100 kilograms
11
15) In Edmonton, Alberta, glass is ________.
A) dumped at landfills
B) incinerated
C) melted down to make lightbulbs
D) recycled into reflective paint and signs
E) composted
16) Rank the following countries according to their wastefulness, with the most “throwaway
society” first.
A) United States, Canada, The Netherlands
B) Canada, United States, Germany
C) United States, Germany, Sweden
D) United States, The Netherlands, Germany
E) Canada, Germany, Sweden
17) Industrial ecologists ________.
A) favour an economy that moves linearly rather than circularly
B) advocate taxes on green industries
C) seek to redesign industrial systems to minimize physical inefficiency while maximizing
economic efficiency
D) urge an emphasis on internal manufacturing costs rather than external costs
E) primarily analyze industrial inputs
18) Life–cycle analysis ________.
A) is an environmental movement designed to reduce municipal traffic and encourage alternative
forms of transport
B) defines how different organisms interact within ecosystems during their lives
C) examines the cycling of carbon in the environment
D) is the study of cyclical changes in the human population
E) examines the life cycle of products for ecological efficiency
19) Which of the following represent criteria for classifying hazardous waste?
A) inorganic and organic
B) corrosive, ignitable, reactive, and toxic
C) nonbiodegradable and biodegradable
D) municipal, industrial, and agricultural
E) solid, liquid, and gaseous
20) Heavy metals ________.
A) become less hazardous after incineration
B) become less hazardous over time as they degrade chemically
C) are unregulated by the U.S. government
D) bioaccumulate in animal tissues
E) are not harmful unless they are directly ingested
21) ________ represent(s) the largest source of unregulated hazardous waste.
A) Small businesses
B) Households
C) Farmers
D) Utilities
E) Large industry
22) Which of the following are classified as heavy metals?
A) lead, mercury, cadmium
B) nitrogen, phosphorus, potassium
C) carbon, hydrogen, oxygen
D) aluminum, iron, silicon
E) any nonbiodegradable metals