91.
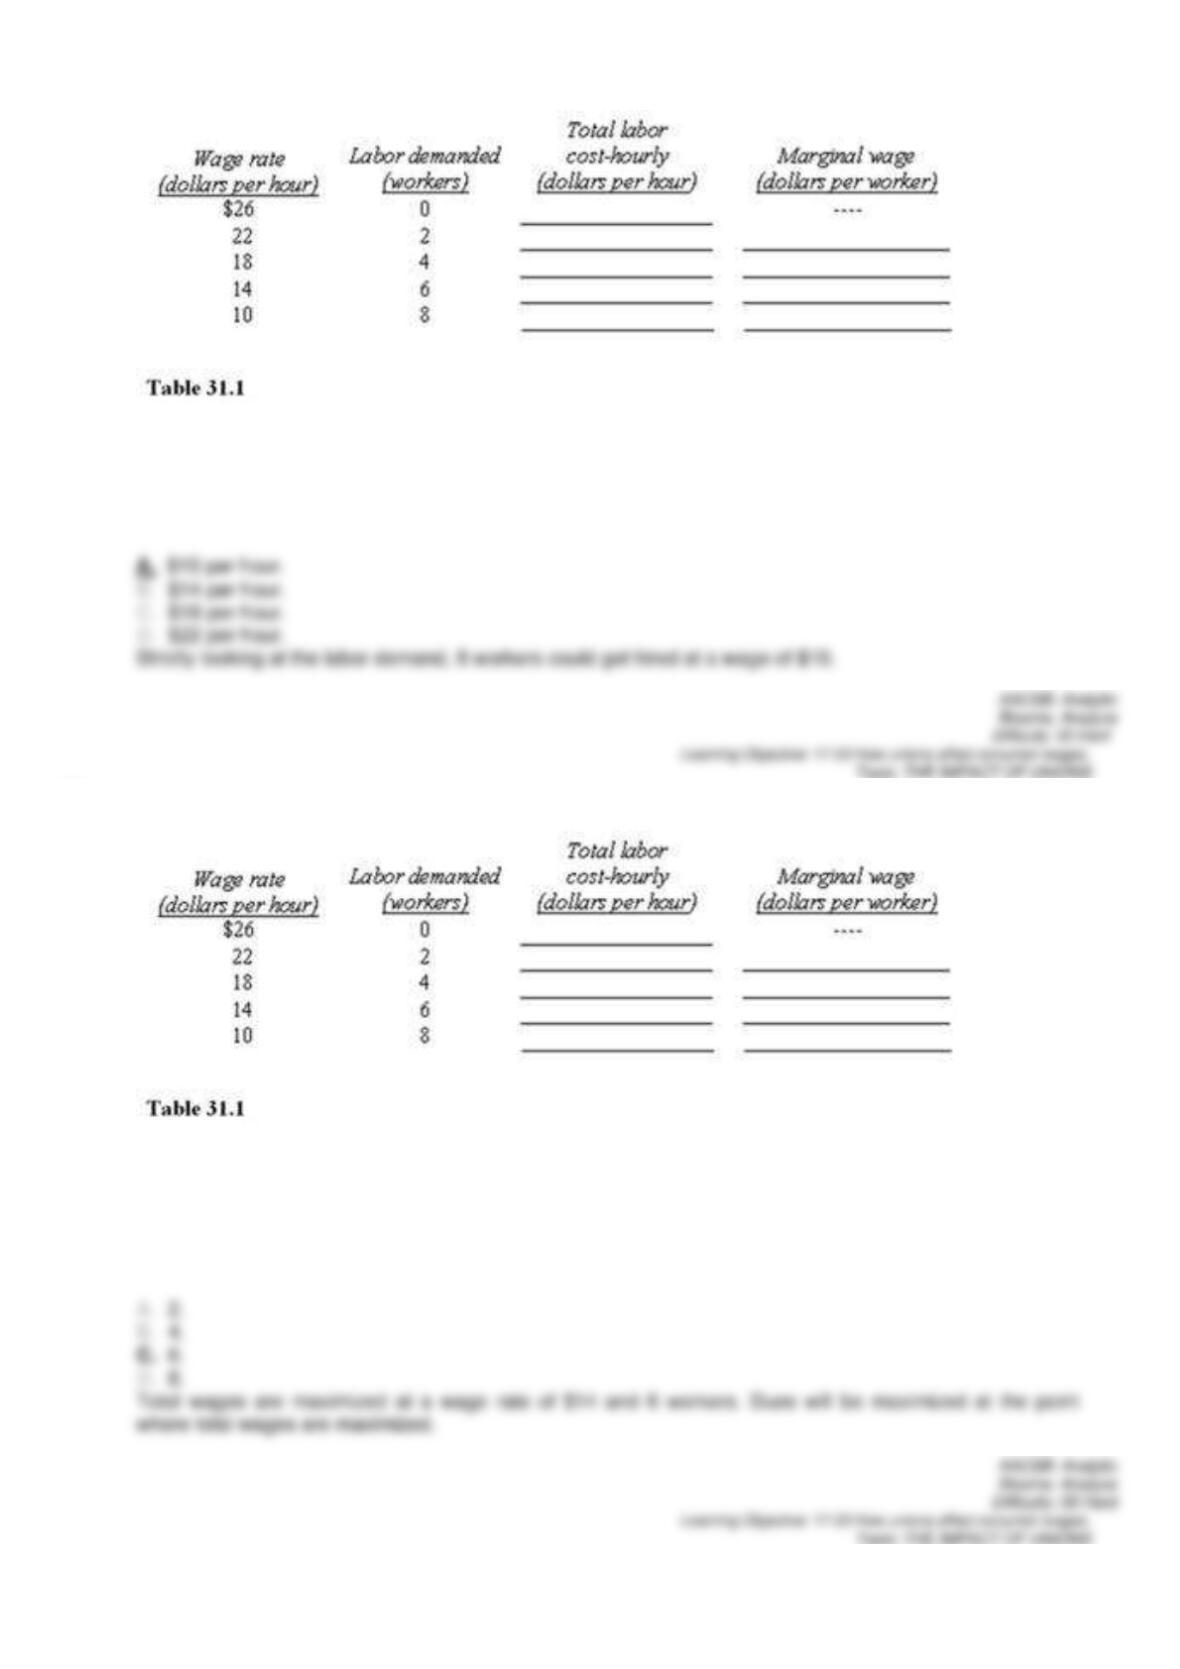
Table 31.1 shows the number of workers a firm is willing to hire per hour at different wage rates. Complete the
table by computing the total wage bill (total labor cost) and the marginal wage. Which of the following wages,
in Table 31.1, would allow the most workers to be hired?
92.
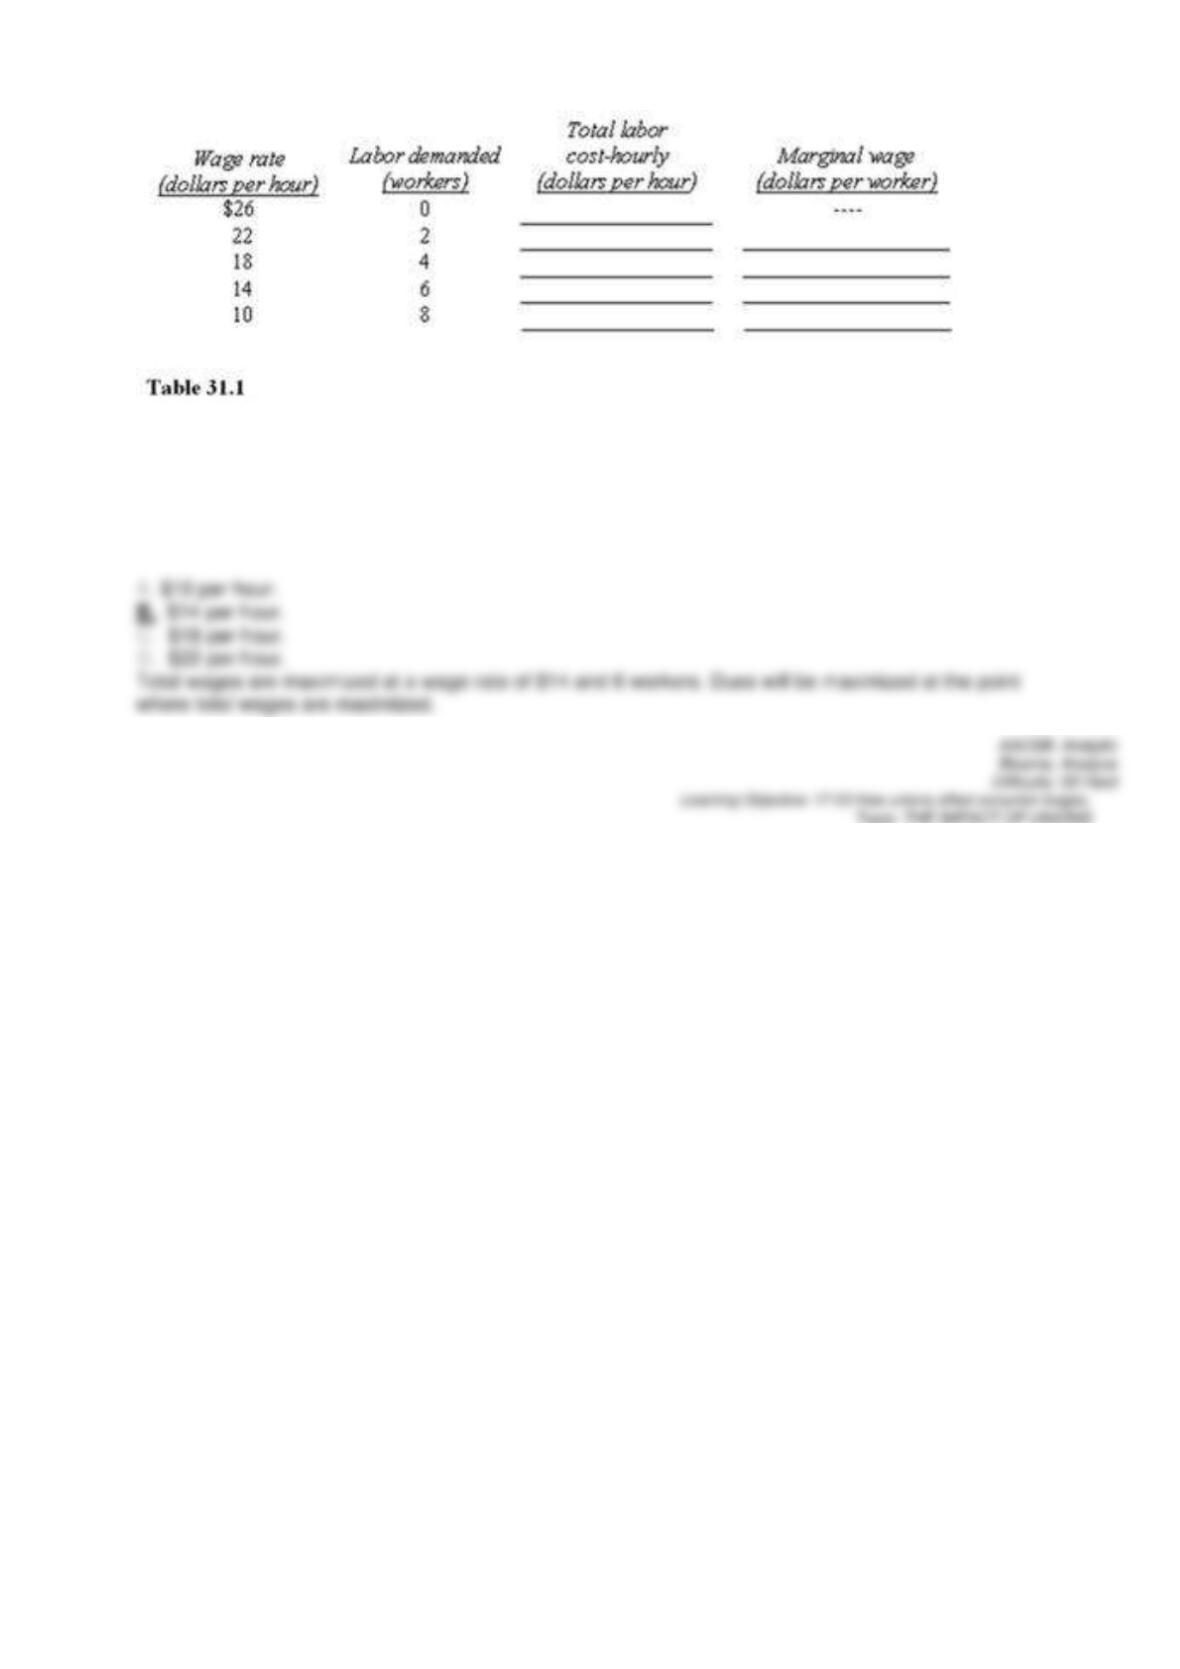
Table 31.1 shows the number of workers a firm is willing to hire per hour at different wage rates. Complete the
table by computing the total wage bill (total labor cost) and the marginal wage. Assume the union collects dues
of 1 percent of the total wage bill. How many workers would the union want hired in Table 31.1 if its goal was to
maximize the amount of dues collected?
93.
Table 31.1 shows the number of workers a firm is willing to hire per hour at different wage rates. Complete the
table by computing the total wage bill (total labor cost) and the marginal wage. Assume the union collects dues
of 1 percent of the total wage bill. At what wage in Table 31.1 would the union maximize the amount of dues it
collects?
94.
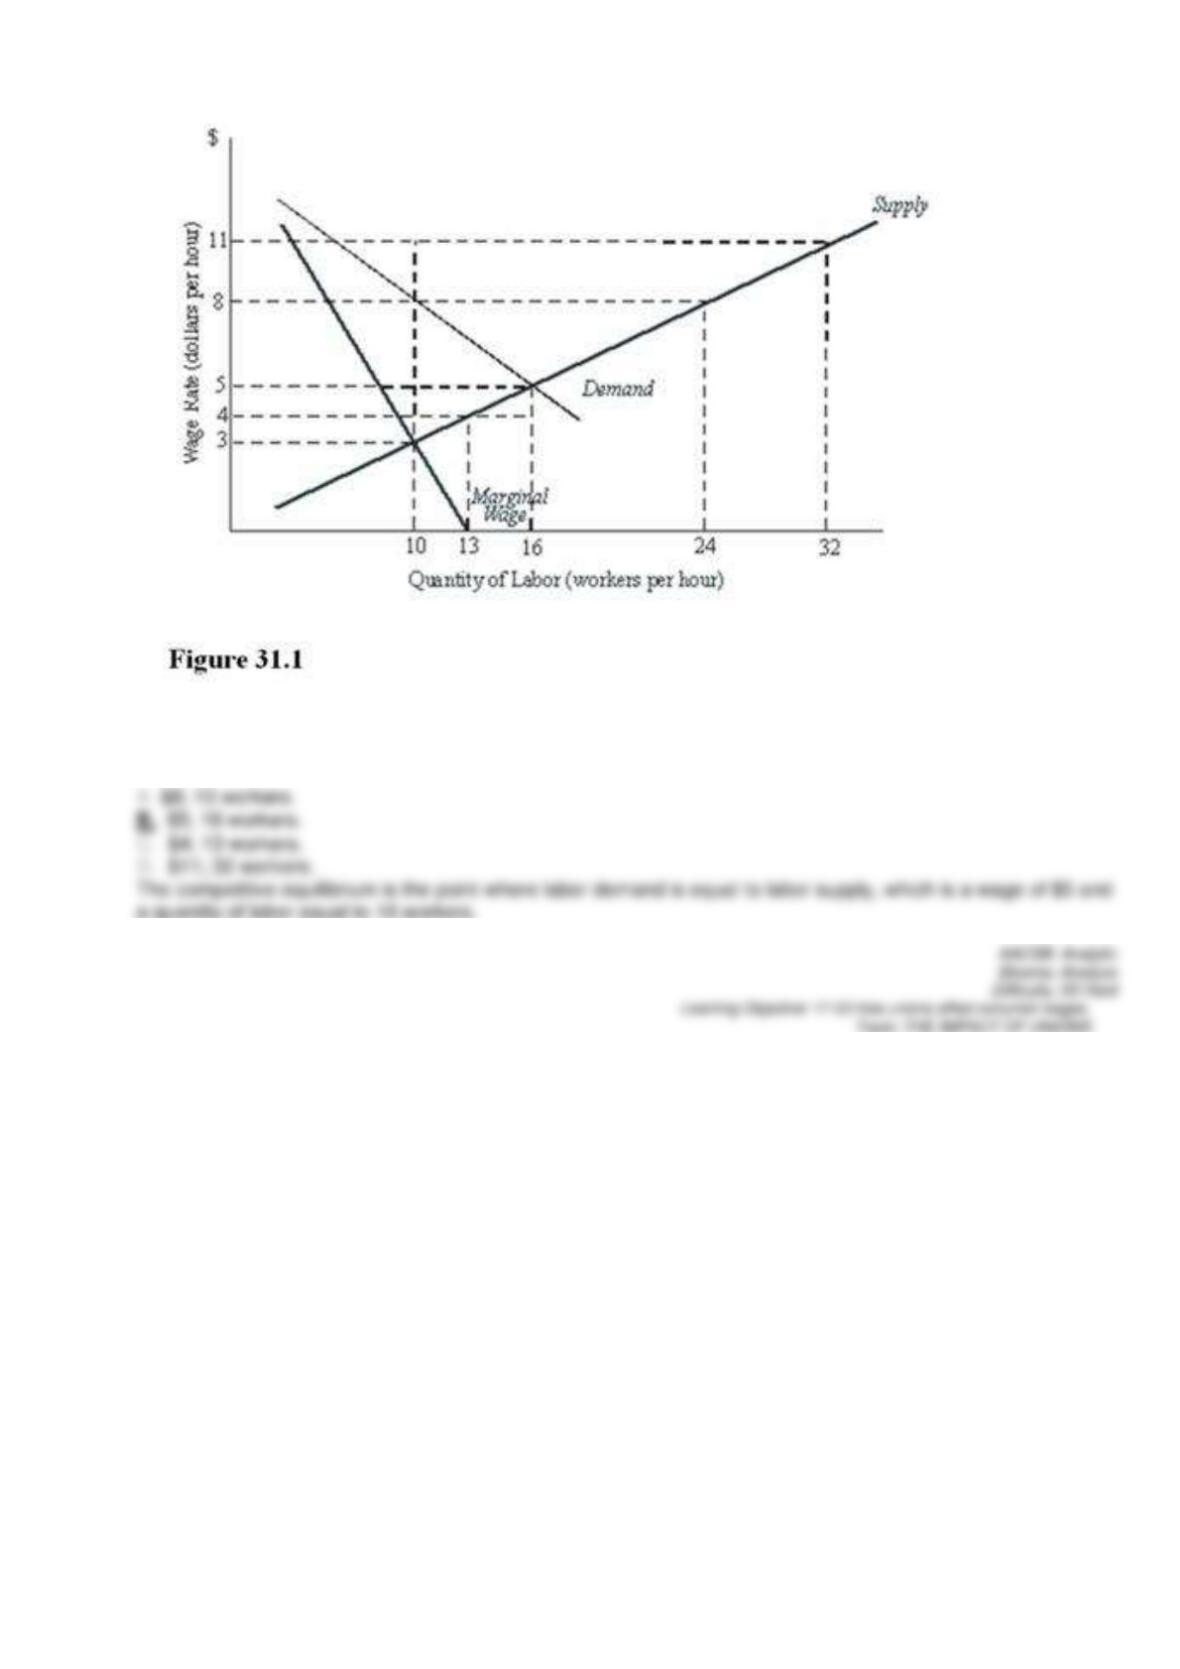
What are the competitive equilibrium wage and employment level in Figure 31.1?
95.
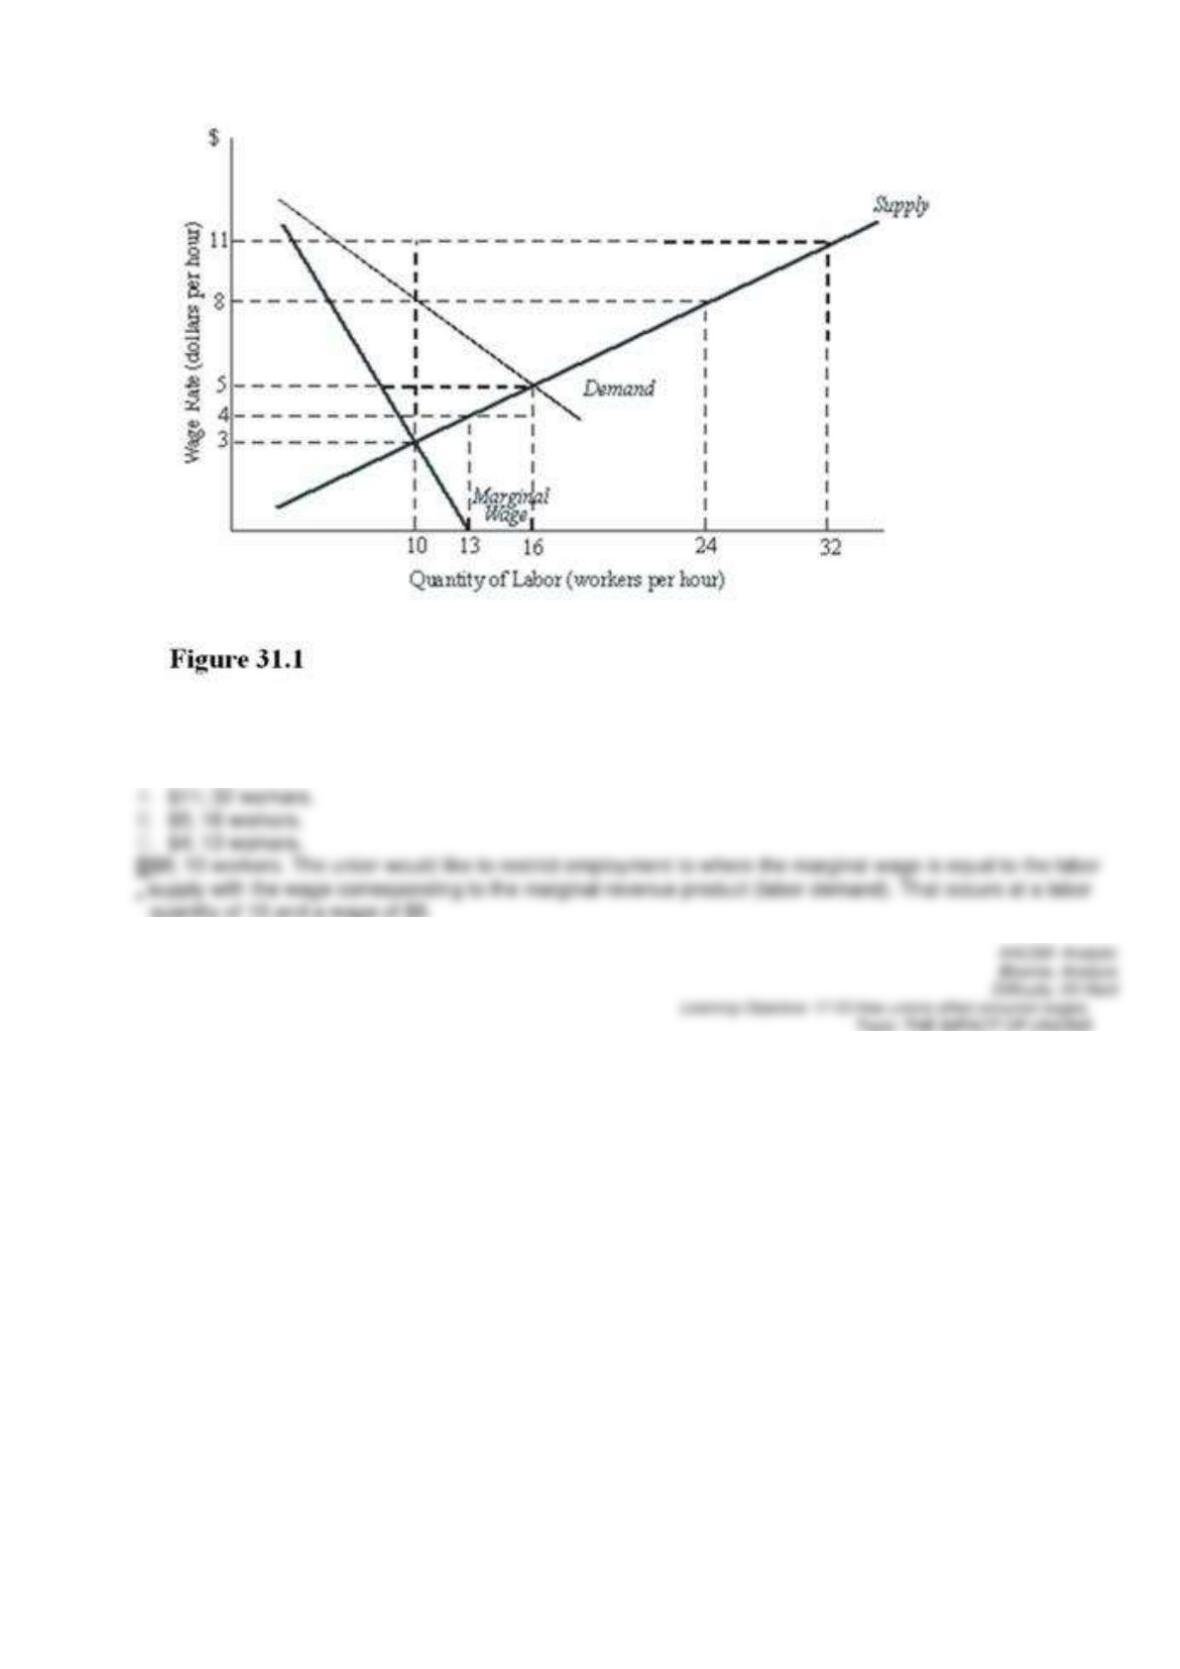
What are the optimal wage and employment level from the perspective of a union in Figure 31.1?
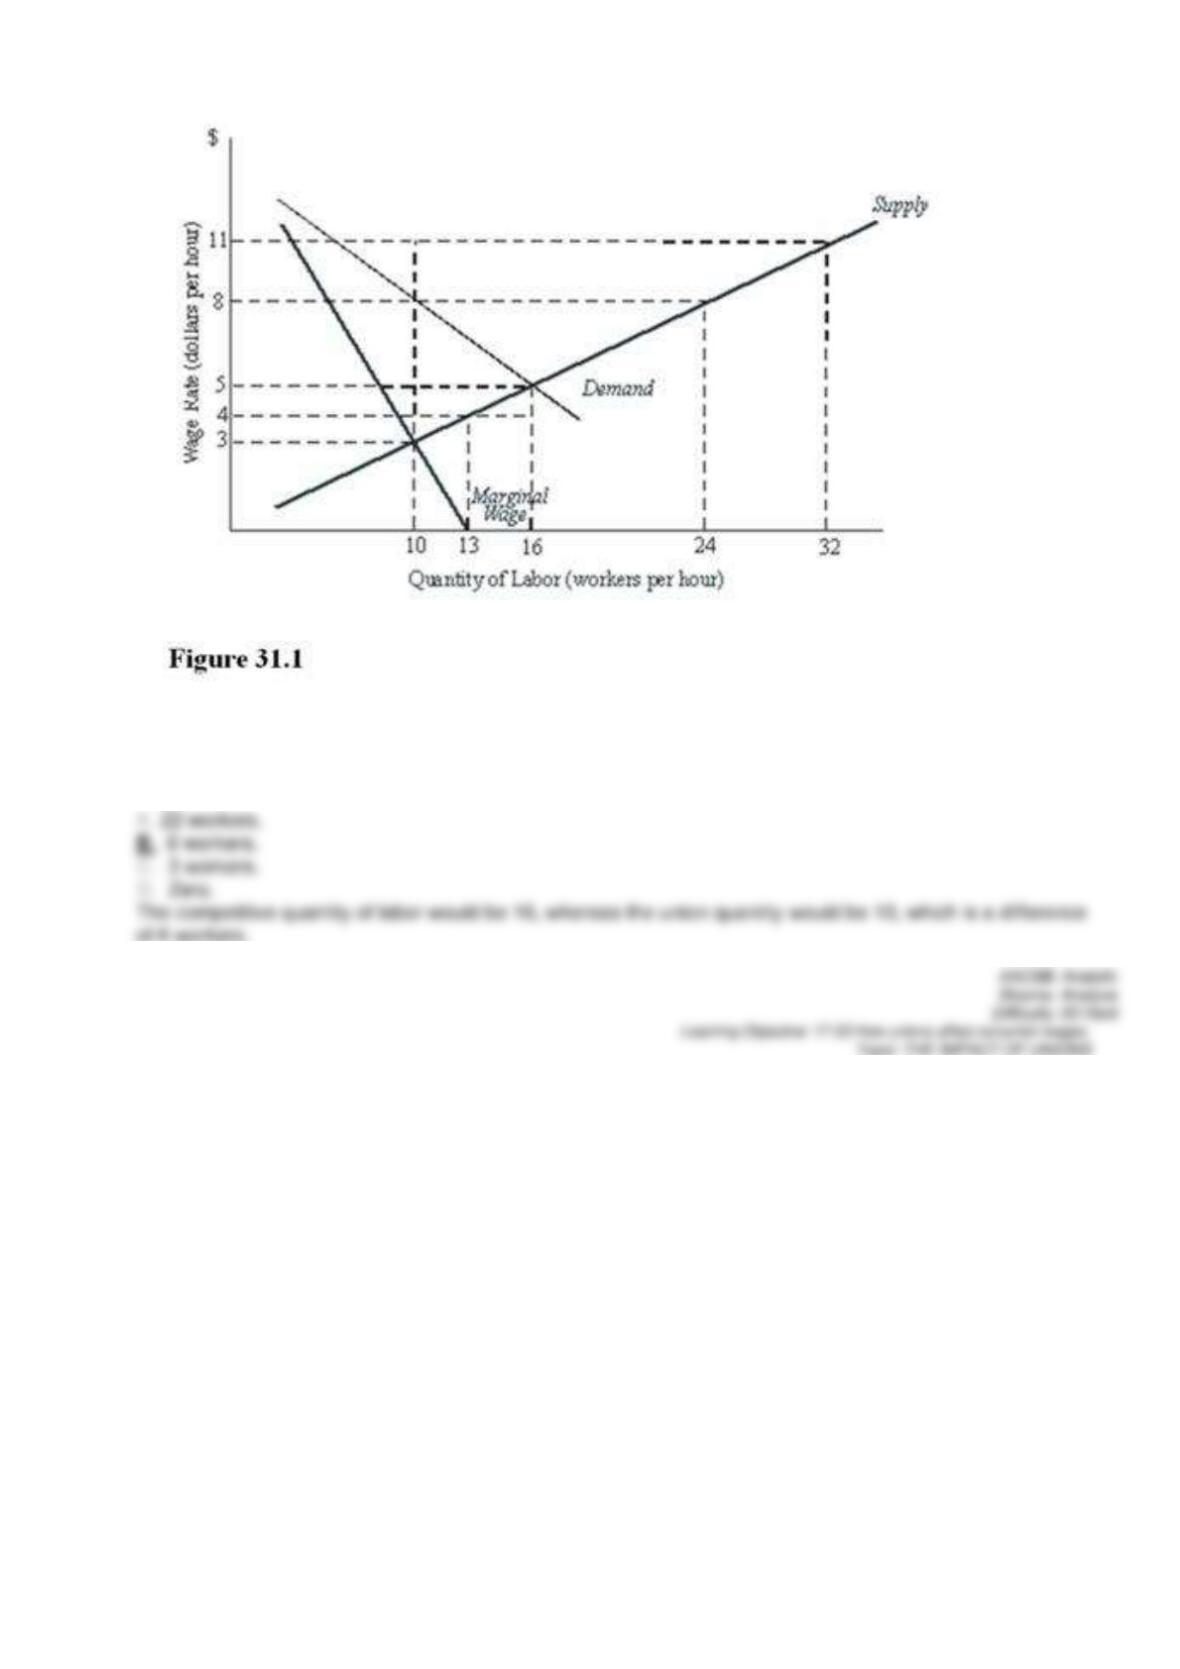
96.
What is the difference between the competitive level of employment and the union optimum level
of employment in Figure 31.1?
97.
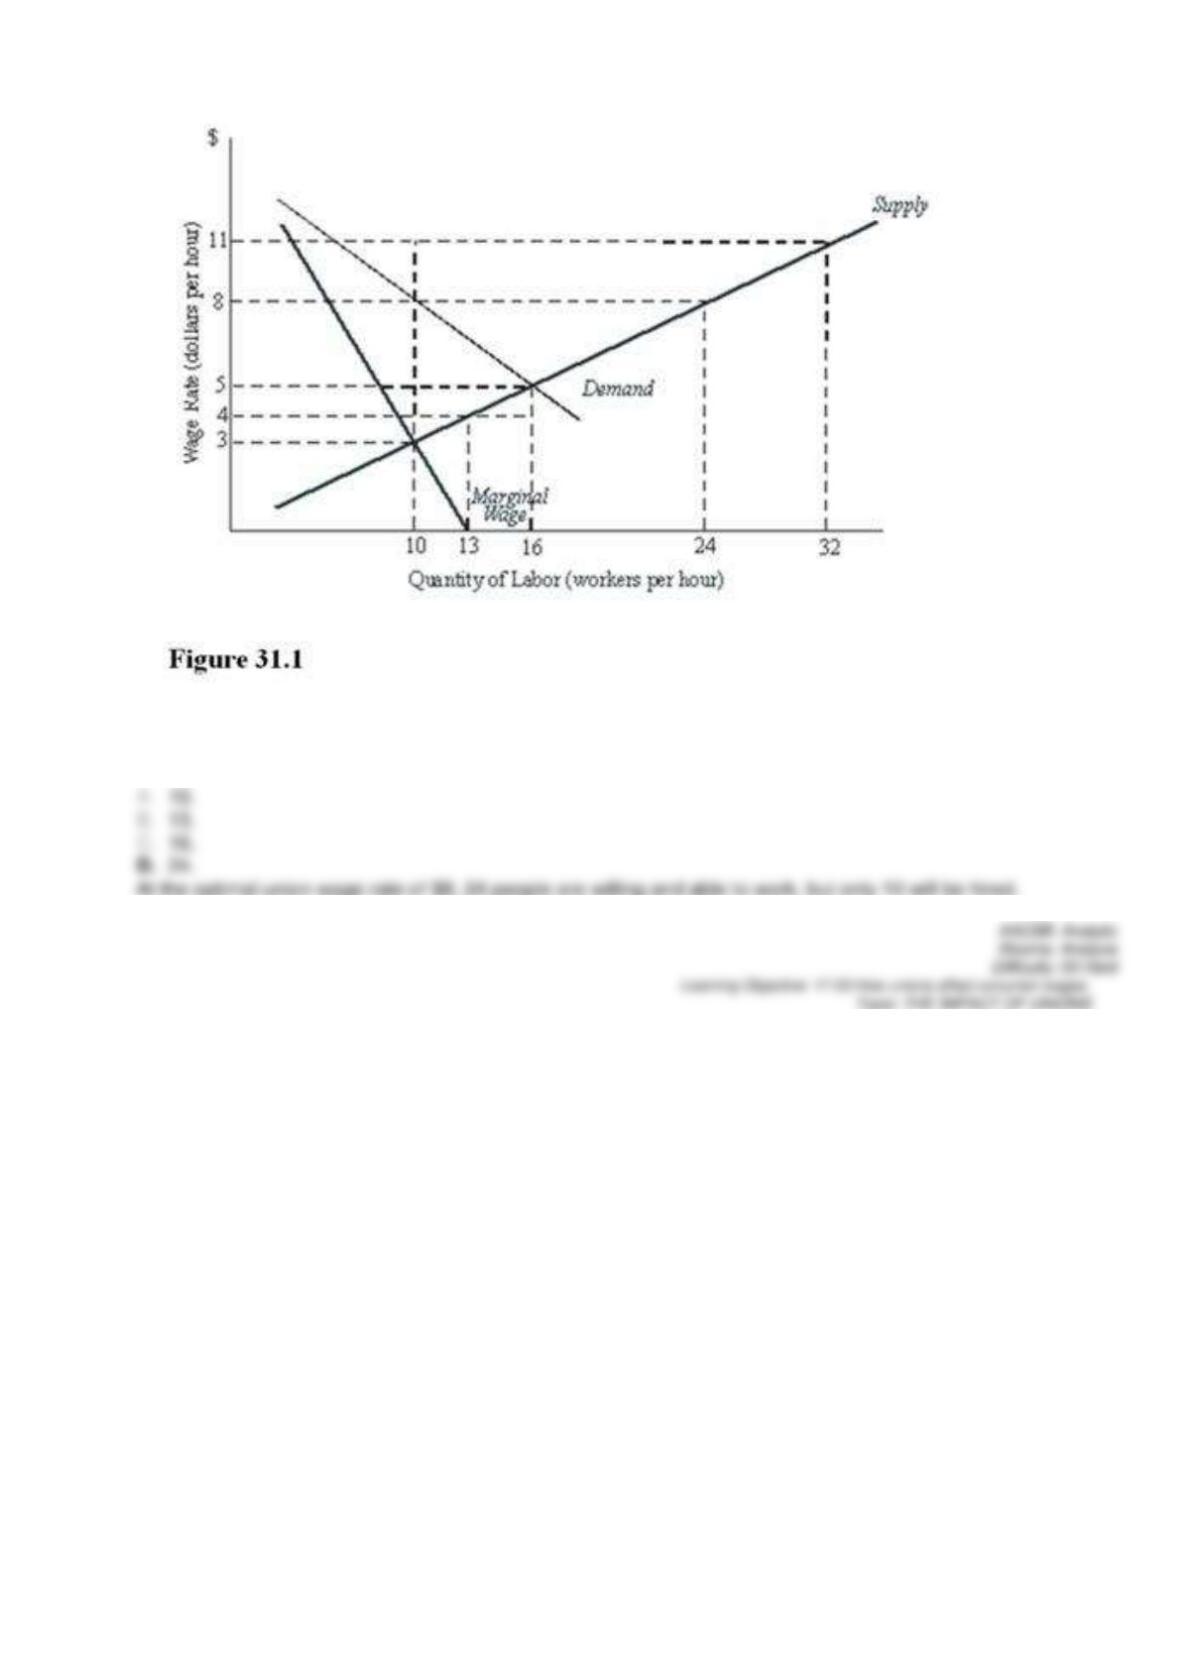
How many workers are willing and able to work at the optimal union wage rate in Figure 31.1?
98.
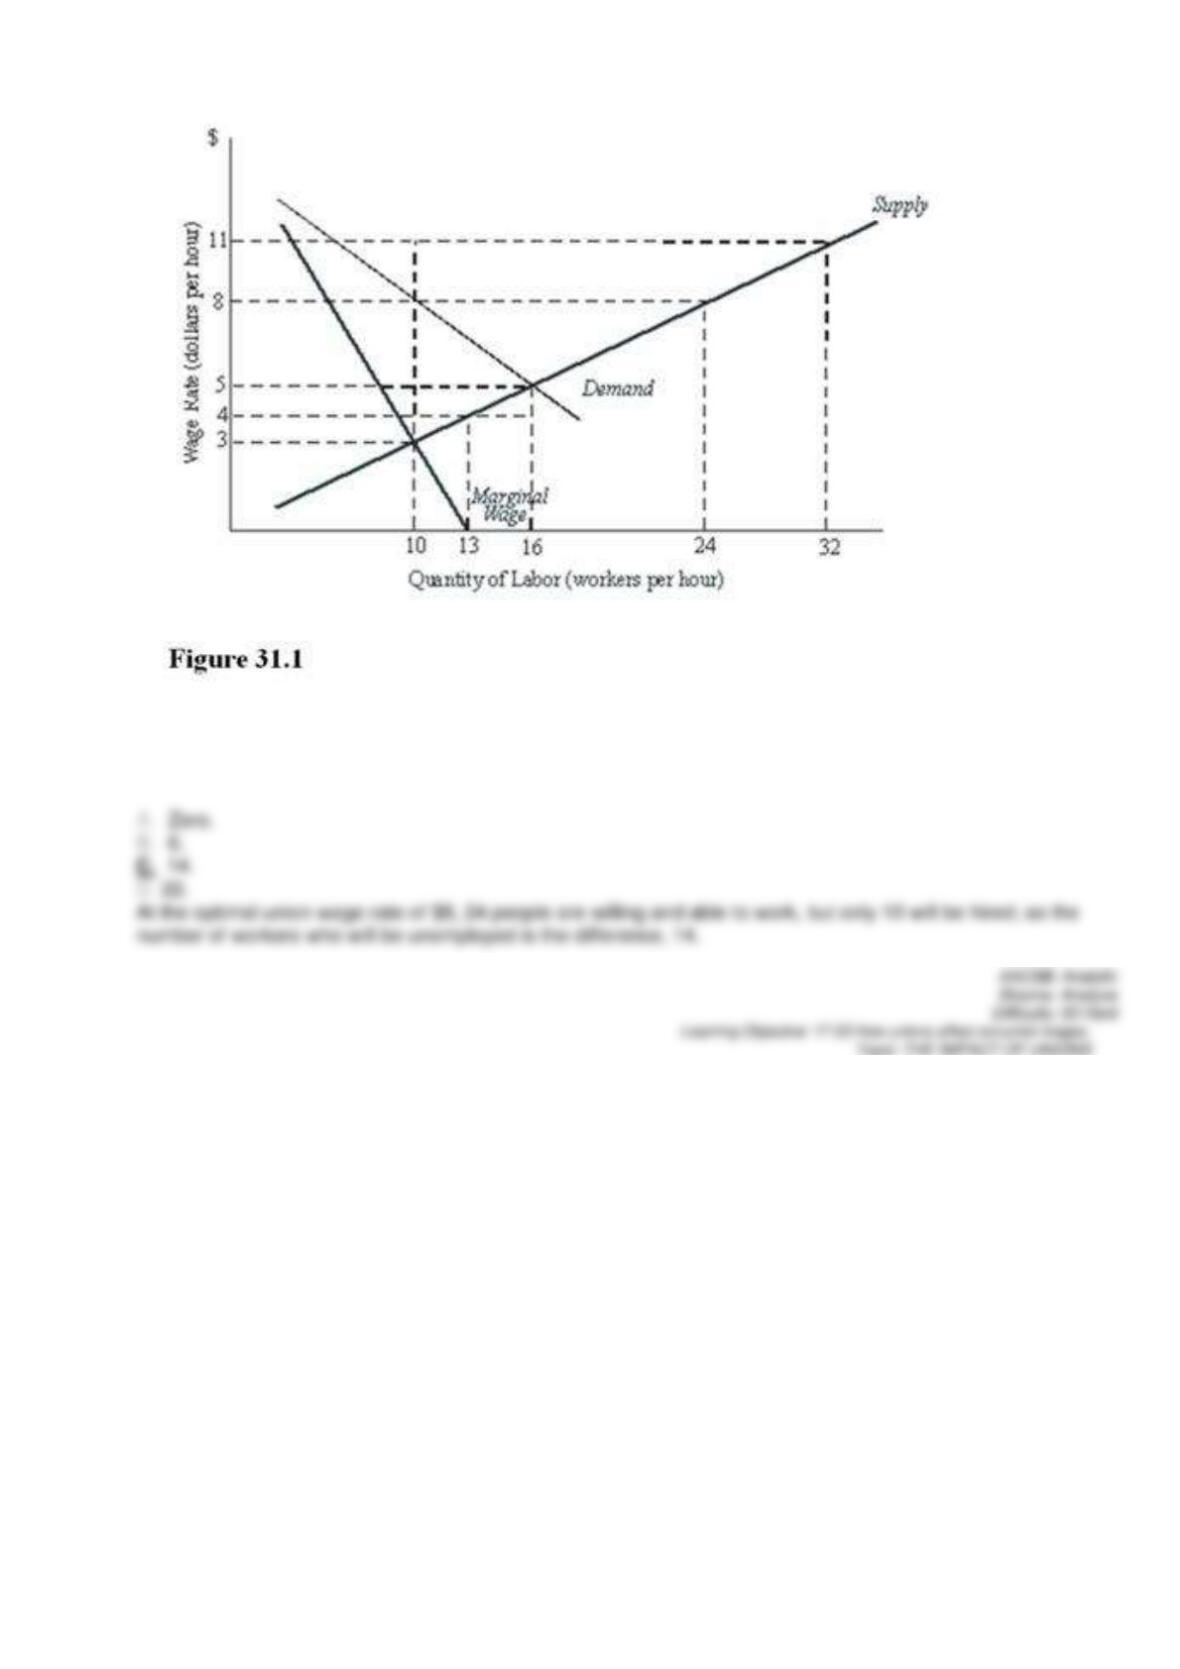
Which of the following indicates the number of workers who are willing to work but are unemployed at
the optimal union wage rate in Figure 31.1?
99.
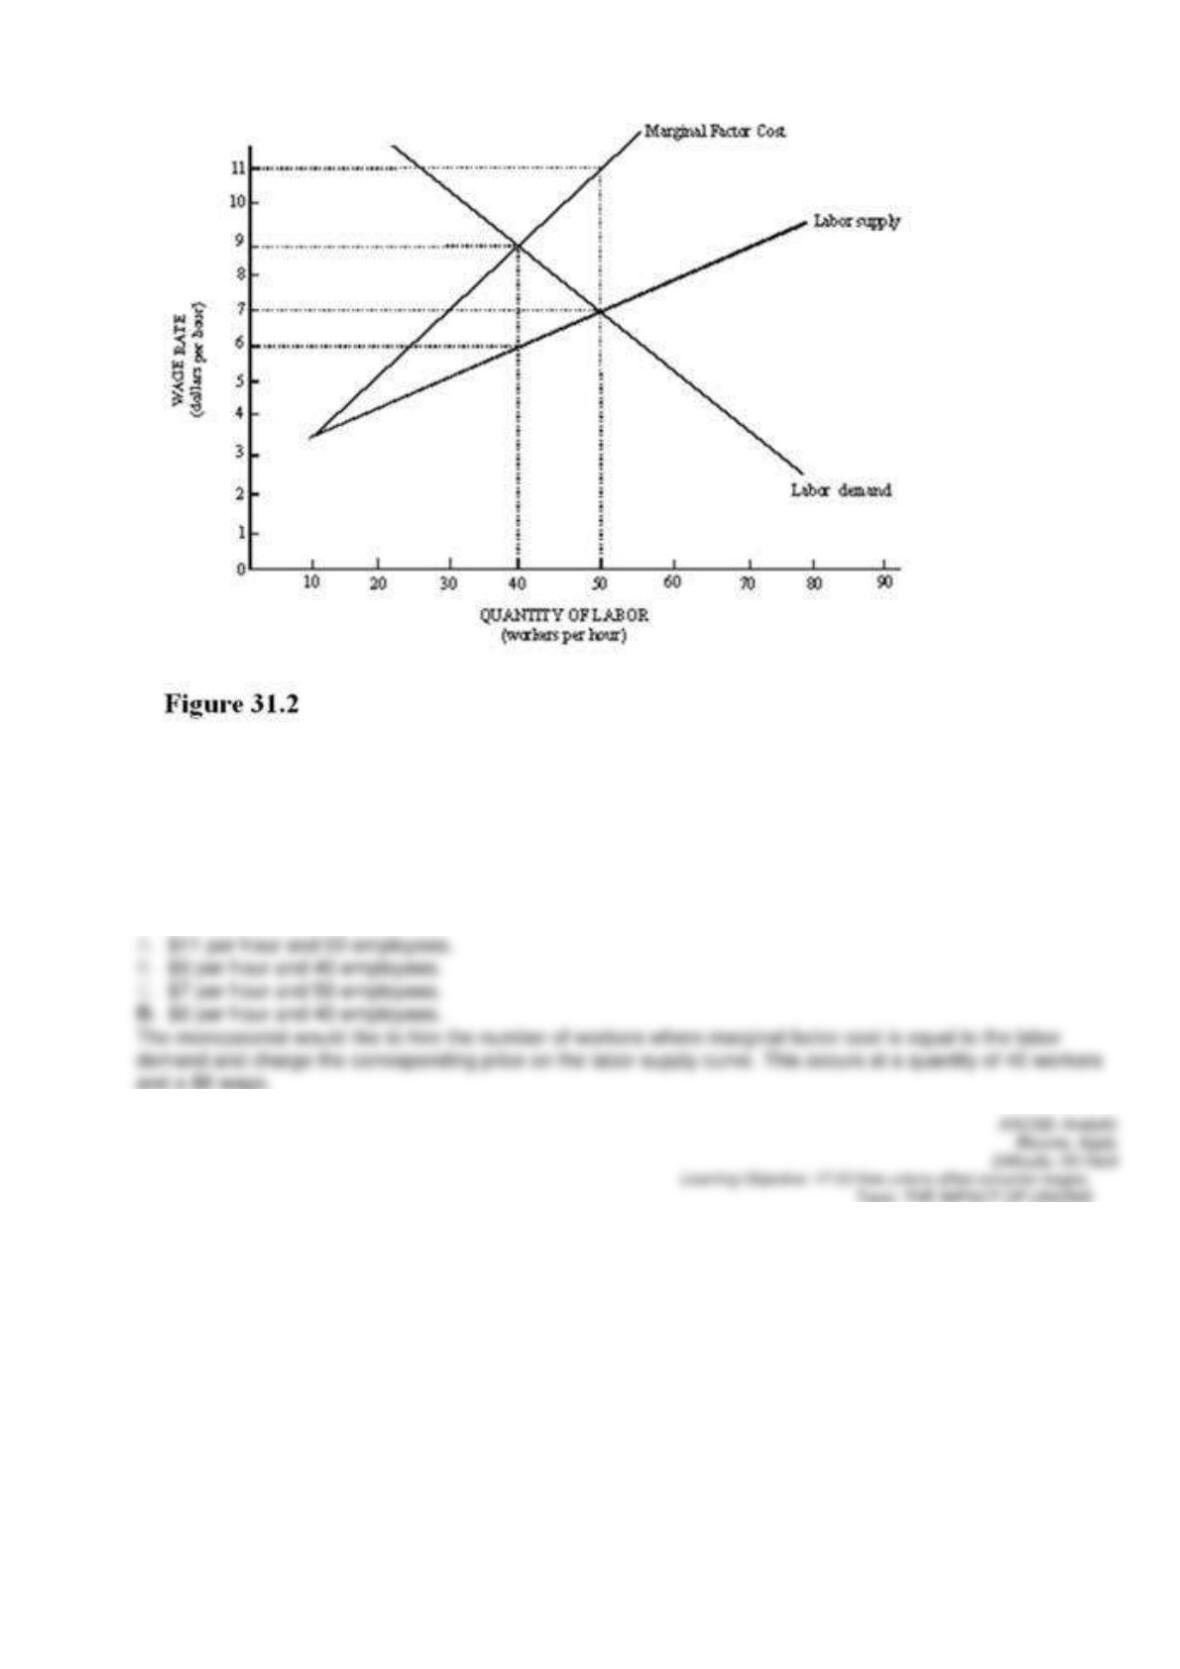
Refer to Figure 31.2 for a monopsonist employer. From the monopsonist’s standpoint, the optimal wage and
employment level would be
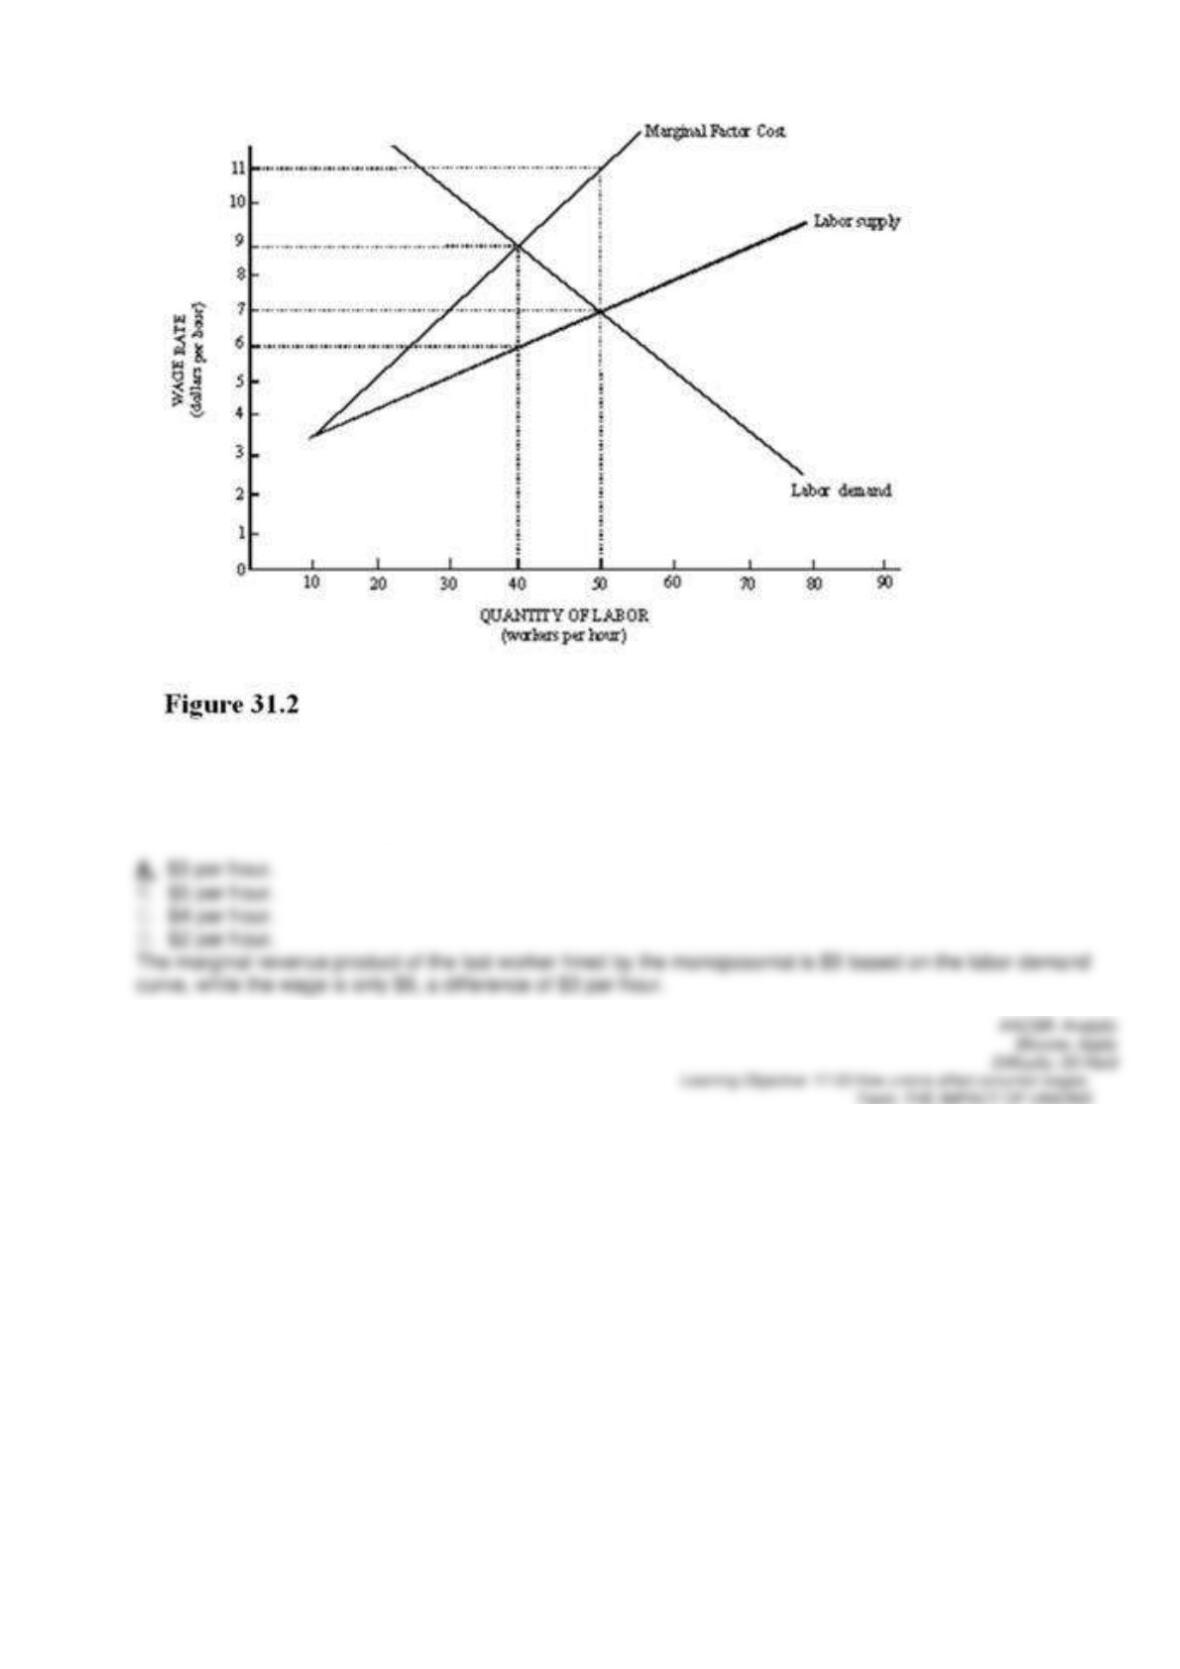
100.
In Figure 31.2, what is the difference between the marginal revenue product of the last worker hired by
the monopsonist and the wages the monopsonist pays the last worker?
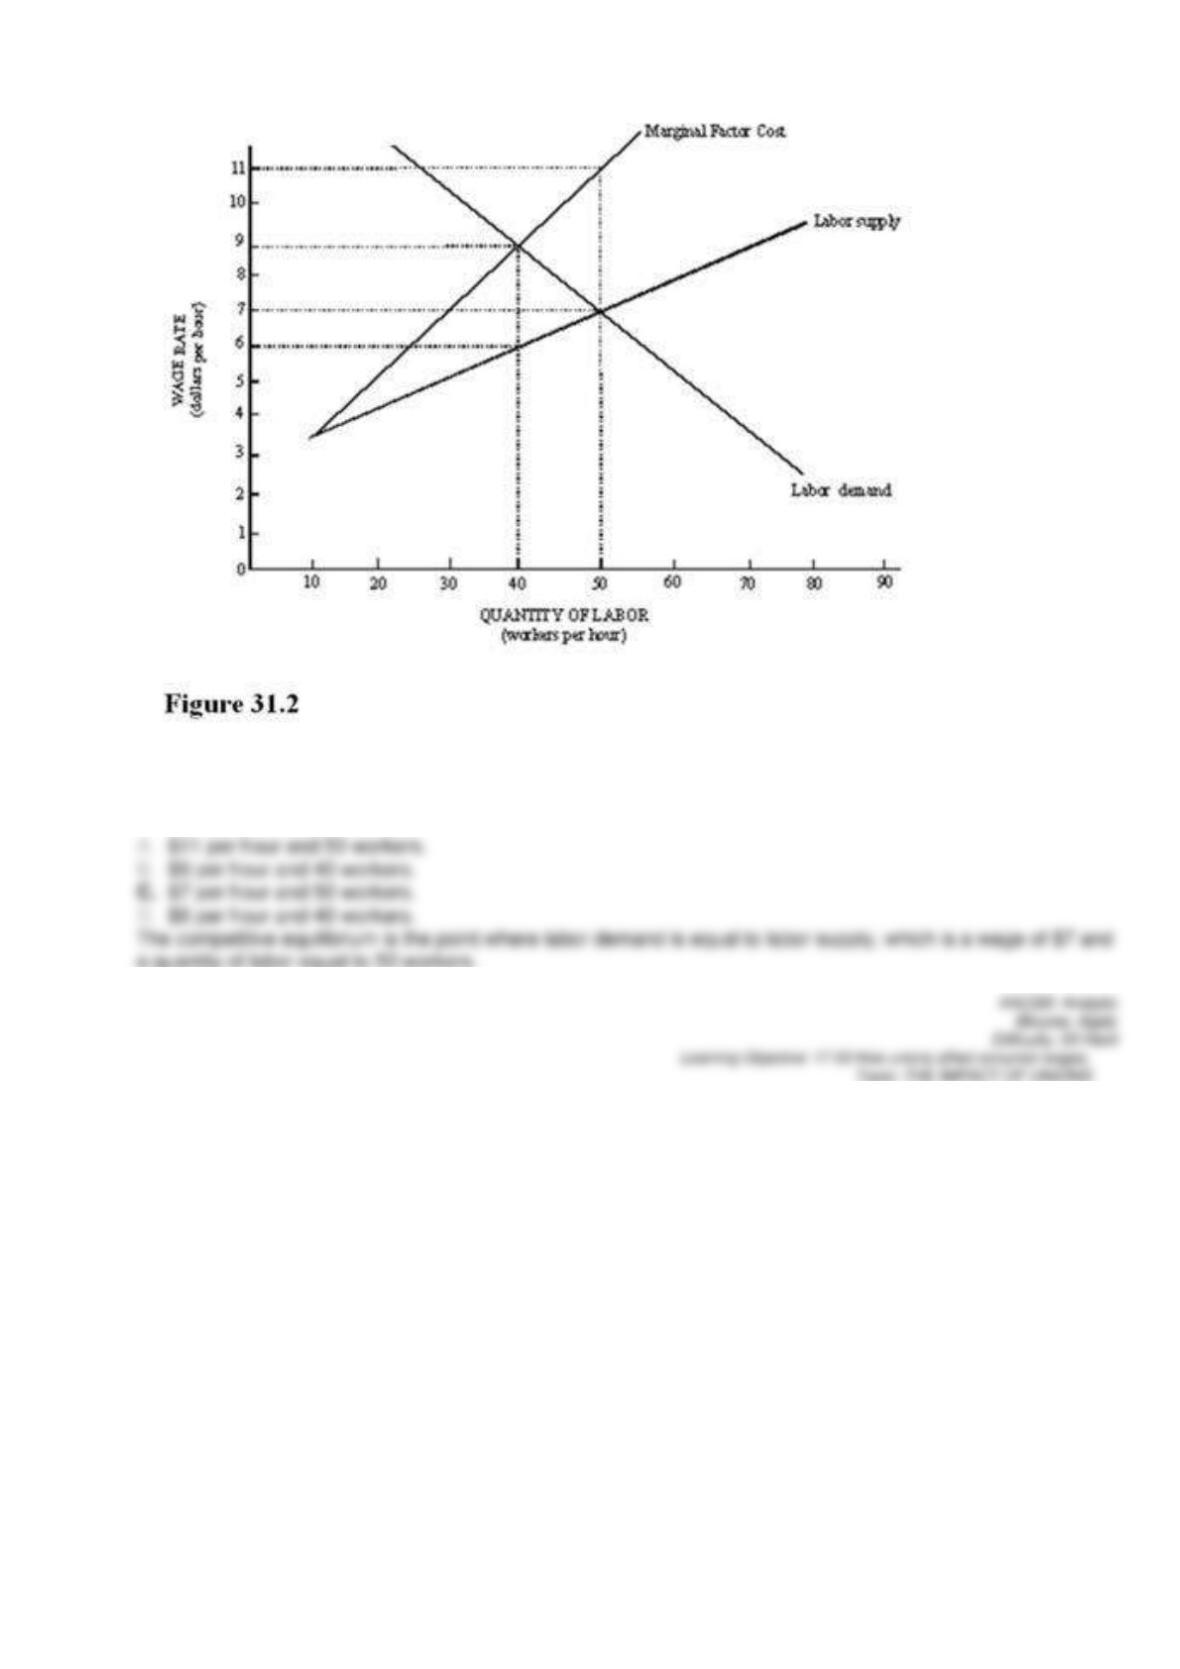
101.
Refer to Figure 31.2. What is the competitive level of wages and employment?
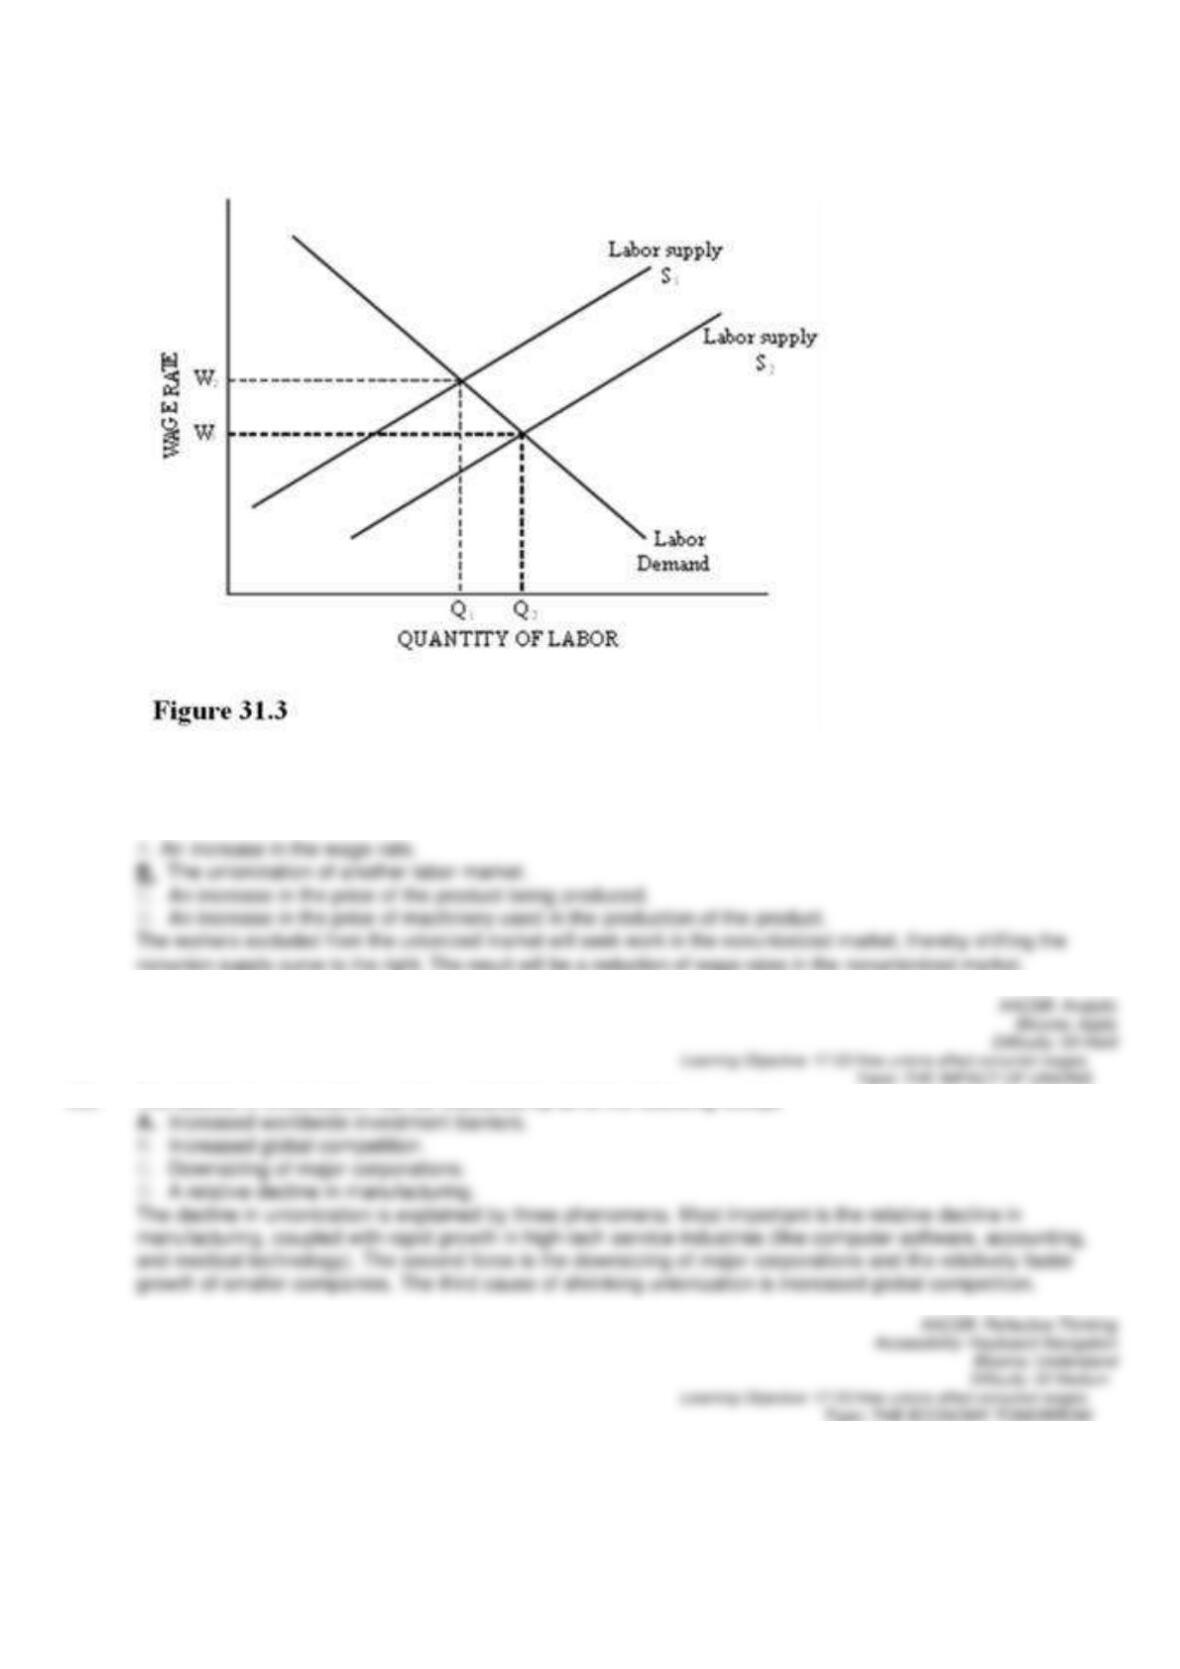
102.
Refer to Figure 31.3 for a competitive labor market.
A shift in labor supply from S1 to S2 could be caused by:.
103. The decline in unionization can be explained by all of the following except