Chapter 16: Understanding Residuals – Quiz A Name________________________
Use the following information for problems 1-3:
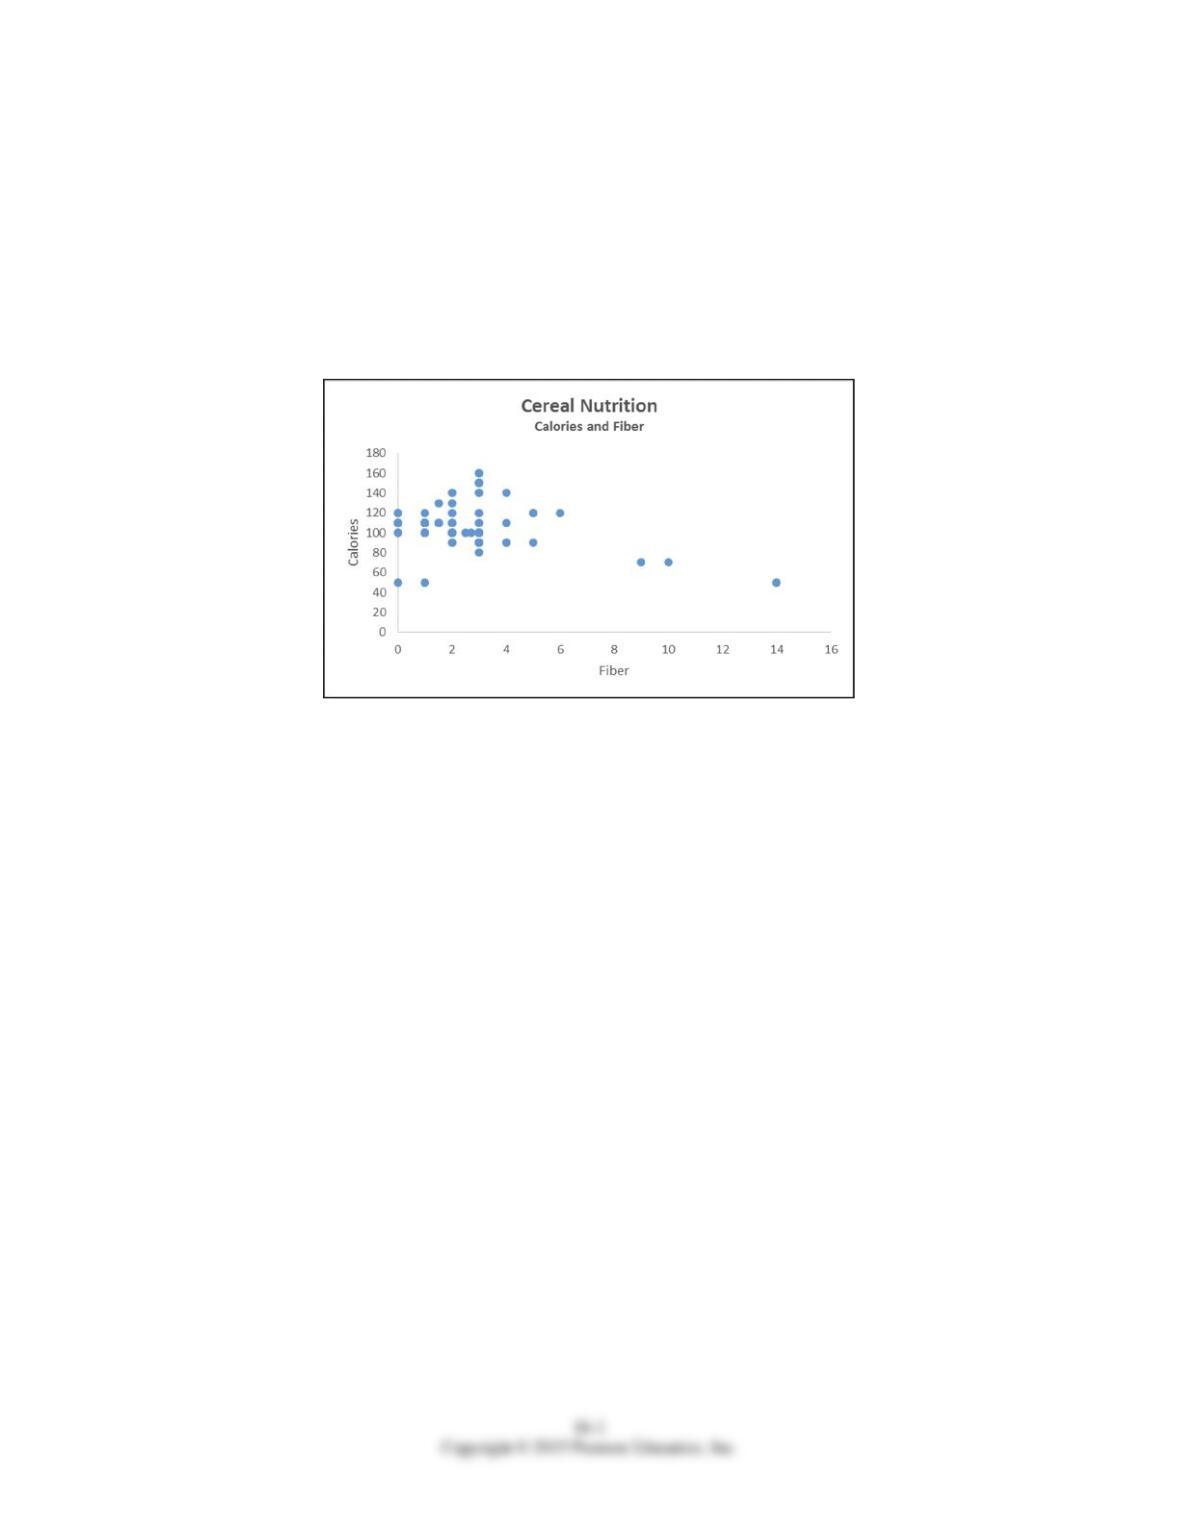
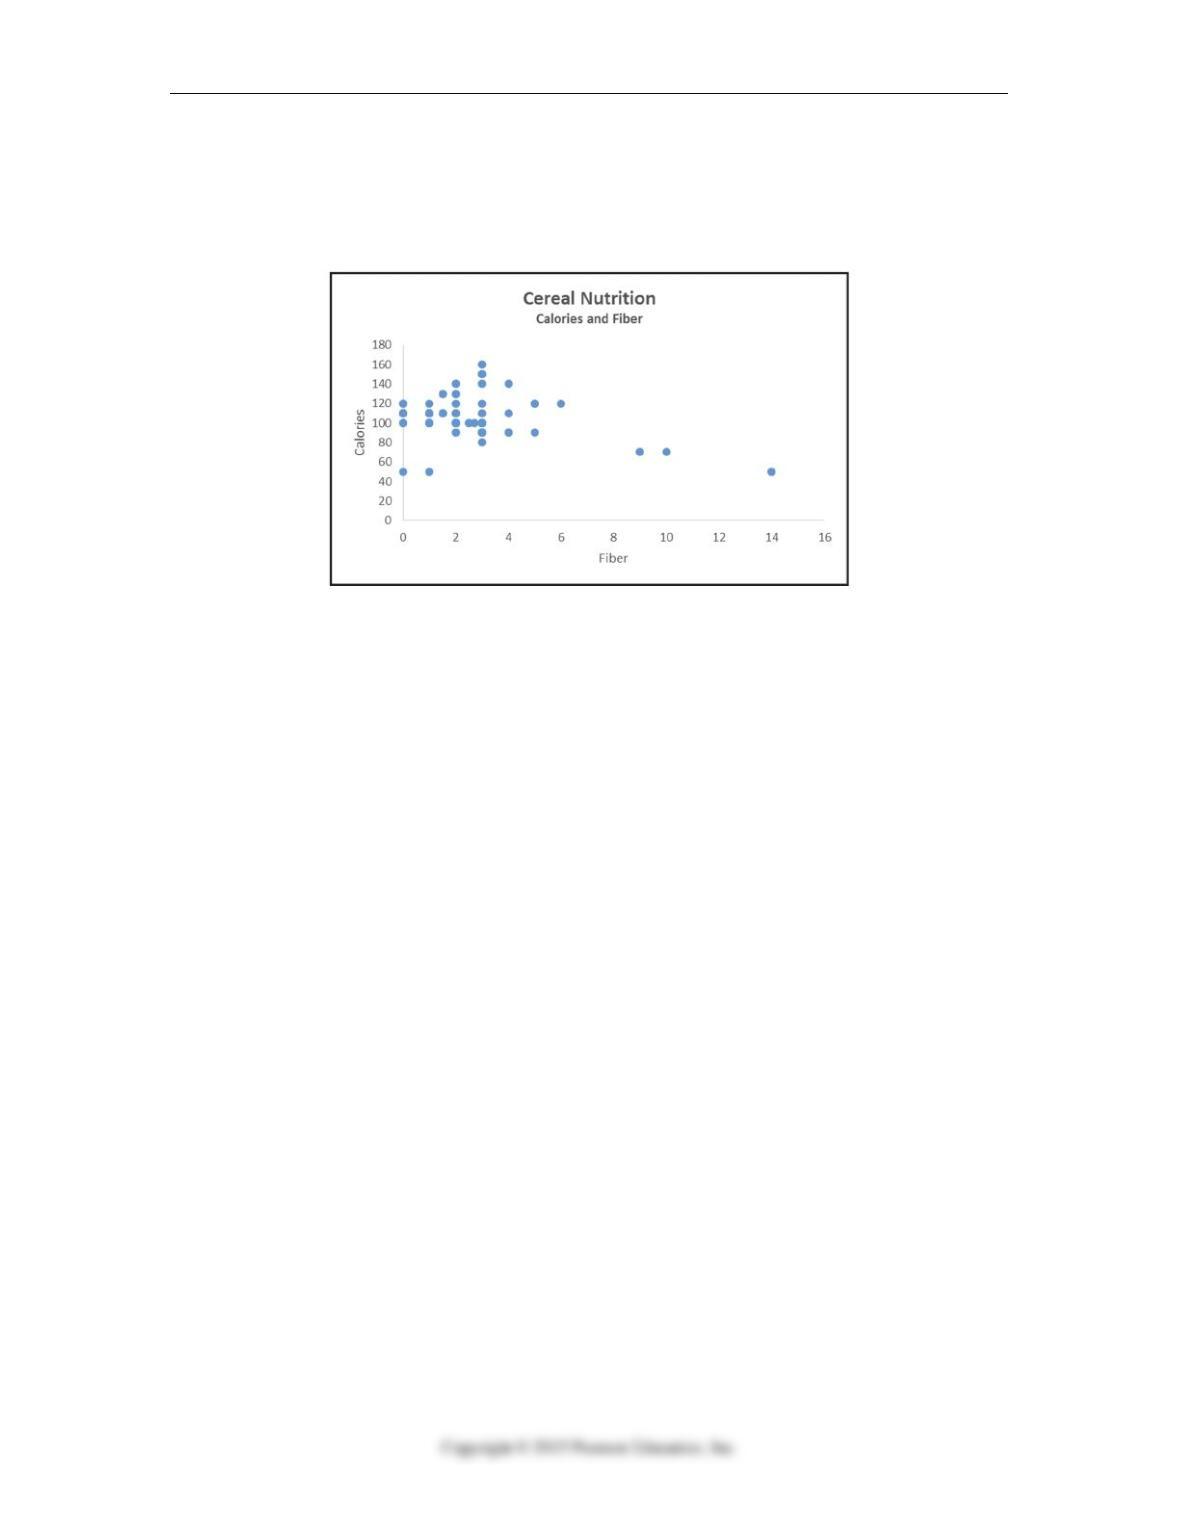
The advertising campaign for a high fiber cereal wants to claim that high fiber cereals are
lower in calories. In order to research this claim, they obtain nutritional information for
77 breakfast cereals including the amount of fiber (in grams) and the number of calories
per serving. The data resulted in the following scatterplot.
16.1.1 Interpret or analyze linear models or relationships.
1. Do you think there is a clear pattern? Describe the association between fiber and
calories.
16.3.3 Identify leveraged and/or influential points and determine if they affect the model.
2. Identify any unusual data points as outliers, leverage, and/or influential points.
Explain.
16.2.3 Identify leveraged and/or influential points and determine if they affect the model.
3. Do you think a model could accurately predict the number of calories in a serving of
cereal that has 22 grams of fiber? Explain.
16.5.4 Determine when linear models are appropriate and/or useful for predicting y‐
values.
4. A regression model was estimated to describe the trend in monthly closing stock
prices for the period of January 2007 through August 2008. A plot of residuals
against predicted values showed no unusual patterns. Should any further plots be
investigated? Why or why not?
16-2 Chapter 16 Understanding Residuals
16.5.5 Use the Durbin‐Watson statistic to test for autocorrelation
5. A regression model was estimated to describe the trend in monthly closing stock
prices for the period of January 2007 through August 2008. The Durbin-Watson
statistic for this regression was found to be 0.5626. What can you conclude from this
statistic?
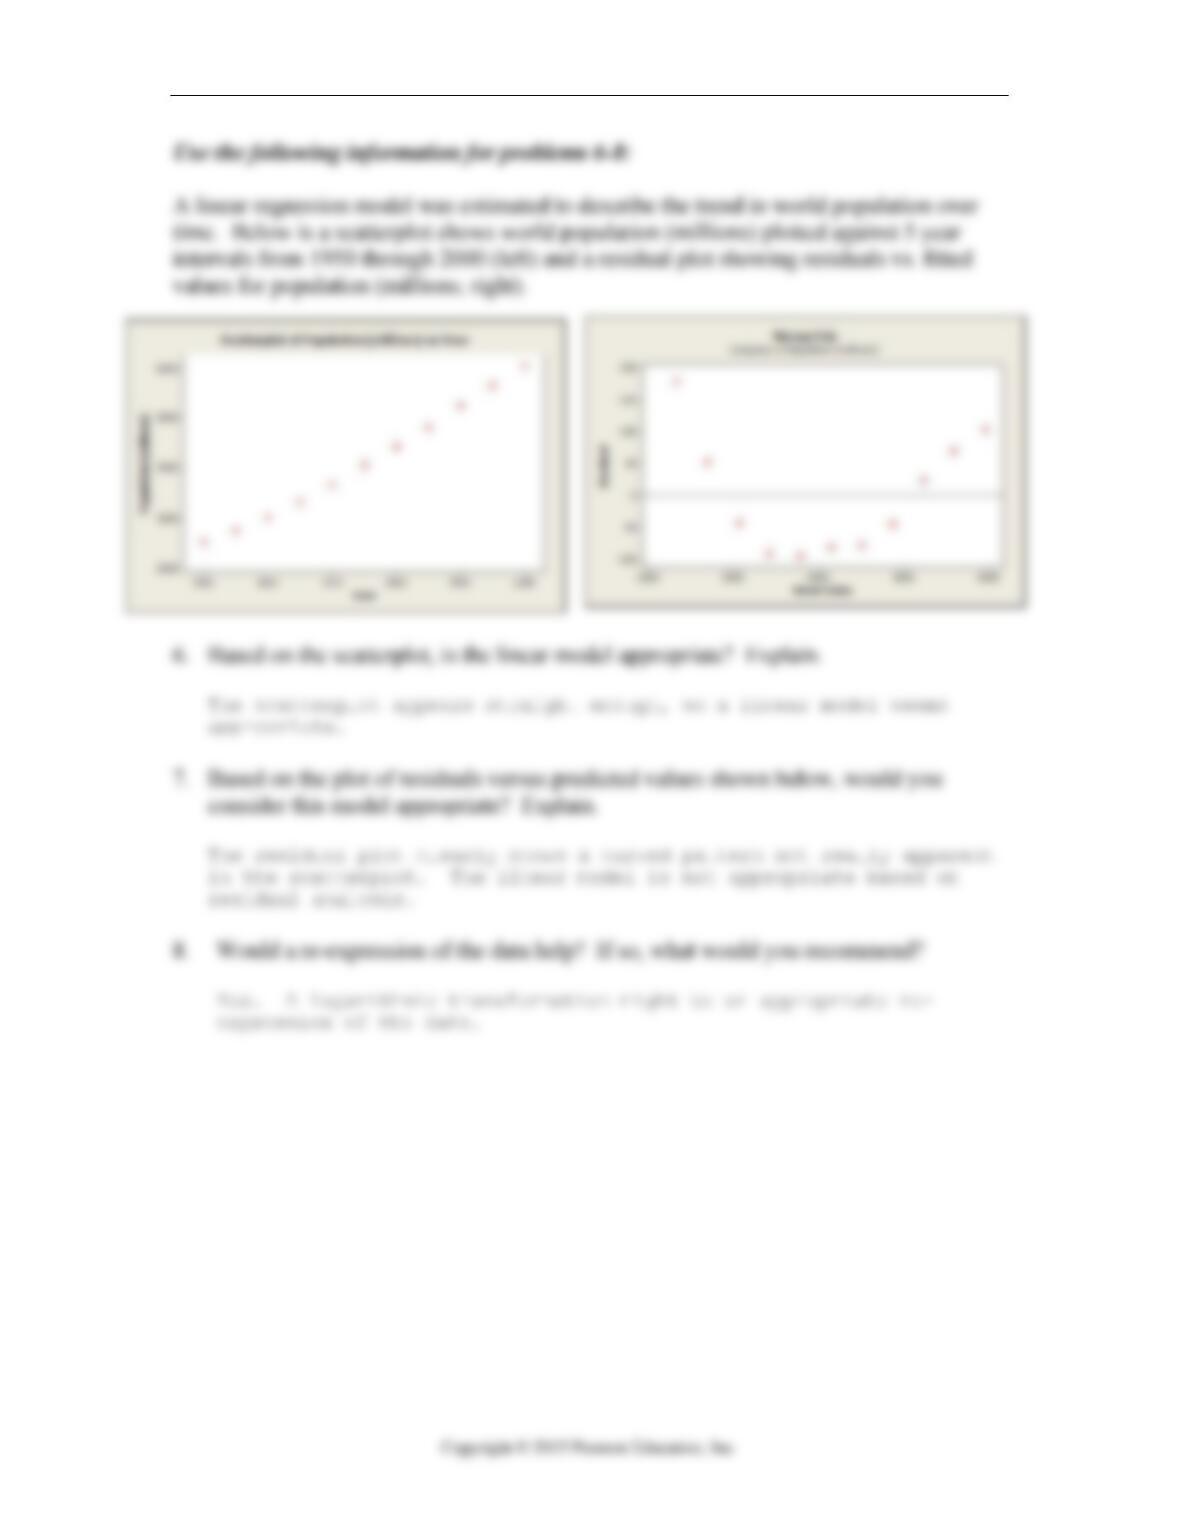
Use the following information for problems 6-8:
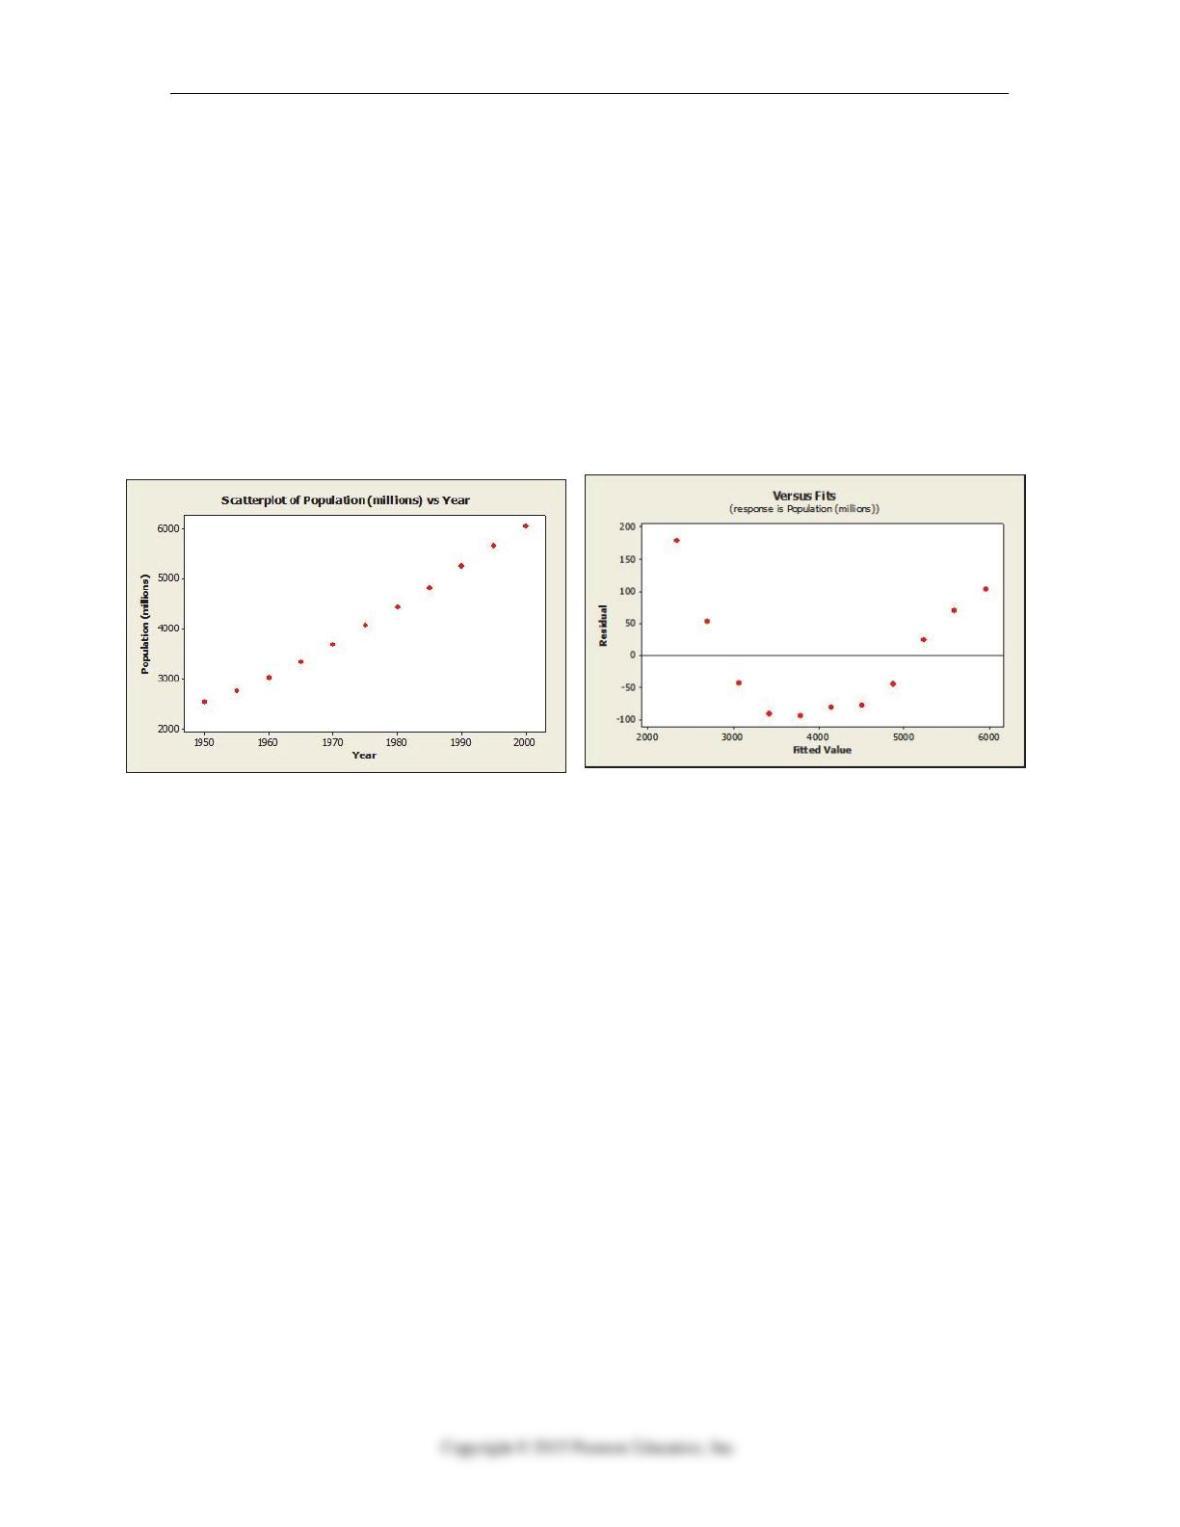
A linear regression model was estimated to describe the trend in world population over
time. Below is a scatterplot shows world population (millions) plotted against 5 year
intervals from 1950 through 2000 (left) and a residual plot showing residuals vs. fitted
values for population (millions; right).
16.2.4 Determine when linear models are appropriate and/or useful for predicting y‐
values.
6. Based on the scatterplot, is the linear model appropriate? Explain.
16.2.4 Determine when linear models are appropriate and/or useful for predicting y‐
values.
7. Based on the plot of residuals versus predicted values shown below, would you
consider this model appropriate? Explain.
16.6.6 Determine if a re‐expression is appropriate.
8. Would a re-expression of the data help? If so, what would you recommend?
Quiz A 16-3
Chapter 16: Understanding Residuals – Quiz A – Key
16-4 Chapter 16 Understanding Residuals
Quiz A 16-5
16-6 Chapter 16 Understanding Residuals
Chapter 16: Understanding Residuals – Quiz B Name ______________________
16.3.3 Identify leveraged and/or influential points and determine if they affect the model.
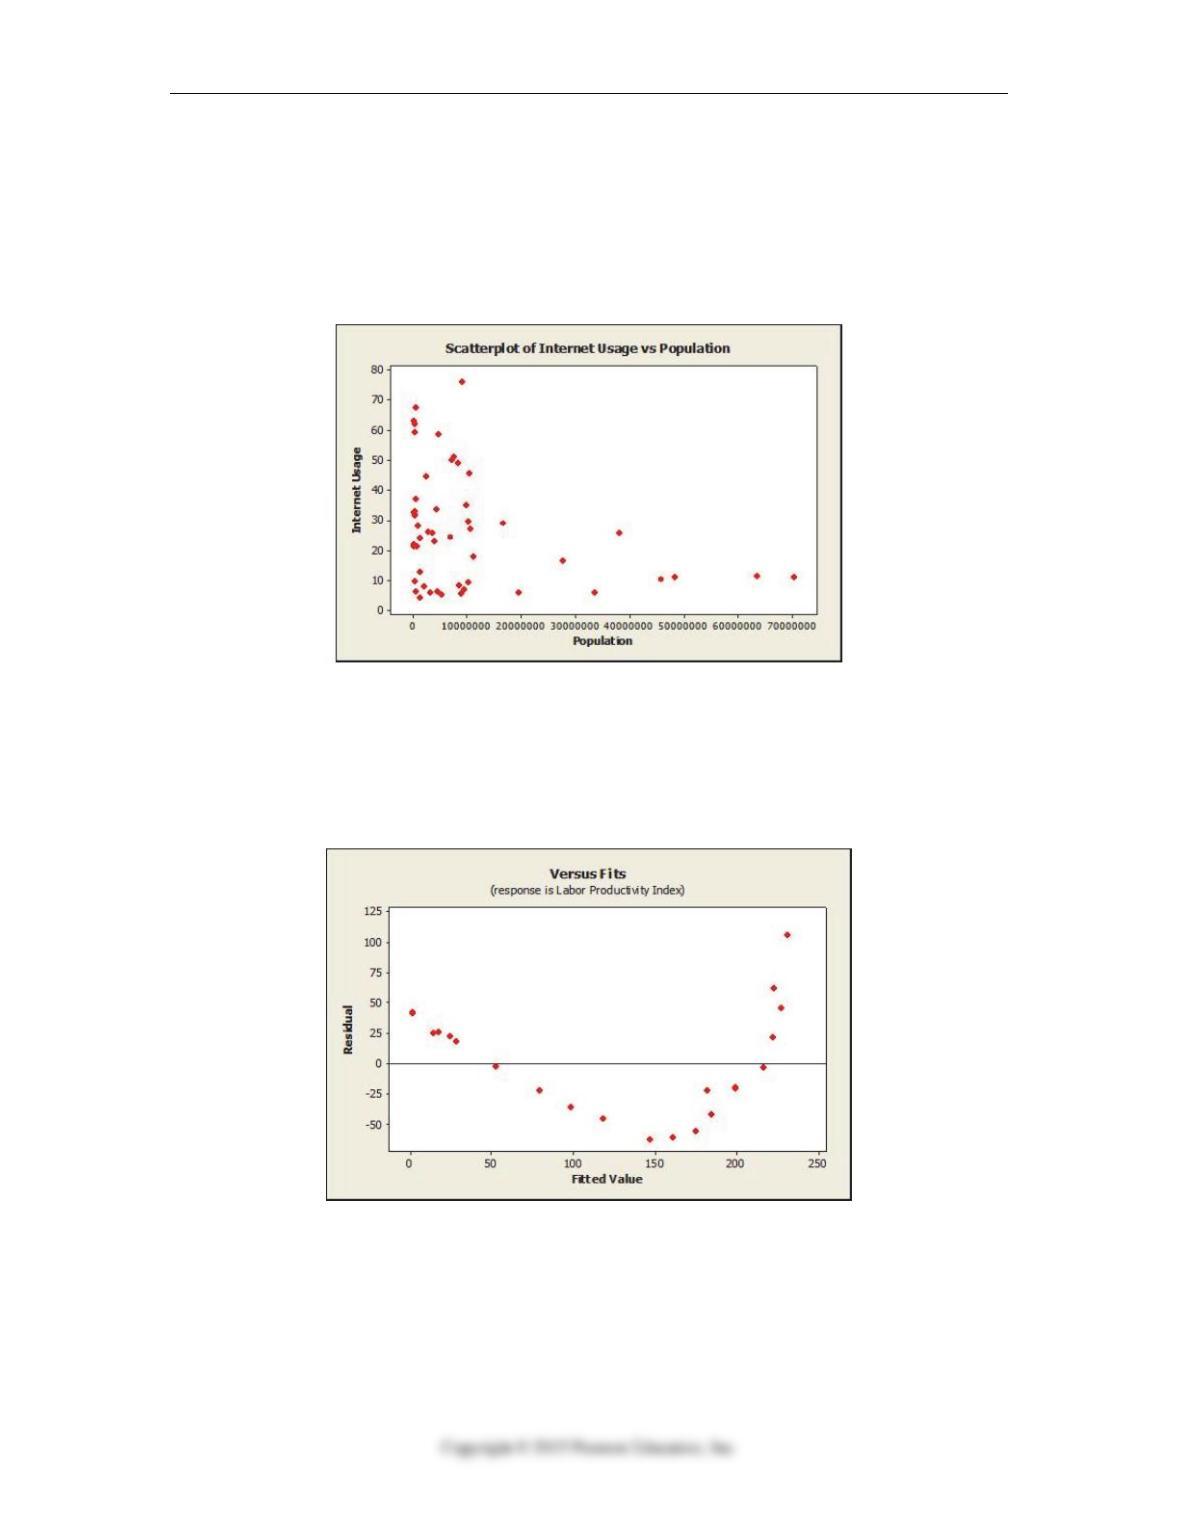
1. Data on internet usage (per 100 inhabitants) and population were collected for a
sample of 52 countries. In the scatterplot shown below, comment on any unusual
data point or points in the data set. Explain.
16.6.6 Determine if a re‐expression is appropriate.
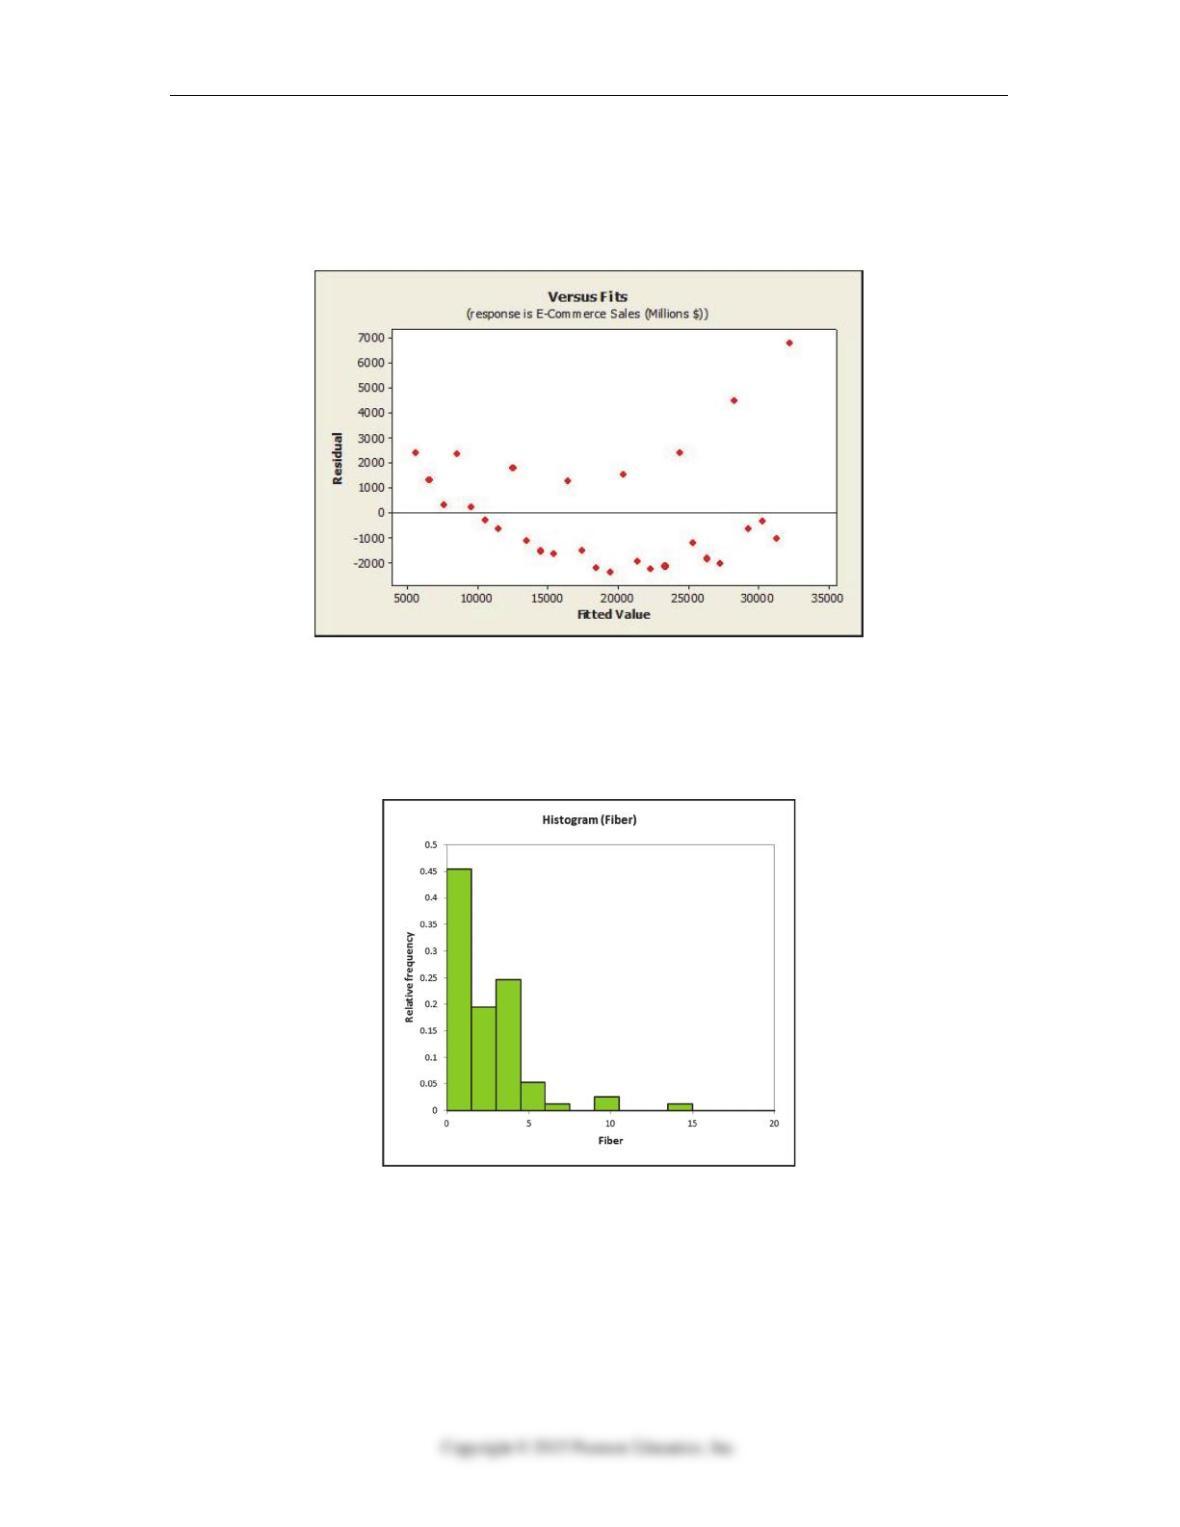
2. A regression was estimated to describe the linear relationship between labor
productivity and unit labor costs for the retail industry from 1987 through 2006.
According to the plot of residuals versus predicted values shown below, would a re-
expression of the data help? If so, what would you recommend?
Quiz B 16-7
16.1.1 Interpret or analyze linear models or relationships.
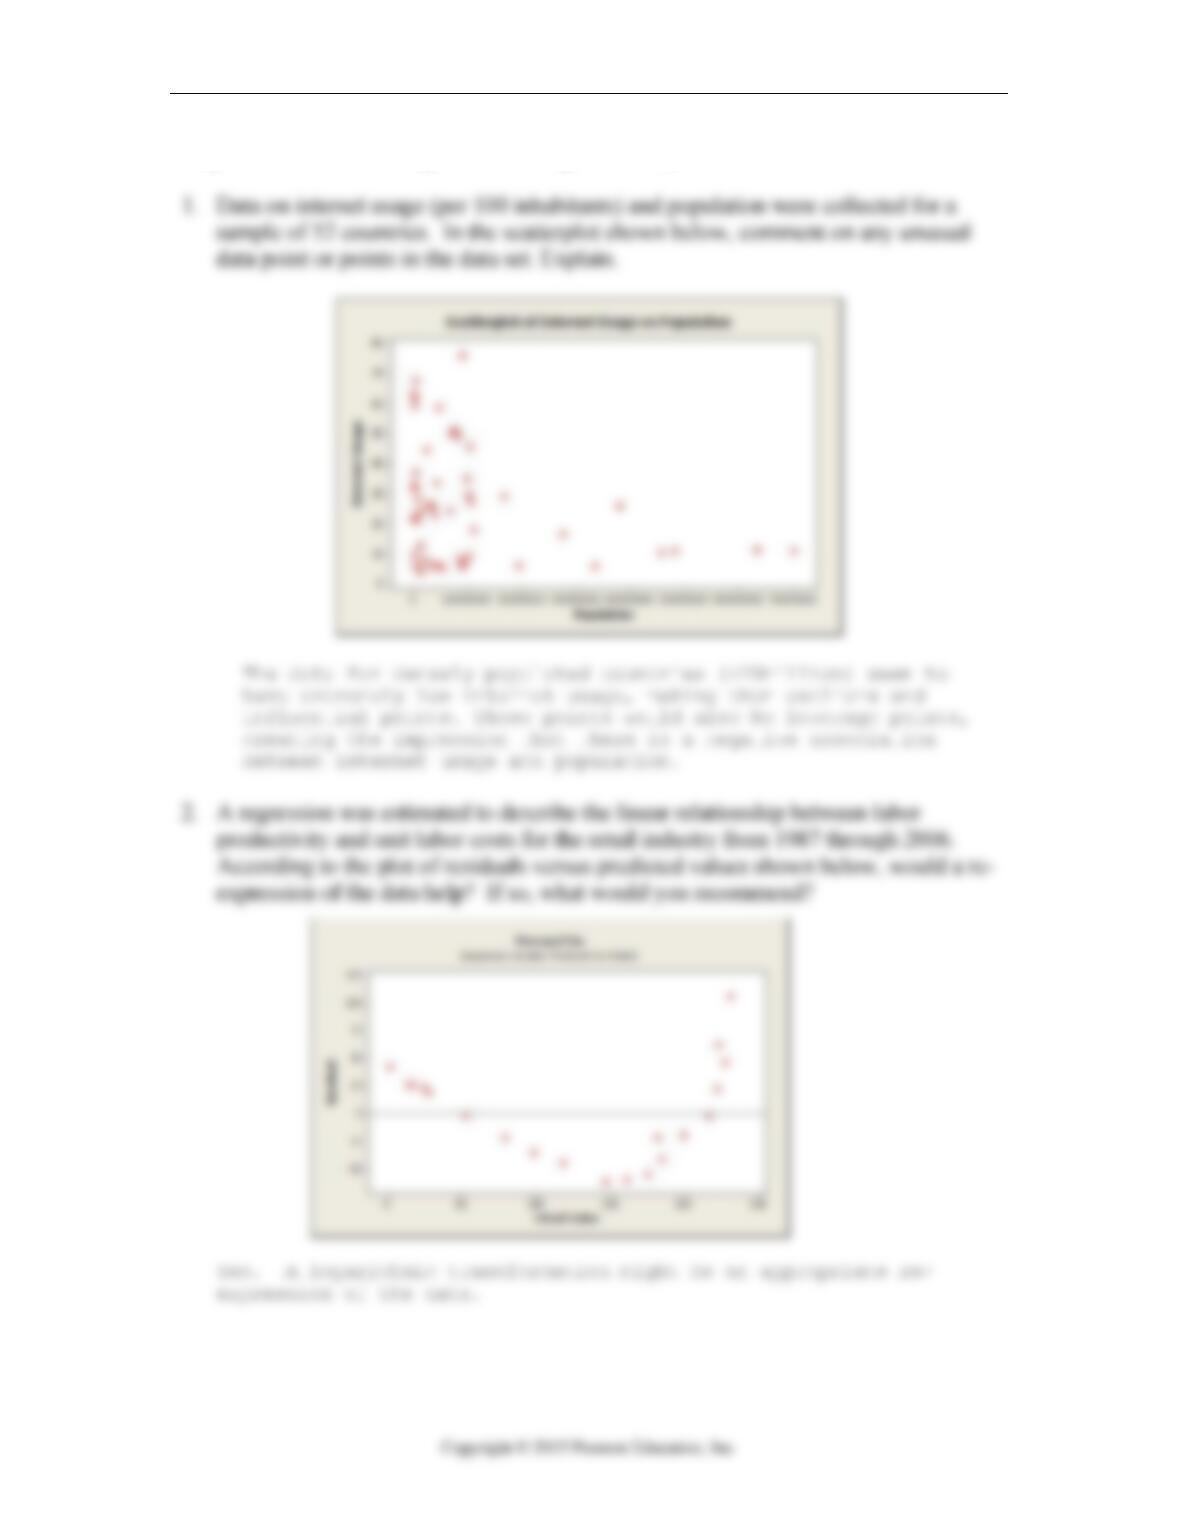
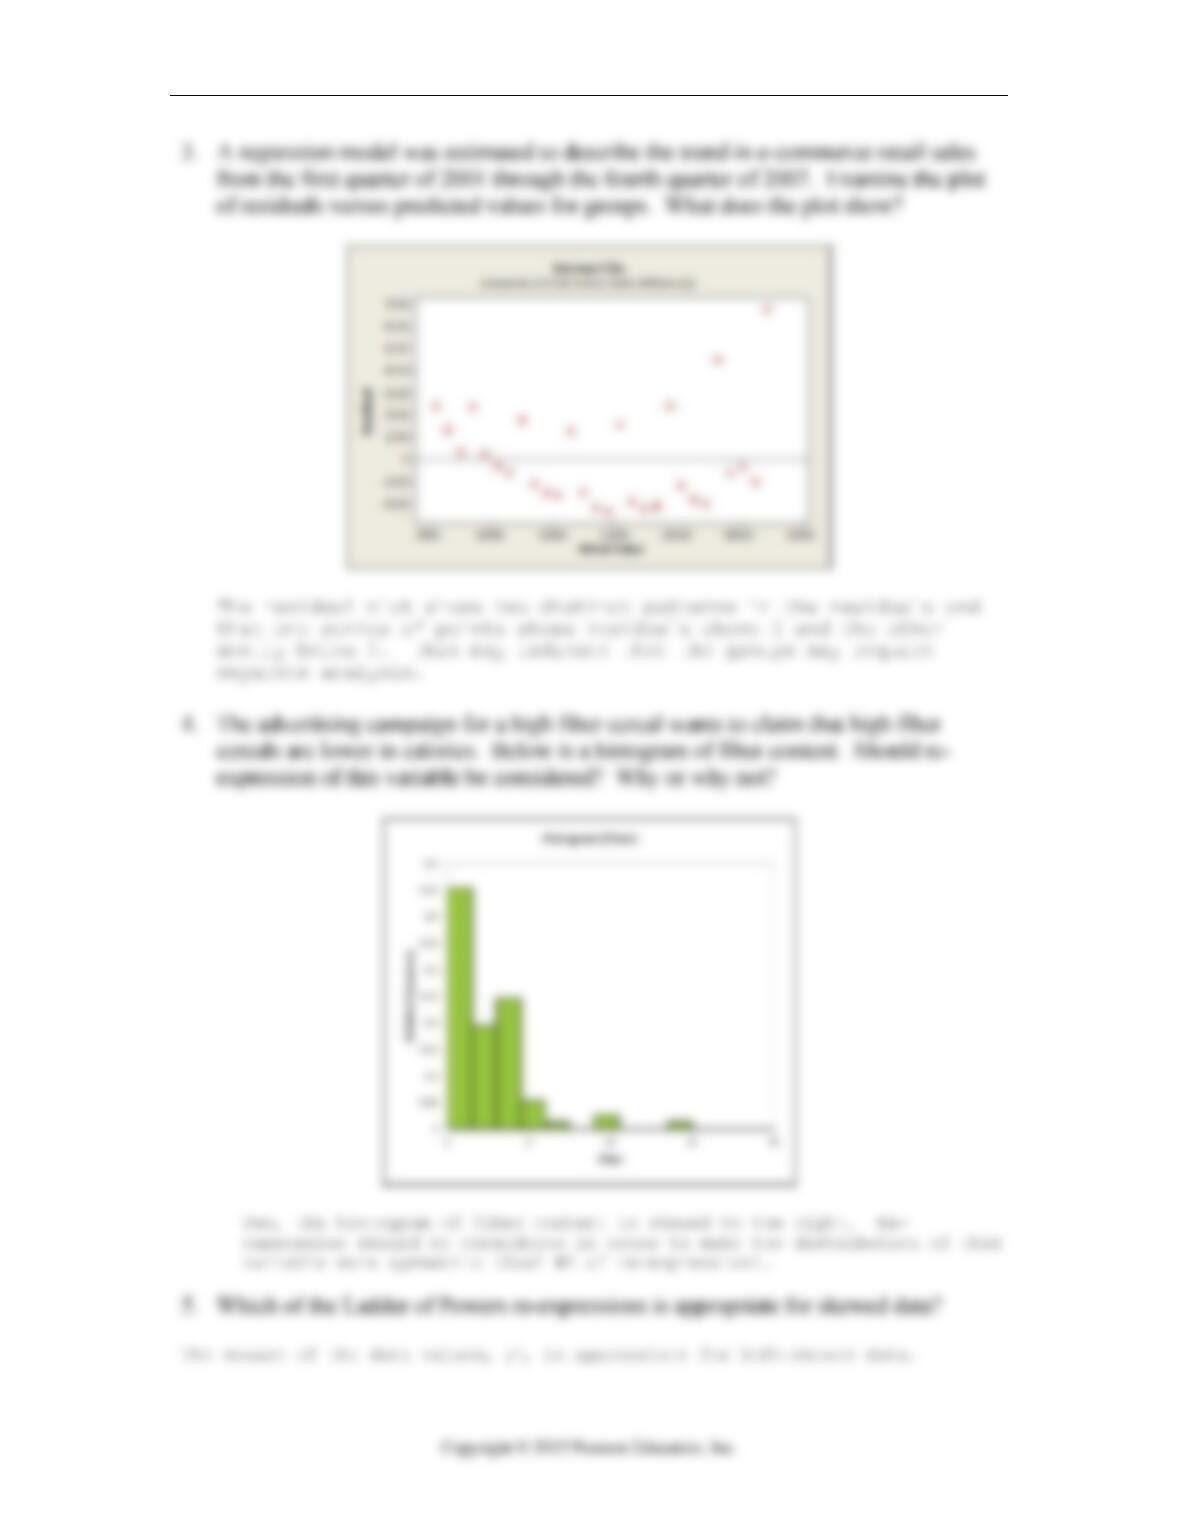
3. A regression model was estimated to describe the trend in e-commerce retail sales
from the first quarter of 2001 through the fourth quarter of 2007. Examine the plot of
residuals versus predicted values for groups. What does the plot show?
16.6.6 Determine if re-expression is appropriate.
4. The advertising campaign for a high fiber cereal wants to claim that high fiber
cereals are lower in calories. Below is a histogram of fiber content. Should re-
expression of this variable be considered? Why or why not?
16.7.6 Determine if re-expression is appropriate.
5. Which of the Ladder of Powers re-expressions is appropriate for skewed data?
16-8 Chapter 16 Understanding Residuals
Chapter 16: Understanding Residuals – Quiz B – Key
Quiz B 16-9

16-10 Chapter 16 Understanding Residuals
Chapter 16: Understanding Residuals Name:________________________
Quiz C – Multiple Choice
16.1.1 Interpret or analyze linear models or relationships
1. Which of the following plots can be used to indicate that there may be different
groups in the data that should be considered separately?
A. Histogram of the residuals.
B. Residuals vs predicted values.
C. A scatterplot showing regression lines for each group.
D. All of these.
E. None of these.
16.5.5 Use the Durbin‐Watson statistic to test for autocorrelation.
2. A regression model was estimated to describe the trend in closing stock prices over 8
months. The Durbin Watson statistic was calculated as 0.5626. Using α = .01 we can
conclude that there is evidence of
A. Positive autocorrelation.
B. Negative autocorrelation.
C. Positive or negative autocorrelation.
D. An outlier.
E. An inconclusive test.
16.7.6 Determine if a re-expression is appropriate.
3. Which of the following Ladder of Powers is a good place to start if you are dealing
with counted data?
A. The (negative) square root.
B. The (negative) reciprocal square root.
C. Square of the data values.
D. Square root of the data values.
E. Base-10 Log.
16.4.1 Interpret or analyze linear models or relationships.
4. Data were collected for a sample of companies regarding their investment in quality
improvement efforts and cost savings realized as a result (both measured as a percentage
of sales revenue). The R2 for the regression is 0.833. If the data were collected for
individual departments within companies rather than at the company level, we would
expect
A. A higher R2.
B. A lower R2.
C. The same R2.
D. Fewer outliers in the data.
E. None of the above.
Quiz C 16-11
16.6.6 Determine if a re-expression is appropriate.
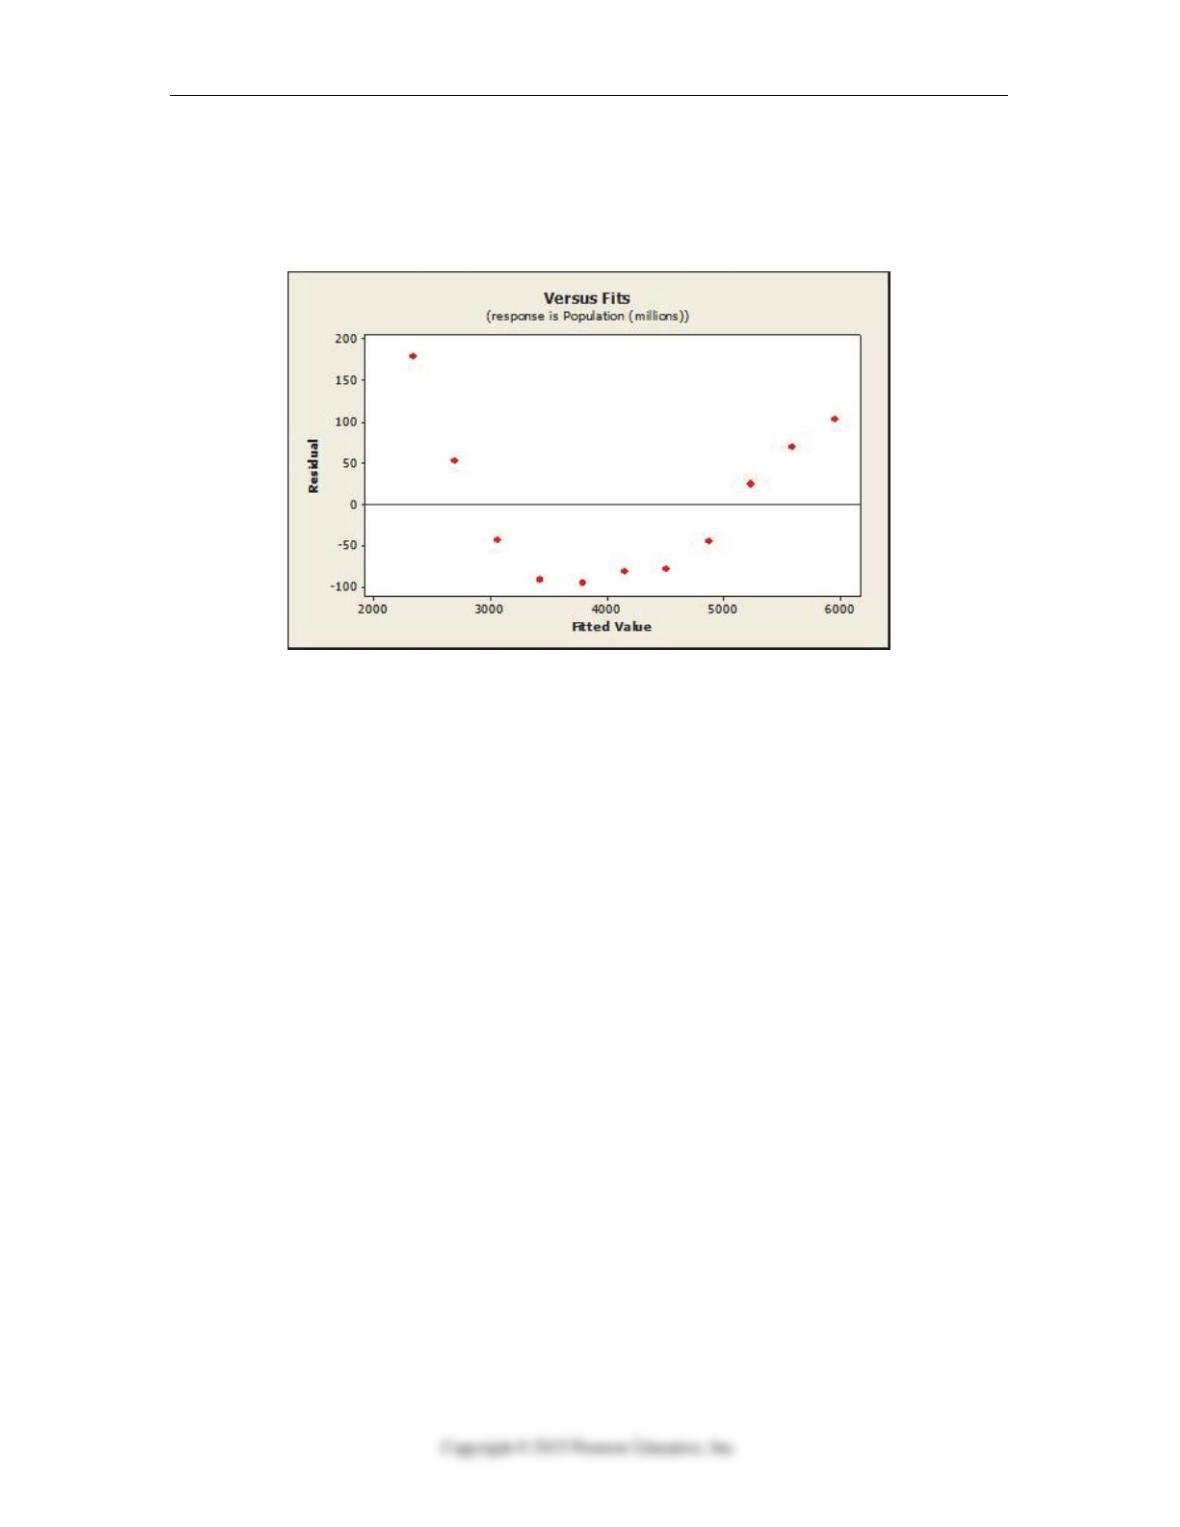
5. A linear regression model was estimated to describe the trend in world population
over time. Below is the plot of residuals versus predicted values. Which of the following
re-expression of the data would be appropriate?
A. Square the data values.
B. Cube the data values.
C. Use a logarithmic transformation.
D. Use a geometric transformation.
E. The data should not be transformed.
16.1.4 Determine when linear models are appropriate and/or useful for predicting y-
values.
6. A residual analysis results in the finding that there are many residuals clustered
closely around 0, but there is also some predicted values that have very large (>0)
residuals and some that have very small (<0) residuals. This may indicate that
A. there are groups that should be analyzed separately
B. a linear model is not appropriate for this data
C. there is a positive autocorrelation.
D. a transformation is necessary.
E. the regression model is providing good estimates.
16-12 Chapter 16 Understanding Residuals
16.5.5 Recognize the presence of autocorrelation in residuals.
7. Quarterly figures for e-commerce retail sales were obtained from the first quarter of
2001 through the fourth quarter of 2007. A regression model was estimated to describe
the trend in e-commerce retail sales over time. The Durbin Watson statistic was
calculated as 1.727. Using α = .01 we can conclude that there is
A. evidence of positive autocorrelation.
B. evidence of negative autocorrelation.
C. no evidence of positive or negative autocorrelation.
D. evidence of an outlier.
E. an inconclusive test.
16.3.4 Determine when linear models are appropriate and/or useful for predicting y-
values
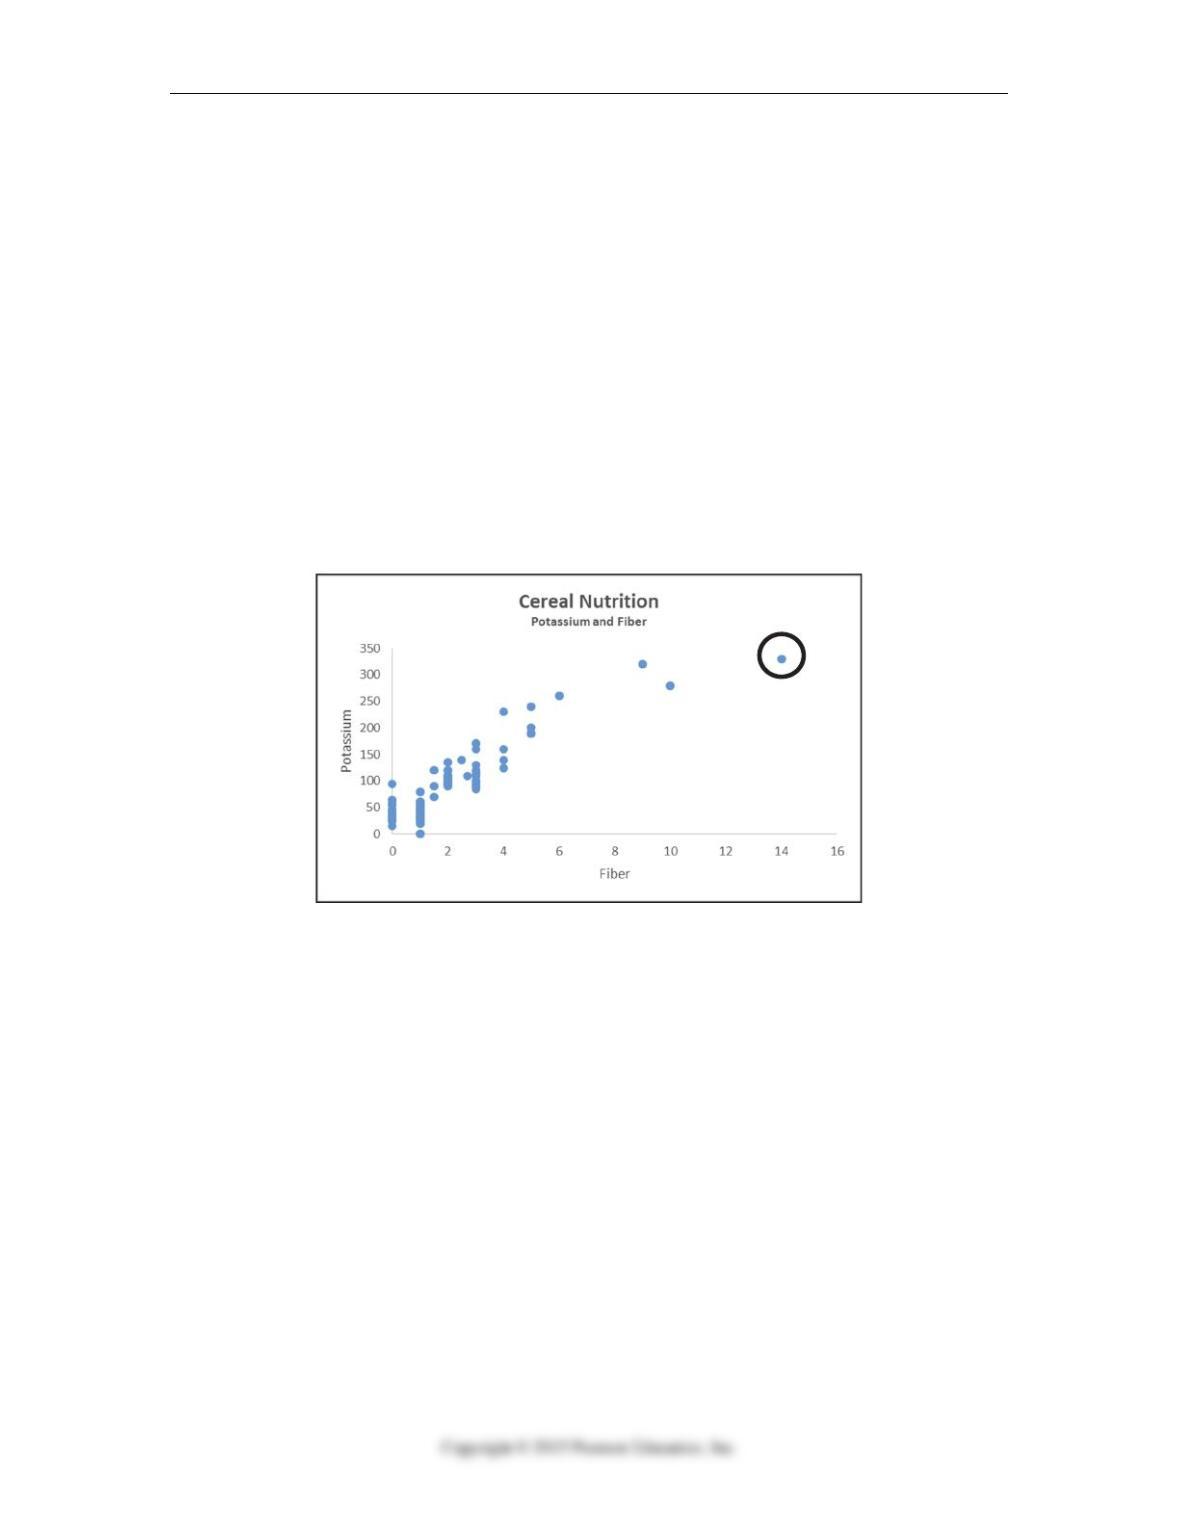
8. A regression model was developed relating fiber and potassium content for a sample of
cereals. The circled observation is
A. an outlier and leverage point
B. an outlier and influential point
C. a leverage and influential point
D. an influential point only
E. an outlier only
Quiz C 16-13
16.6.6 Re-express data to make them appropriate for use with a linear model
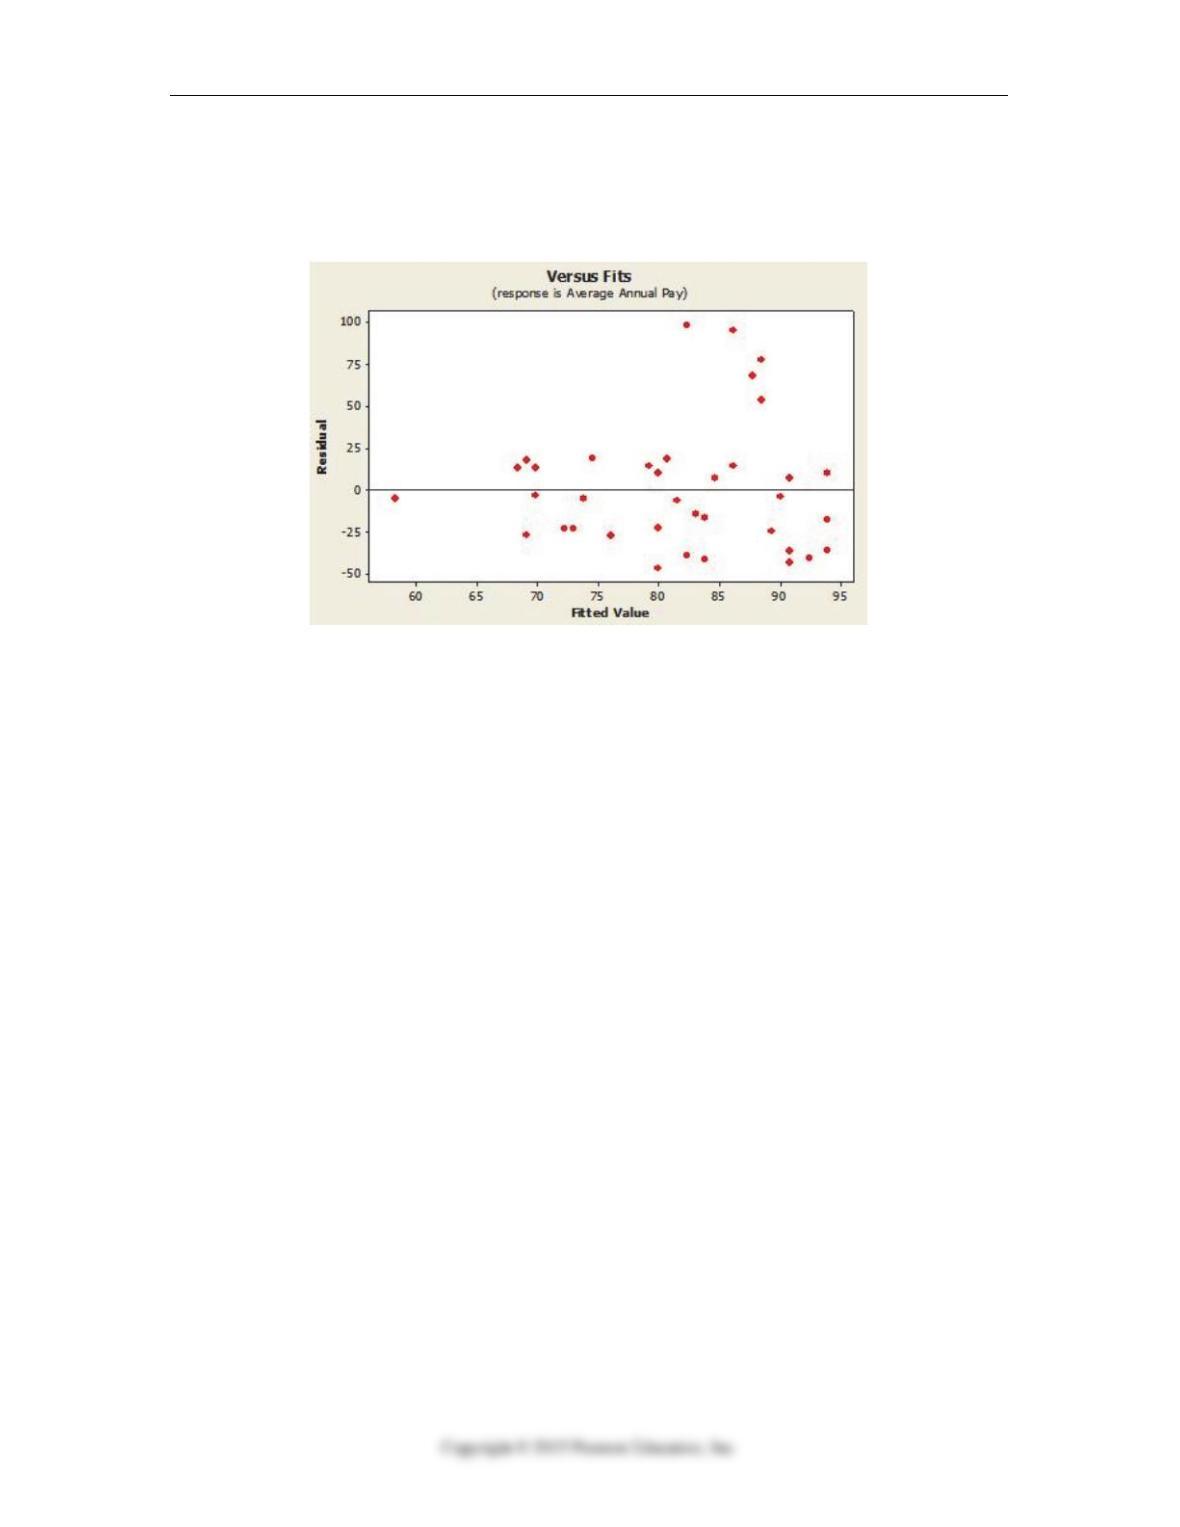
9. A regression model was developed relating average annual pay to the percentage of
women employed for a sample of companies. Below is the plot of residuals versus
predicted values. Which of the following re-expression of the data would be appropriate?
A. Square the data values.
B. Cube the data values.
C. Use a logarithmic transformation.
D. Use a geometric transformation.
E. The data should not be transformed.
16-14 Chapter 16 Understanding Residuals
16.3.3 Recognize unusual or extraordinary points.
10. Nutritional information for 77 breakfast cereals including the amount of fiber (in
grams) and the number of calories per serving. The data resulted in the following
scatterplot. Which statement below is true?
A. Some high leverage points are evident.
B. There is a strong positive association between amount of fiber and number of
calories per serving.
C. As the amount of fiber increases so does the number of calories per serving.
D. Both A and B.
E. All of the above.

Quiz C 16-15
Chapter 16: Understanding Residuals – Quiz C – Key

16-16 Chapter 16 Understanding Residuals
Chapter 16: Understanding Residuals Name:__________________
Quiz D – Multiple Choice
16.1.1 Interpret or analyze linear models or relationships
1. The analysis of unusually large or small residuals can help us to
A. Discover groups in our data
B. Identify unusual or extreme observations
C. Explore other factors in the relationship
D. All of these
E. None of these
16.2.2 Use models to make predictions
2. Data on internet usage (per 100 inhabitants) and population were collected for a
sample of 52 countries whose populations ranged from 0 to 40 million. Suppose the
linear model fit to these data is used to determine Internet usage in India, a country
with a population of 1,153,230,948. This would be called
A. an accurate prediction.
B. an extrapolation.
C. a time series prediction.
D. an exaggeration.
E. a residual.
16.3.3 Identify leveraged and/or influential points and determine if they affect the model.
3. An outlier is a point with
A. A y-value far from the regression model
B. An x-value far from the mean of the x-values
C. A value that, upon removal, results in a very different model
D. An extremely high y-value
E. An extremely high x-value
16.3.4 Determine when linear models are appropriate and/or useful for predicting y-
values
4. A high leverage point
A. Can hide in plots of residuals
B. Can be informative about the relationship between x and y
C. Should probably be omitted
D. Can pull the regression line, making the slope appear smaller
E. All of these

Quiz D 16-17
16.4.1 Interpret or analyze linear models or relationships.
5. When working with scatterplots of summary values
A. We get a good representation of the variation in the data
B. Conclusions will be the same as a random sample of individual data values
C. Data appears more variable than data collected on individuals
D. The strength of a relationship can be inflated
E. None of these
16.5.4 Determine when linear models are appropriate and/or useful for predicting y-
values.
6. A regression model applied to autocorrelated data will have
A. errors that are independent
B. residuals with no pattern over time
C. a Durbin-Watson D that is not close to 2
D. an invalid test for the slope of the regression line
E. no way to reduce the autocorrelation
16.6.6 Determine if a re-expression is appropriate.
7. Transformation (re-expression) is NOT done to make the
A. Relationship between x and y look better.
B. Distribution of a variable more symmetric.
C. spread of several groups more alike.
D. form of a scatterplot more nearly linear.
E. scatter in a scatterplot or residual plot spread out evenly rather than following a
fan shape.
16.7.6 Determine if a re-expression is appropriate.
8. Which of the following statements about the Ladder of Powers is true?
A. Moving further down the Ladder has a weaker effect on the data.
B. If you go too far, you cannot back up the Ladder of Powers
C. Will always change the direction of the relationship
D. Using the Ladder of Powers can improve an analysis of relationships
E. None of these is true.
16.3.3 Identify leveraged and/or influential points and determine if they affect the model.
9. A data point with a large, positive residual
A. Should always be removed from further analysis.
B. Is one that should be explored as a possible outlier.
C. Indicates that the regression model has provided an underestimate for the value.
D. B and C
E. All of these

16-18 Chapter 16 Understanding Residuals
16.2.1 Interpret or analyze linear models or relationships
10. A regression model that showed good fit was developed recently to predict average
annual pay for companies based on the percentage of female employees. Companies
included in the analysis had between 40% and 80% of employees who were female.
This model could safely be used to estimate average annual pay for companies
A. with ¾ of female employees.
B. owned and operated in the 18th century.
C. with 10% of female employees.
D. that will start up in the next 20 years.
E. regardless of the number of females or annual pay.

Quiz D 16-19
Chapter 16: Understanding Residuals – Quiz D – Key