OM5 C16
Test Bank
Chapter 16—Quality Control and SPC
Multiple Choice
1. In the 1:10:100 Rule, which of the following would be correct?
a.
If a defect or service error is identified and corrected at the design stage, it might cost $100 to
fix.
b.
If a defect or service error is identified and corrected at the production process stage, it might
cost $100 to fix.
c.
If a defect or service error is identified and corrected after it reaches the customer, it might
cost $100 to fix.
d.
If a defect or service error is identified and corrected at the design stage, it might cost $1 x
$10 x $100 = $1,000 to fix.
2. Quality at the source means that quality is controlled by _____.
a.
people responsible for the work
b.
quality control managers
c.
front line supervisors
d.
top management
3. Testing whether a computer boots up the first time is an example of _____.
a.
supplier certification and management
b.
in-process control
c.
finished-goods control
d.
a continuous metric
4. Evaluating the trade-offs between the costs of detection or replacement of a defective part and
costs of allowing a nonconformity to continue through the production process is related to _____.
a.
supplier certification and management
b.
in-process control
c.
finished-goods control
d.
a continuous metric
OM5 C16
Test Bank
5. Common causes of variation:
a. occur when 2 of 3 consecutive points on a statistical process control chart are above or below the
center line of the chart.
b. occur when adjusting a process that is already in control.
c. generally account for 80 to 95 percent of the observed variation in a process.
d. can be prevented, explained, and easily understood.
6. Which of the following statements is TRUE about common cause variations?
a. They can be controlled and described in a non-statistical method.
b. They appear at random, and individual sources cannot be identified or explained.
c. They account for about 10 to 15 percent of the observed variation in a process.
d. They arise from external sources that are not inherent in the process.
7. Common cause variation _____.
a. is controllable by employees (labor) only
b. is also called assignable cause variation
c. can be easily detected by statistical process control methods
d. can be reduced if training is provided by management
8. Common cause variation:
a.
is a natural part of the technology and process design and cannot be controlled.
b.
is easily detectable with statistical methods and control charts.
c.
cannot be reduced even if better technology, process design, or training is provided.
d.
can be reduced through corrective action, which is the responsibility of the workers
who run the processes.
9. Which of the following statements is NOT TRUE about special cause variations?
a.
They disrupt the random patterns of common cause variations.
b.
They arise from internal sources only.
c.
They appear sporadically.
d.
They are easily detectable using statistical methods.
10. If no special causes affect the output of a process, the process is said to be _____; and if special
causes are present, the process is said to be _____.
a.
qualified; not qualified
b.
in control; out of control
c.
capable; not capable
d.
certified; not certified
Problem A for Questions #11 to #13
A plastic cell phone case has been experiencing physical quality control problems. That is, the clear
screen does not always fit (and snap into place) on the case. The dimensions of the screen have
consistently been in statistical process control (SPC). A root cause quality initiative collected the
following data about the plastic cell phone case. Analyze the width of the cell phone case using
control charts and make a recommendation.
Table 1 Cell Phone Plastic Case Widths in Centimeters Data*
Sample 1
Sample 2
Sample 3
Sample 4
Sample 5
Sample 6
Sample 7
Observation
#1
6.02
5.92
5.88
5.99
6.05
5.94
6.00
#2
5.97
5.83
5.97
6.08
6.06
5.96
5.95
#3
5.90
5.87
5.88
6.08
5.98
5.99
5.82
Average
5.963
5.873
5.91
6.05
6.03
5.963
5.923
Range
0.12
0.09
0.09
0.09
0.08
0.05
0.18
*The sample averages and ranges helps in avoiding simple math errors and quickens the time to
complete the SPC analysis.
11. Using Table 1 for the R-chart, what is the value of UCLR?
a. Less than or equal to 0.2
b. Greater than 0.2 but less than or equal to 0.3
c. Greater than 0.3 but less than or equal to 0.4
d. Greater than 0.4
12. Using Table 1, for the X-chart, what is the value of UCLX?
a. Less than or equal to 3.0
b. Greater than 3.0 but less than or equal to 4.0
c. Greater than 4.0 but less than or equal to 5.0
d. Greater than 5.0
OM5 C16
Test Bank
13. Given the previous results and analysis for the R-chart, one would:
a. conclude that the R-chart is in statistical process control, and proceed to develop the x-bar chart.
b. conclude that the R-chart is not in statistical process control, and search for common causes of
the problem (i.e., the root cause).
c. conclude that the R-chart is not in statistical process control, and proceed to develop the x-bar
chart.
d. plot the sample means first to see if they are randomly distributed.
Problem B for Questions #14 to #16
Table 1 Statistical Process Control (SPC) Problem Data*
Sample
Observation
Number
Observation
Number
Observation
Number
Number
1
2
3
Row
Average
Row Range
1
10.1
10.6
9.6
10.1
1.00
2
9.7
9.4
9.0
9.37
0.70
3
10.1
9.1
10.3
9.83
1.20
4
10.1
10.3
10.9
10.43
0.80
5
10.2
9.8
9.0
9.67
1.20
6
10.6
10.2
9.5
10.10
1.10
7
9.5
10.2
10.2
9.97
0.70
*The range and row average help you avoid simple math errors and quicken the time to complete
the SPC analysis but you have to know what to use when.
14. Using Table 1, the sample values represent service times in minutes. For the R-chart, what is
the value of UCLR?
a. Less than or equal to 1.0
OM5 C16
Test Bank
b. Greater than 1.0 but less than or equal to 1.5
c. Greater than 1.5 but less than or equal to 2.0
d. Greater than 2.0 but less than or equal to 2.5
15. Using Table 1, for the R-chart, what is the value of LCLR?
a. Less than or equal to 1.0
b. Greater than 1.0 but less than or equal to 1.5
c. Greater than 1.5 but less than or equal to 2.0
d. Greater than 2.0
16. Given the previous results and analysis for the R-chart, one would:
a. conclude that the R-chart is in statistical control and proceed to develop the x-bar chart.
b. conclude that the R-chart is not in statistical control and proceed to develop the x-bar chart.
c. investigate sample # 3 as it is outside the R-chart control limits and redo the R-chart.
d. plot the x-bar sample means first to see if they are randomly distributed.
Problem C for Questions #17 to #19 (Students must compute the range per sample and overall r-
bar)
Table 1—SPC Problem Data
17. In Table 1, the sample values represent service times in minutes. For the R-chart, what is the
value of UCLR?
a. Less than or equal to 0.94
b. Greater than 0.94 but less than or equal to 0.99
c. Greater than 0.99 but less than or equal to 1.99
d. Greater than 1.99
OM5 C16
Test Bank
18. Using Table 1, for the R-chart, what is the value of LCLR?
a. Less than or equal to 0.01
b. Greater than 0.01 but less than or equal to 0.02
c. Greater than 0.02 but less than or equal to 0.03
d. Greater than 0.03
19. Given the previous results and analysis for the R-chart, one would:
a. conclude that the R-chart is in statistical control, and proceed to develop the x-bar chart.
b. conclude that the R-chart is not in statistical control, and proceed to develop the x-bar chart.
c. investigate sample # 3 as it is outside the R-chart control limits and redo the R-chart.
d. conclude that the variation is not random, and therefore all samples should be investigated.
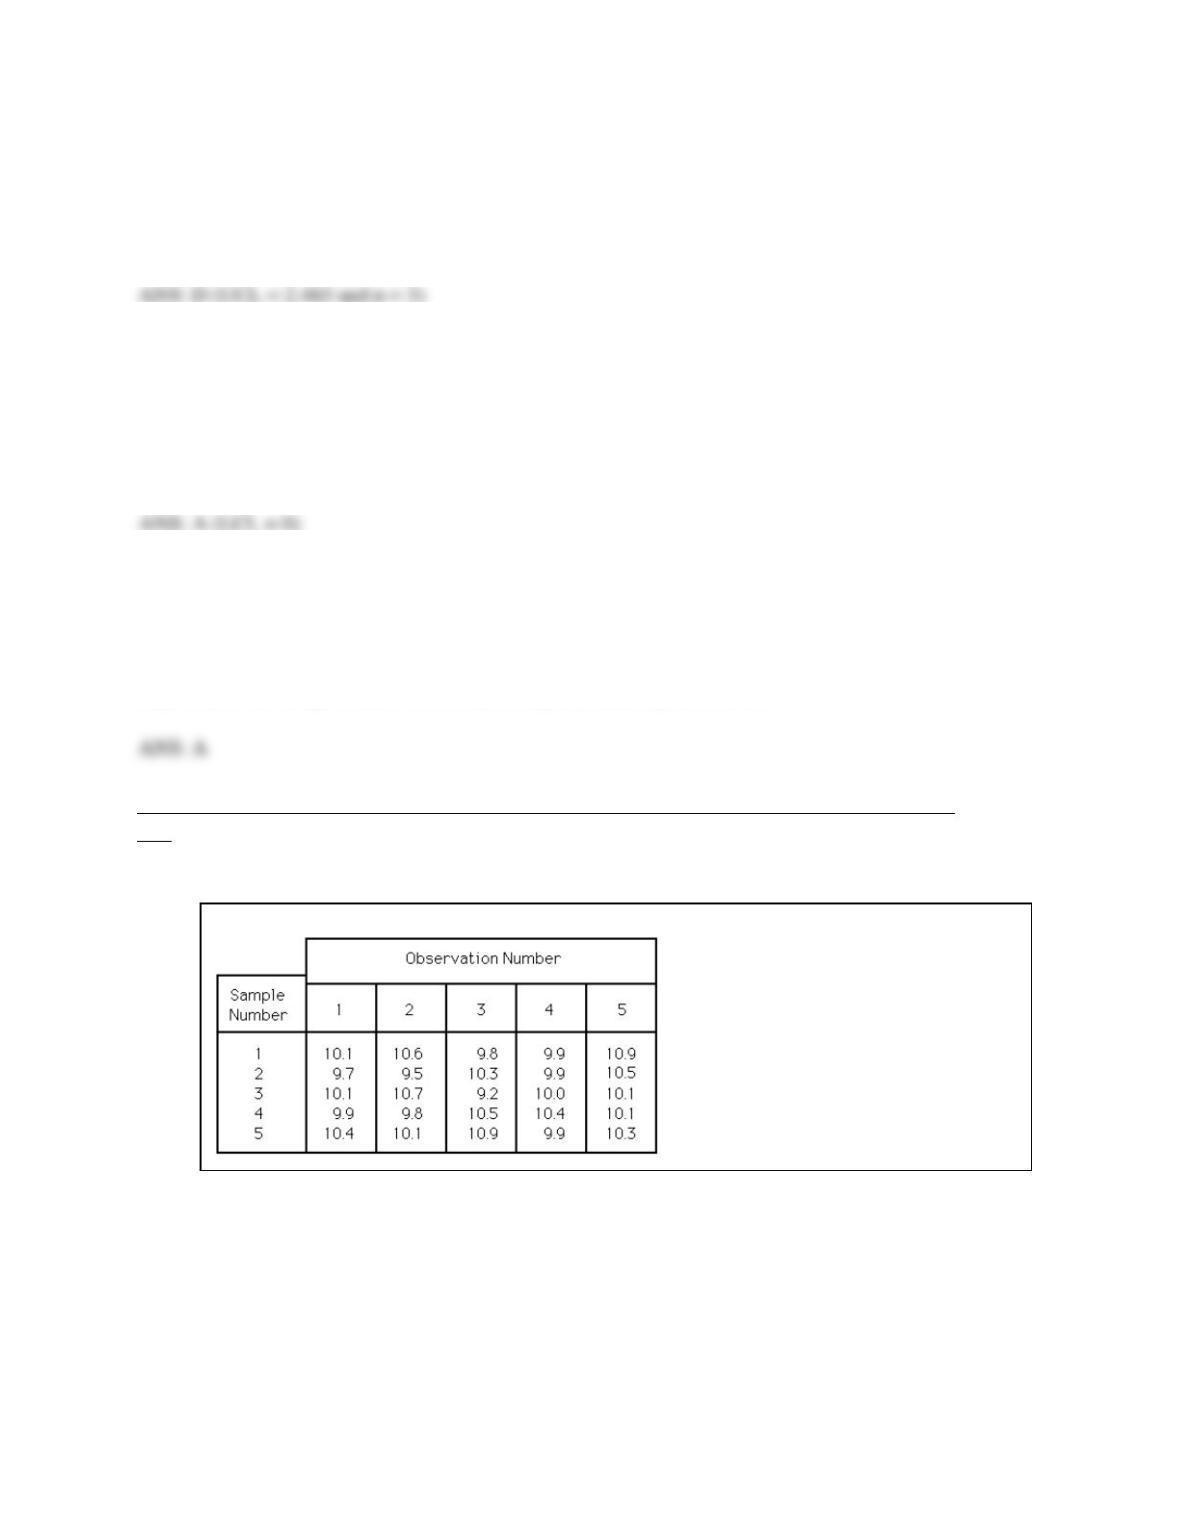
Problem D for Questions #21 to #23
A Proctor and Gamble factory process fills boxes with detergent. Construct an appropriate set of
control charts to monitor the process. Historical data for fill weight (in ounces) of eight samples is
presented below. A sample size of six was used.
Sample
Sample Mean
Sample Range
1
15.80
0.42
2
16.10
0.38
3
16.02
0.08
4
15.95
0.15
5
16.12
0.42
6
16.18
0.23
7
15.87
0.36
8
16.20
0.40
Worksheet (this will not be graded but will help you answer exam questions)
OM5 C16
20. For the Proctor and Gamble detergent box problem, the upper control limit for the range chart
is _____.
a. less than or equal to 0.6
b. more than 0.6 but less than or equal to 0.7
c. more than 0.7 but less than or equal to 0.8
d. more than 0.8
21. For the Proctor and Gamble detergent box problem, the lower control limit for the x-bar chart is
_____.
a. less than or equal to 12
b. more than 12 but less than or equal to 14
c. more than 14 but less than or equal to 16
d. more than 16
22. For the Proctor and Gamble detergent box problem, based on the control charts it can be said
that _____.

OM5 C16
Test Bank
a. both the R- and X-bar charts are not in statistical control
b. the R-chart is not in statistical control, but the X-bar chart is in statistical control
c. the R-chart is not in statistical control, but the X-bar chart is in statistical control, and therefore,
the process should be stopped and sources of error investigated
d. the R-chart is in statistical control, but the X-bar chart is not in statistical control, and therefore,
the process should be stopped and sources of error investigated
23. Identify the chart that is also known as fraction nonconforming or fraction defective chart.
a. A p-chart
b. A c-chart
c. An x-chart
d. An r-chart
24. The center line (p-bar) for a p-chart is 0.50 with an ULC = 0.65 and a LCL = 0.35. The results
of the next eight sample means are 0.45, 0.60, 0.39, 0.44, 0.48, 0.58, 0.54, and 0.64. Which of the
following is the best action to take?
a. Collect eight additional samples and then decide.
b. Wait and collect more data by increasing the sample size.
c. Investigate assignable causes because four observations are above the center line.
d. Investigate assignable causes because there is a bad trend (run).
25. The center line (p-bar) for a p-chart is 0.50 with an ULC = 0.70 and a LCL = 0.35. The results
of the next eight sample means are 0.45, 0.60, 0.39, 0.44, 0.48, 0.58, 0.54, and 0.64. Which of the
following actions should be taken in this scenario?
a. Nothing—the process is in control.
b. Investigate assignable causes because four observations are above the center line.
c. Investigate assignable causes because there is a bad trend (run).
d. Investigate assignable causes because four of the eight samples are below the center line.
26. Which of the following statements is TRUE?
a. Common cause variation arises from external sources that are not inherent in the process and is
where statistical quality control methods are most useful.
b. If the metric is discrete, a p- or c-chart is normally used.
c. Statistical process control is not used in hospitals due to the high liability costs.
OM5 C16
Test Bank
d. Statistical process control charts are most efficient when trying to monitor and control 5- and 6-
sigma quality levels.
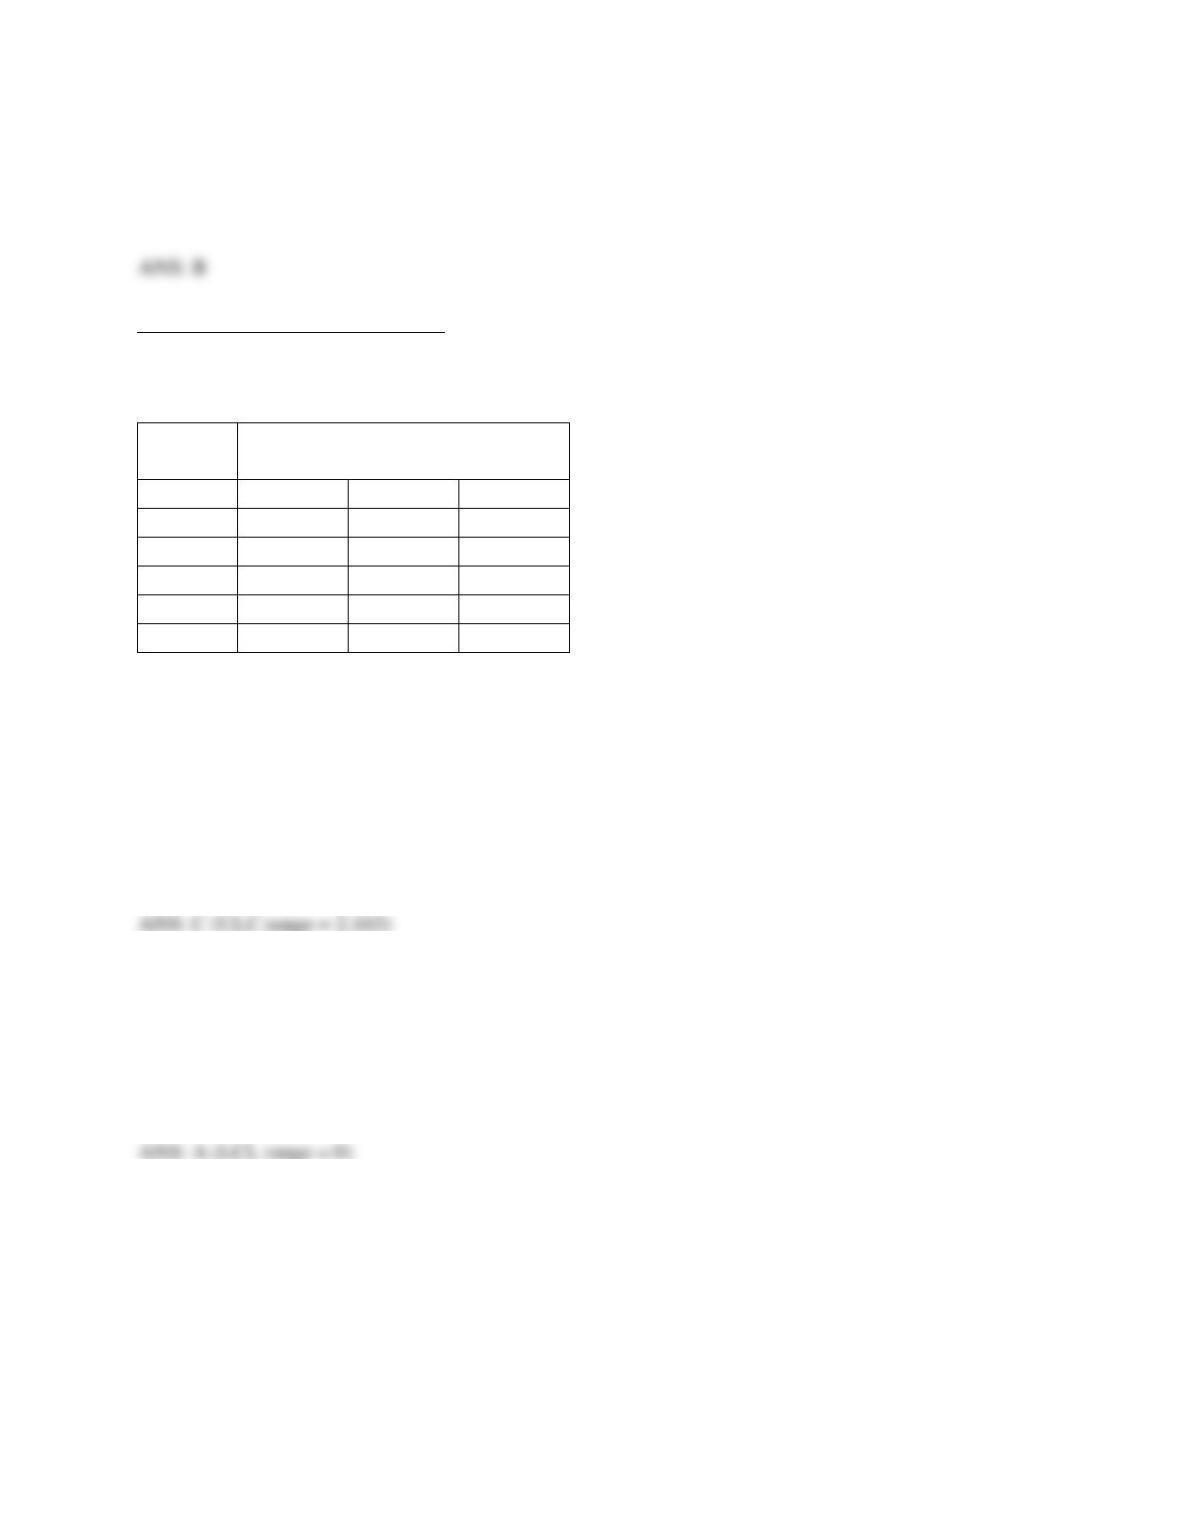
Problem D for Questions #27 to #29
Table 1—Statistical Process Control (SPC) Problem Data for Service Waiting Times
Sample
Number
Observation Number
1
2
3
1
9.6
10.2
9.8
2
9.4
10.0
10.4
3
9.9
9.6
9.0
4
9.3
10.5
9.9
5
9.7
9.2
9.7
27. In Table 1, the sample values represent service waiting times in minutes. For the R-chart, what
is the value of UCLR?
a. Less than or equal to 1.5
b. Greater than 1.5 but less than or equal to 2.0
c. Greater than 2.0 but less than or equal to 2.5
d. Greater than 2.5
28. Using Table 1, for the R-chart, what is the value of LCLR?
a. Less than or equal to 1.0
b. Greater than 1.0 but less than or equal to 1.5
c. Greater than 1.5 but less than or equal to 2.0
d. Greater than 2.0
29. Given the previous results and analysis for the R-chart regarding service waiting times, one
would:
a. conclude that the R-chart is in statistical control and proceed to develop the x-bar chart.
b. conclude that the R-chart is not in statistical control and proceed to develop the x-bar chart.
c. investigate sample # 3 as it is outside the R-chart control limits and redo the R-chart.
d. conclude that the variation is not random and the decreasing trend in the range should be
investigated.
OM5 C16
Test Bank
30. Honda wants to monitor the number of blemishes (scratches, blisters, etc.) on the fenders of its
cars using a statistical process control chart. The most appropriate type of statistical process control
(SPC) chart that can be used in this scenario is a(n) _____.
a.
x-bar chart
b.
R-chart
c.
Cpk chart
d.
c-chart
31. Which of the following is most closely related to a discrete metric?
a.
R-charts
b.
x-bar charts
c.
c-charts
d.
Process capability indices
32. Which is NOT related to a discrete metric?
a.
Counting
b.
Visual yes or no inspection
c.
Good or bad
d.
Time
33. Which of the following is NOT related to a continuous metric?
a.
Length
b.
x-bar and R-charts
c.
p-chart
d.
Time
34. Which of the following suggests a process that is NOT in control?
a.
Points follow a smooth pattern from the lower control limit to the upper control limit.
b.
The number of points above and below the center line is about the same.
c.
Points fall randomly above and below the center line.
OM5 C16
Test Bank
d.
No points are outside the control limits.
35. A p-chart _____.
a.
is used to monitor the proportion of nonconforming items
b.
counts the number of nonconformances per unit
c.
uses continuous metrics
d.
can have negative lower limits
36. A c-chart _____.
a.
is used for the fraction of nonconforming items
b.
is used to monitor the number of nonconformances per unit
c.
uses continuous metrics
d.
can have negative lower limits
37. To monitor the fraction of printed circuit boards that do not pass a functional test, a(n) _____ is
used.
a.
k-chart
b.
p-chart
c.
c-chart
d.
R-chart
38. If one was monitoring the average time to load a web page, the chart to use would be a(n)
_____.
a.
R- or x-bar chart
b.
sample-size chart
c.
p-chart
d.
c-chart
39. Indications in a control chart of an out-of-control situation include all of the following
EXCEPT:
a.
a shift in the average value.
OM5 C16
Test Bank
b.
the same number of points above and below the center line.
c.
points that lie outside upper and lower control limits.
d.
a cyclical pattern in the chart.
40. Given that 20 samples are taken in a control chart initiative, the probability that 5 consecutive
samples are below the center line in an R– or x-bar chart is _____.
a. 0.02500
b. 0.03125
c.
0.06250
d.
0.25000
41. Flaws are counted on a standard steel plate (sheet). Each sheet has the exact same dimensions.
If 10 sheets are selected at random and the number of flaws per sheet is as follows, determine the
lower and upper control limits.
Sheet
Number of Flaws
1
3
2
1
3
3
4
0
5
2
6
2
7
0
8
1
9
1
10
2
The upper control limit (UCL) for the steel plate control chart is _____.
a. less than 3
b. more than or equal to 3 but less than 4
c. more than or equal to 4 but less than 5
OM5 C16
Test Bank
d. more than or equal to 5 but less than 6
42. Historically, the average proportion of defective bars has been 0.015. Samples will be of 100
bars each. Construct a p-chart using
z=3
. Suppose a sample had 0.054 defectives. What would be
the best action to take in this scenario?
a. Nothing; it appears to be random variation.
b. Look for assignable causes.
c. Change z to 2 and take another sample.
d. Change z to 4 and continue sampling.
43. Historically, the average proportion of defective bars has been 0.015. Samples will be of 100
bars each. Construct a p-chart using
z=3
. Suppose a sample had 0.044 defectives. What would be
the best action to take in this scenario?
a. Nothing; it appears to be random variation.
b. Look for assignable causes.
c. Change z to 2 and take another sample.
d. Change z to 4 and continue sampling.
44. A supplier is producing a machined part for the transmission of a vehicle. The upper
specification limit is 0.125 cm, and the lower specification limit is 0.085. The process standard
deviation for the process that makes this part is 0.008, and the process average is 0.105. What
conclusion can be drawn from these process capability data?
a. The process is centered and capable.
b. The process is not centered and capable.
c. The process is centered and not capable.
d. The process is not centered and not capable.
45. The time to check out guests at a hotel front desk was measured over the course of several
weeks. Management believes that the target time for checking out guests should be between 2 and
3 minutes with a target of 2.5 minutes. The data gathered for the actual process had a mean time of
2.75 minutes with a standard deviation of 0.45 minutes. Find and interpret Cp, Cpl, Cpu, and Cpk
in the context of this situation. Which one of the following statements is TRUE?
a. The process is centered and not capable.
b. The process is centered and capable.
c. The process is not centered and capable.
OM5 C16
Test Bank
d. The process is not centered and not capable.
46. A bottling process sometimes results in overfills or underfills. Overfills are especially
damaging to the equipment. Which process capability index would this company most want to
monitor?
a.
Cp
b.
Cpl
c.
Cpu
d.
Cpk
47. The lower and upper specification limits for a component are 4.20 and 4.30 ounces,
respectively. The process standard deviation is .02, and the process average is 4.24 ounces. Which
one of the following statements is TRUE?
a.
The Cp index indicates the process is centered.
b.
The Cp index indicates the process is not centered.
c.
The Cpk index indicates the process is centered.
d.
The Cpk index indicates the process is not centered.
48. A supplier is producing a machined part for the transmission of a vehicle. The upper
specification limit is 0.135 cm, and the lower specification limit is 0.075. The process standard
deviation for the process that makes this part is 0.005, and the process average is 0.105. What
conclusion can be drawn from these process capability data?
a.
The process is centered and capable.
b.
The process is not centered and capable.
c.
The process is centered and not capable.
d.
The process is not centered and not capable.
True/False Questions
1. Quality at the source focuses on supplier quality at the beginning of a value chain.

OM5 C16
Test Bank
2. Quality control ensures that a good or service conforms to specifications and meets customer
requirements.
3. It generally costs more to correct an error or defect at the design stage than after it has reached
the customer.
4. A key element of a control system is the ability to measure performance and compare it to a
performance standard.
5. The 1:10:100 Rule supports the need for control and a focus on prevention by building quality at
the source.
6. In manufacturing, quality control is generally applied at the receiving stage from suppliers,
during various production processes, and at the finished-goods stage.
7. In-process quality control is typically performed by the employees who run the processes.
8. Quality control of front-office operations in services uses the same techniques that are applied in
manufacturing.
9. With good management, all variability of output from any goods- or service-producing process
can be eliminated.
10. Common causes of variations generally accounts for about 10 to 15 percent of the observed
variation within a process.
OM5 C16
Test Bank
11. Common causes of variation generally accounts for about 80 to 90 percent of the observed
variation within a process.
12. The goal of statistical process control (SPC) is to help identify and eliminate unwanted causes
of variation.
13. Poor quality that might result from a broken tool or an employee who is ill would be an
example of special cause variation.
14. A system governed only by common causes is called a stable system.
15. Special cause variation tends to be easily detectable using statistical methods.
16. A process is considered to be in control when all common and special cause variations have
been eliminated.
17. Over-adjusting a process that is in control will usually increase the variation in the output.
18. Collecting continuous data is usually easier than collecting discrete data.
19. In developing process control charts, if special causes are present, then they are not
representative of the true state of statistical control, and the calculations of the center line and
control limits will be biased.