
Monopolistic Competition 4021
70. Refer to Figure 16-4. Assume the firm in the figure is currently producing 20 units of output and
charging $925. The firm
a. will increase its profits if it raises its price and reduces its production level.
b. will increase its profits if it lowers its price and expands its production level.
c. is maximizing profits.
d. will increase its profits if it raises its prices and expands its production level.
71. Refer to Figure 16-4. The maximum total short-run economic profit for the monopolistically
competitive firm in this figure is
a. –$3,000.
b. $3,000.
c. $9,000.
d. $24,000.

4022 Monopolistic Competition
72. Refer to Figure 16-4. Which of the following will occur in the long run in this industry?
a. Firms will exit this industry.
b. Firms will enter this industry.
c. This firm will continue to earn positive economic profits.
d. This firm will incur losses.
Figure 16-5

Monopolistic Competition 4023
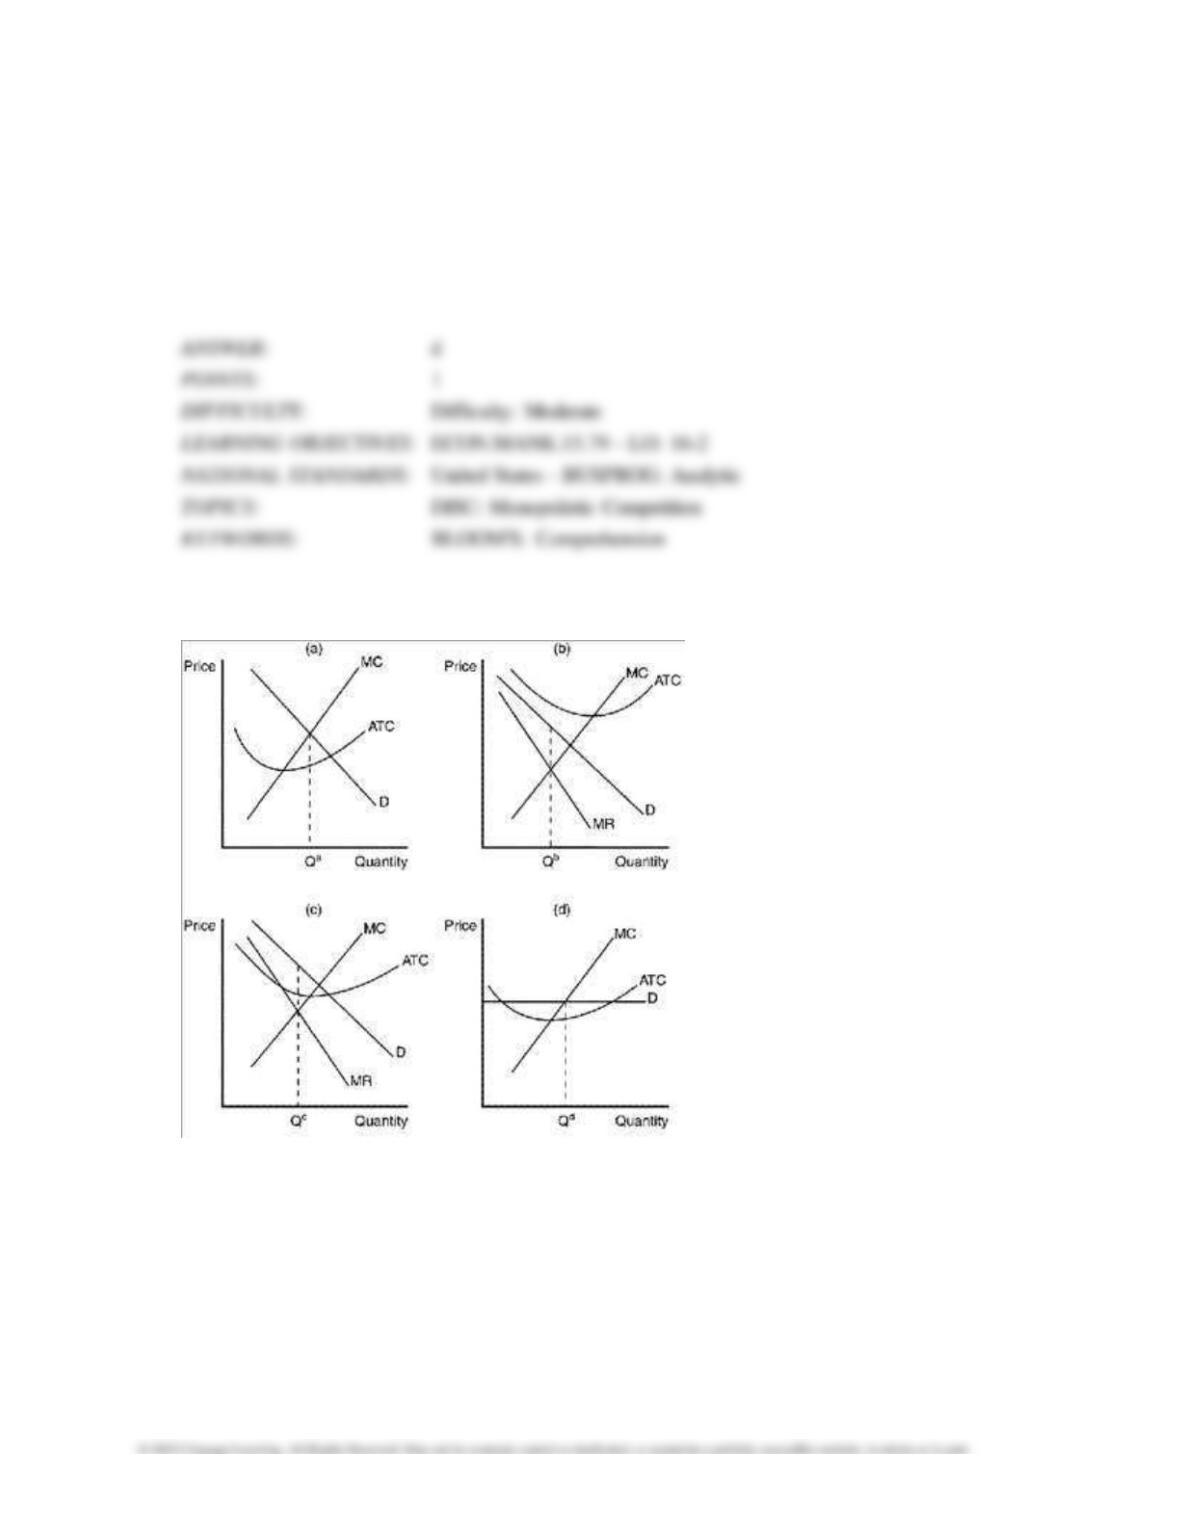
73. Refer to Figure 16-5. Which of the graphs depicts a short–run equilibrium that will encourage
the entry of other firms into a monopolistically competitive industry?
a. panel a
b. panel b
c. panel c
d. panel d
74. Refer to Figure 16-5. Which of the graphs depicts a short–run equilibrium that will encourage
the exit of some firms from a monopolistically competitive industry?
a. panel a
b. panel b
c. panel c
d. panel d
4024 Monopolistic Competition
75. Refer to Figure 16-5. Which of the graphs depicts a short-run equilibrium that will not
encourage either the entry or exit of firms in a monopolistically competitive industry?
a. panel a
b. panel b
c. panel c
d. panel d
76. Refer to Figure 16-5. Panel a shows a profit-maximizing monopolistically competitive firm that
is
a. earning zero economic profit.
b. likely to exit the market in the long run.
c. producing its efficient scale of output.
d. not maximizing its profit.
Monopolistic Competition 4025
77. Refer to Figure 16-5. Which of the panels depicts a firm in a monopolistically competitive
market earning positive economic profits?
a. panel a
b. panel b
c. panel c
d. panel d
78. Refer to Figure 16-5. Panel b is consistent with a firm in a monopolistically competitive market
that is
a. not in long–run equilibrium.
b. in long–run equilibrium.
c. producing its efficient scale of output.
d. earning a positive economic profit.
4026 Monopolistic Competition
79. Refer to Figure 16-5. Which of the panels shown could illustrate the short-run situation for a
monopolistically competitive firm?
a. panel a
b. panel b
c. panel c
d. All of the above are correct.
Figure 16-6
Monopolistic Competition 4027
80. Refer to Figure 16-6. Which of the graphs shown would be consistent with a profit maximizing
firm in a monopolistically competitive market that is earning a positive profit?
a. panel a
b. panel b
c. panel c
d. panel d
81. Refer to Figure 16-6. Which of the graphs shown would be consistent with a firm in a
monopolistically competitive market that is doing its best but still losing money?
a. panel a
b. panel b
c. panel c
d. panel d

4028 Monopolistic Competition
82. Refer to Figure 16-6. Which of the graphs depicts a monopolistically competitive firm in long–
run equilibrium?
a. panel a
b. panel b
c. panel c
d. None of the above is correct.
Figure 16-7
Monopolistic Competition 4029
83. Refer to Figure 16-7. Which of the graphs depicts the situation for a profit-maximizing firm in a
monopolistically competitive market?
a. panel a
b. panel b
c. panel c
d. panel d
84. Refer to Figure 16-7. Suppose a firm is operating in the situation depicted in panel a. Which of
the following statements is correct?
a. The firm is earning a positive short-run profit.
b. The firm is earning a negative short-run profit.
c. The firm is earning zero short-run profit.
d. We cannot determine profit because we do not know the firm’s average total cost.
4030 Monopolistic Competition
85. Refer to Figure 16-7. If a firm in a monopolistically competitive market was producing the level
of output depicted as Qd in panel (d), it would
a. not be maximizing its profit.
b. be minimizing its losses.
c. be losing market share to other firms in the market.
d. be operating at excess capacity.
86. Refer to Figure 16-7. The firm depicted in panel b faces a horizontal demand curve. If panel b
depicts a profit- maximizing firm,
a. it could be operating in either a perfectly competitive market or in a monopolistically
competitive market.
b. it would not have excess capacity in its production as long as it is earning zero economic profit.
c. it is able to choose the price at which it sells its product.
d. the firm can always raise its profit by increasing production since consumers will buy as much
as the firm can produce.
Monopolistic Competition 4031
Figure 16-8
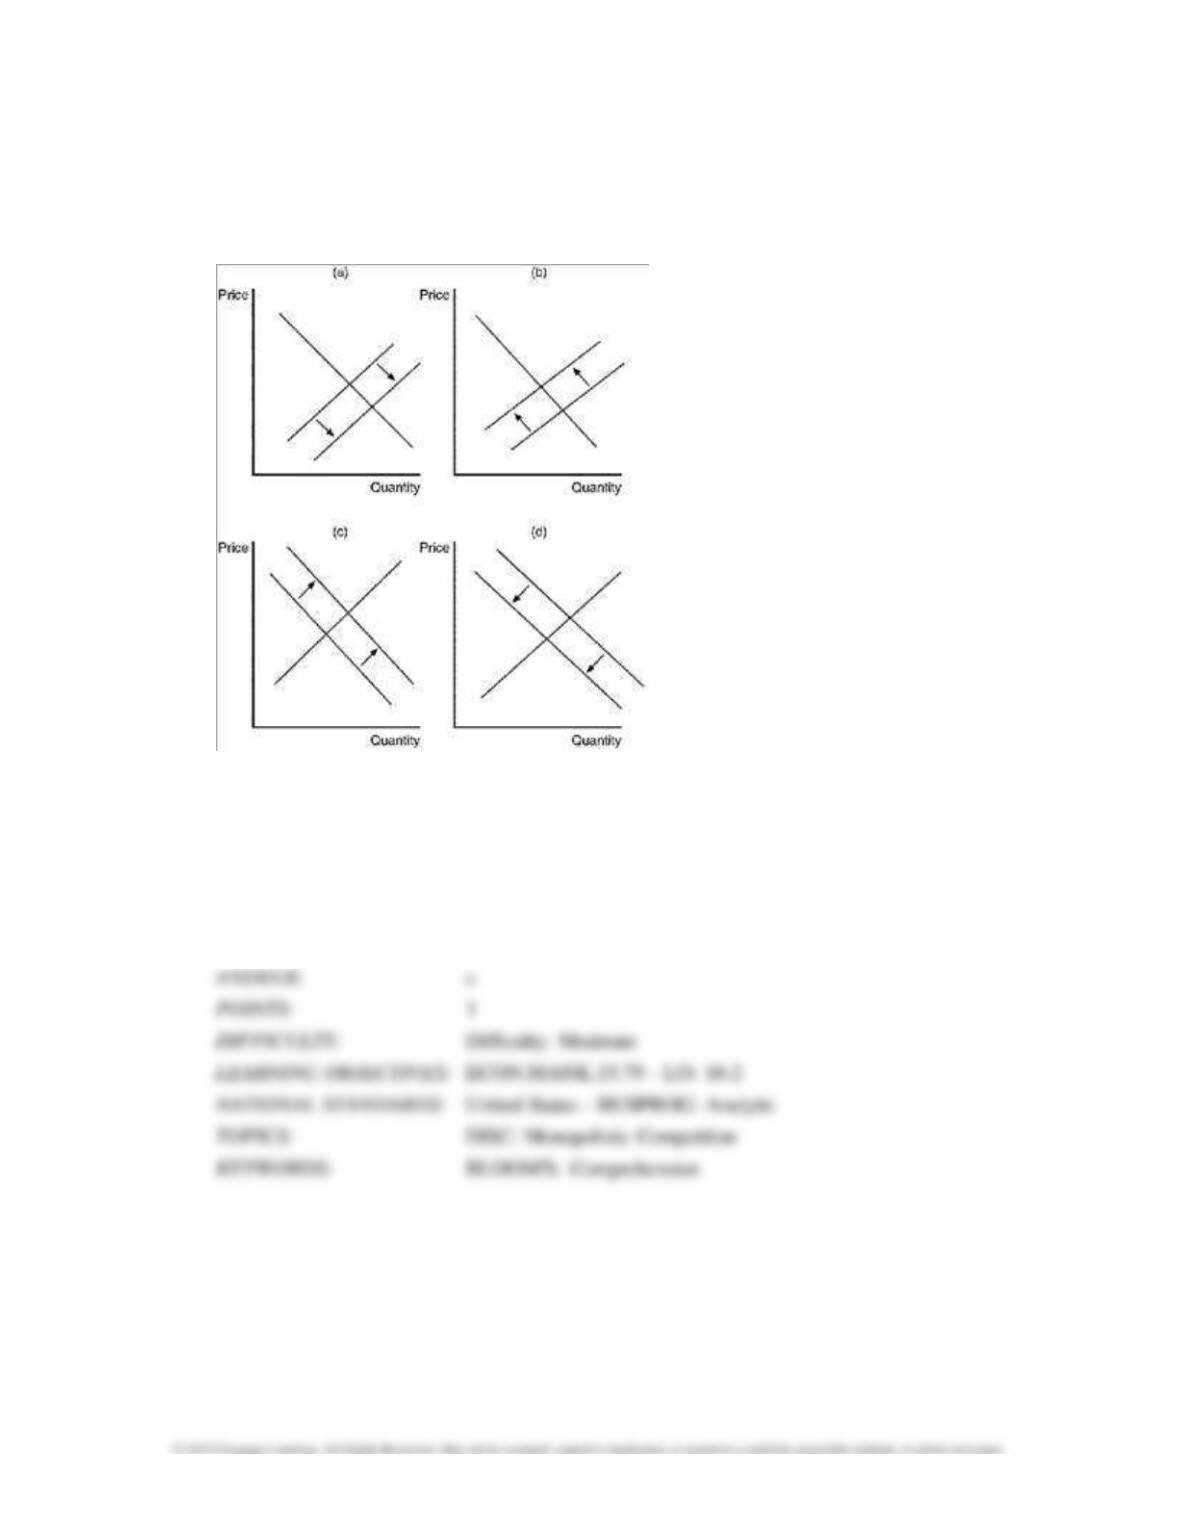
The lines in the figures below illustrate the potential effect of entry and exit in a monopolistically
competitive market on either the demand curve or the marginal cost curve of existing firms.
87. Refer to Figure 16-8. Panel (d) illustrates the change that would occur if existing firms faced
a. long-run economic losses.
b. a decrease in the diversity of products offered in the market.
c. new entrants in the market.
d. firms exiting the market.
4032 Monopolistic Competition
88. Refer to Figure 16-8. Which of the diagrams illustrates the impact of some existing firms
leaving the market?
a. panel a
b. panel b
c. panel c
d. panel d
Figure 16-9
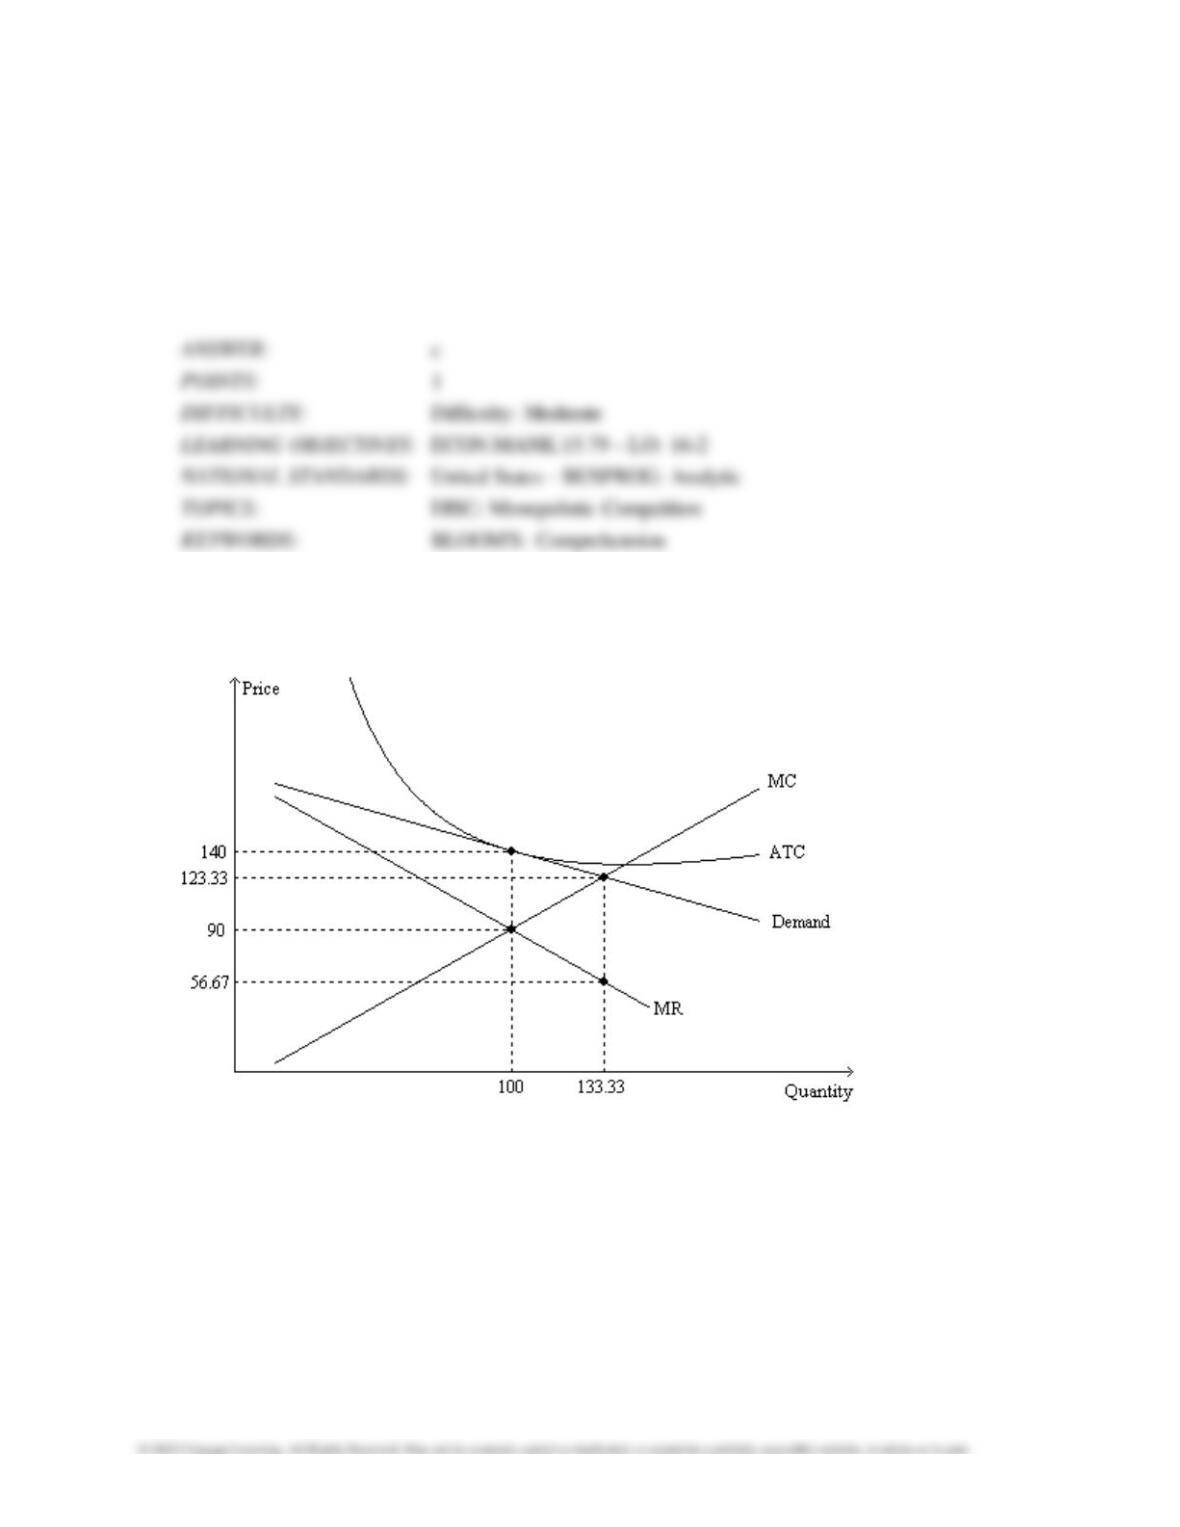
The figure is drawn for a monopolistically-competitive firm.
Monopolistic Competition 4033
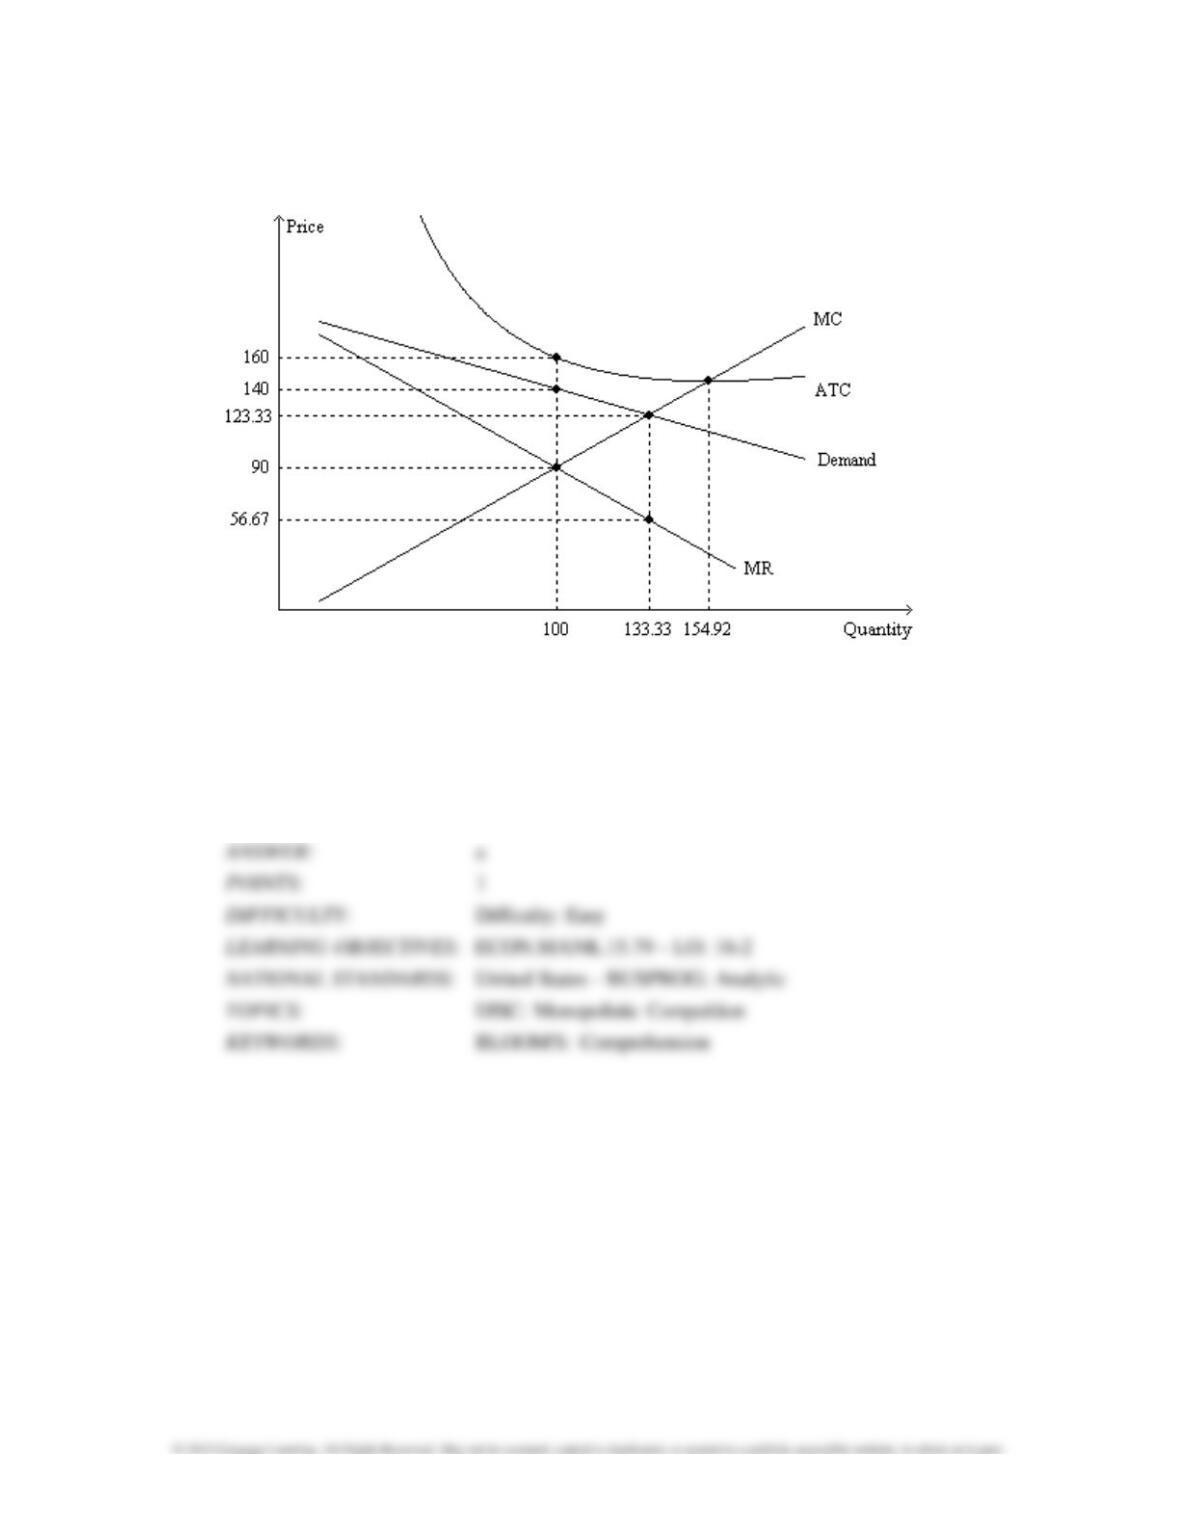
89. Refer to Figure 16-9. As the figure is drawn, the firm is in
a. a short-run equilibrium but it is not in a long–run equilibrium.
b. a long-run equilibrium but it is not in a short–run equilibrium.
c. a short–run equilibrium as well as a long–run equilibrium.
d. neither a short-run equilibrium nor a long–run equilibrium.
90. Refer to Figure 16-9. In order to maximize its profit, the firm will choose to produce
a. less than 100 units of output.
b. 100 units of output.
c. between 100 and 133.33 units of output.
d. more than 133.33 units of output.
91. Refer to Figure 16-9. In order to maximize its profit, the firm will choose to produce
a. 100 units of output, and its profit will be positive.
b. 100 units of output, and its profit will be zero.
c. 133.33 units of output, and its profit will be negative.
d. 133.33 units of output, and its profit will be zero.
4034 Monopolistic Competition
92. Refer to Figure 16-9. When the firm is maximizing its profit, the markup over marginal cost
amounts to
a. $16.67.
b. $33.33.
c. $50.00.
d. $66.66.
93. Refer to Figure 16-9. The firm’s maximum profit is
a. $-5,000.00.
b. $0.
c. $5,000.00.
d. $8,887.78.
Monopolistic Competition 4035
94. Refer to Figure 16-9. Efficient scale is reached
a. at 100 units.
b. between 100 and 133.33 units.
c. at 133.33 units.
d. beyond 133.33 units.
95. Refer to Figure 16-9. The quantity of output at which the MC and ATC curves cross is the
a. efficient scale of the firm.
b. short–run equilibrium quantity of output for the firm.
c. long-run equilibrium quantity of output for the firm.
d. All of the above are correct.
96. Refer to Figure 16-9. For this firm, the long–run equilibrium quantity of output is
a. 100 and the long-run equilibrium price is $90.
b. 100 and the long-run equilibrium price is $140.
c. 133.33 and the long-run equilibrium price is $56.67.
d. 133.33 and the long-run equilibrium price is $123.33.
4036 Monopolistic Competition
97. Refer to Figure 16-9. Given this firm’s cost curves, if the firm were perfectly competitive rather
than monopolistically competitive, then in a long–run equilibrium it would produce
a. less than 100 units of output.
b. between 100 and 133.33 units of output.
c. 133.33 units of output.
d. more than 133.33 units of output.
98. Refer to Figure 16-9. In response to the situation represented by the figure, we would expect
a. new firms to enter the market.
b. some of the firms that are currently in the market to exit.
c. this firm’s profit to move from its current value toward a positive value.
d. None of the above are correct.
Monopolistic Competition 4037
Figure 16–10
The figure is drawn for a monopolistically-competitive firm.
99. Refer to Figure 16–10. As the figure is drawn, the firm is in
a. a short-run equilibrium but it is not in a long–run equilibrium.
b. a long-run equilibrium but it is not in a short–run equilibrium.
c. a short–run equilibrium as well as a long–run equilibrium.
d. neither a short-run equilibrium nor a long–run equilibrium.
4038 Monopolistic Competition
100. Refer to Figure 16–10. In response to the situation represented by the figure, we would expect
a. some of the firms that are currently in the market to exit.
b. the demand for this firm’s product to increase, assuming this firm does not exit.
c. this firm’s profit to move from its current value toward zero.
d. All of the above are correct.
101. Refer to Figure 16–10. In order to maximize its profit, the firm will choose to produce
a. 100 units of output.
b. between 100 and 133.33 units of output.
c. 133.33 units of output.
d. 154.92 units of output.
102. Refer to Figure 16–10. In order to maximize its profit, the firm will choose to produce
a. 100 units of output, and its profit will be negative.
b. 100 units of output, and its profit will be zero.
c. 133.33 units of output, and its profit will be negative.
d. 133.33 units of output, and its profit will be zero.
Monopolistic Competition 4039
103. Refer to Figure 16-10. The firm’s maximum profit is
a. $–7,000.
b. $-5,000.
c. $–2,000.
d. The firm’s maximum profit cannot be determined from the figure.
104. Refer to Figure 16-10. When the firm is maximizing its profit,
a. TR = $9,000 and TC =$16,000.
b. TR = $14,000 and TC =$16,000.
c. TR = $16,000 and TC =$16,000.
d. MC exceeds MR by $66.66 on the last unit of output produced.

4040 Monopolistic Competition
105. Refer to Figure 16-10. At what quantity of output does average revenue exceed marginal
revenue by $66.66?
a. at 100 units of output
b. somewhere between 100 and 133.33 units of output
c. at 133.33 units of output
d. at 154.92 units of output
106. Refer to Figure 16–10. Efficient scale is reached
a. at 100 units.
b. at 133.33 units.
c. between 133.33 units and 154.92 units.
d. at 154.92 units.