Chapter 16: Cost-Volume-Profit Analysis
82. The following data pertain to the three products produced by Culdesac Corporation:
A
B
C
Selling price per unit
$5.00
$7.00
$6.00
Variable costs per unit
4.00
5.00
3.00
Contribution margin per unit
$1.00
$2.00
$3.00
Fixed costs are $90,000 per month.
60%of all units sold are Product A, 30 percent are Product B, and 10 percent are Product C.
What is the monthly break-even point for total units?
a. 60,000 units
b. 36,000 units
c. 45,000 units
d. 180,000 units
83. On a profit-volume graph, the profit line intersects the horizontal axis at
a. the origin.
b. the break-even point.
c. a volume of 1,000 units.
d. a point where profit is greater than zero.
84. In a cost-volume-profit graph,
a. the total revenue line crosses the horizontal axis at the break-even point.
b. beyond the break-even sales volume, profits are maximized at the sales volume where total revenues equal
total costs.
c. an increase in unit variable costs would decrease the slope of the total cost line.
d. an increase in the unit selling price would shift the break-even point in units to the left.
85. Which of the following statements is TRUE in a cost–volume-profit graph?
a. The slope of the total cost line is dependent on the variable cost per unit.
b. The total cost line normally begins at zero.
c. The total revenue line typically begins above zero.
d. The slope of the total revenue line is the contribution margin per unit.
Chapter 16: Cost-Volume-Profit Analysis
86. In a cost-volume-profit graph, the total revenue line rises with a slope equal to
a. the selling price.
b. the contribution margin.
c. the variable cost per unit.
d. none of the above.
87. In a cost-volume-profit graph, the slope of the total revenue line represents
a. the selling price per unit.
b. the contribution margin per unit.
c. the variable cost per unit.
d. total contribution margin.
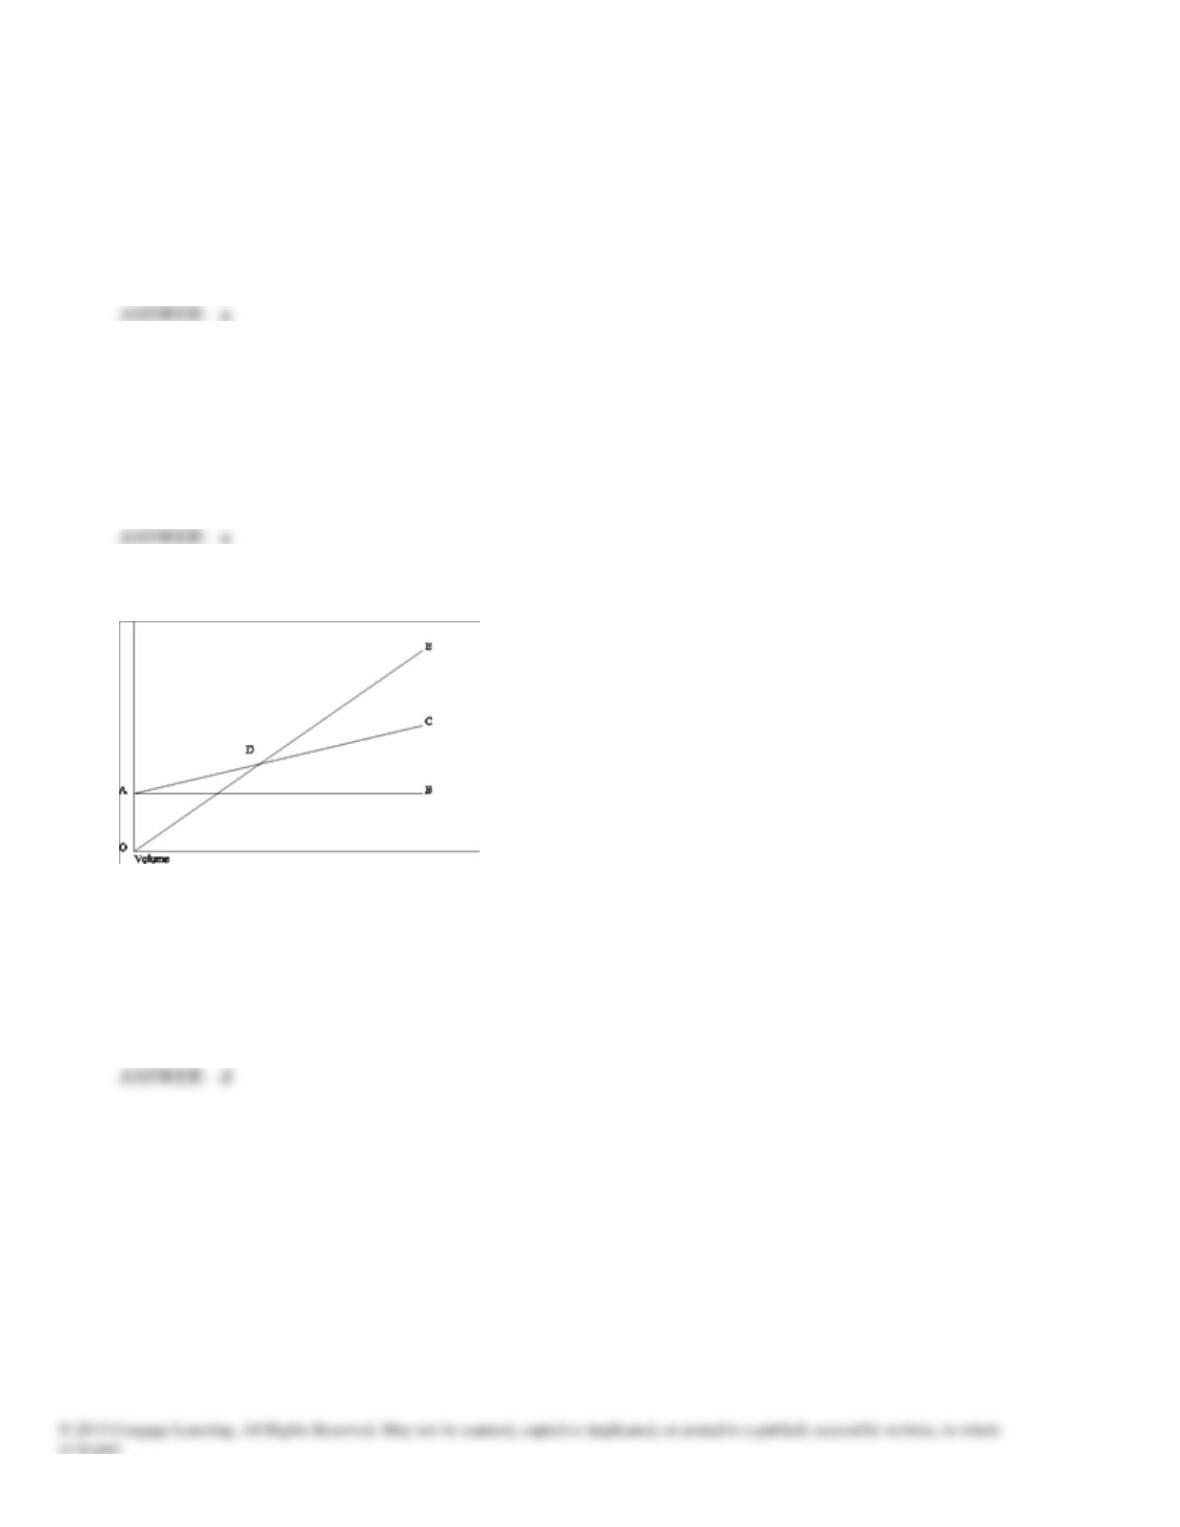
88. The following diagram is a cost-volume-profit graph for a manufacturing company:
Select the answer that best describes the labeled item on the diagram.
a. Area CDE represents the area of net loss.
b. Line AC graphs total fixed costs.
c. Point D represents the point at which the contribution margin per unit increases.
d. Line AC graphs total costs.
Chapter 16: Cost-Volume-Profit Analysis
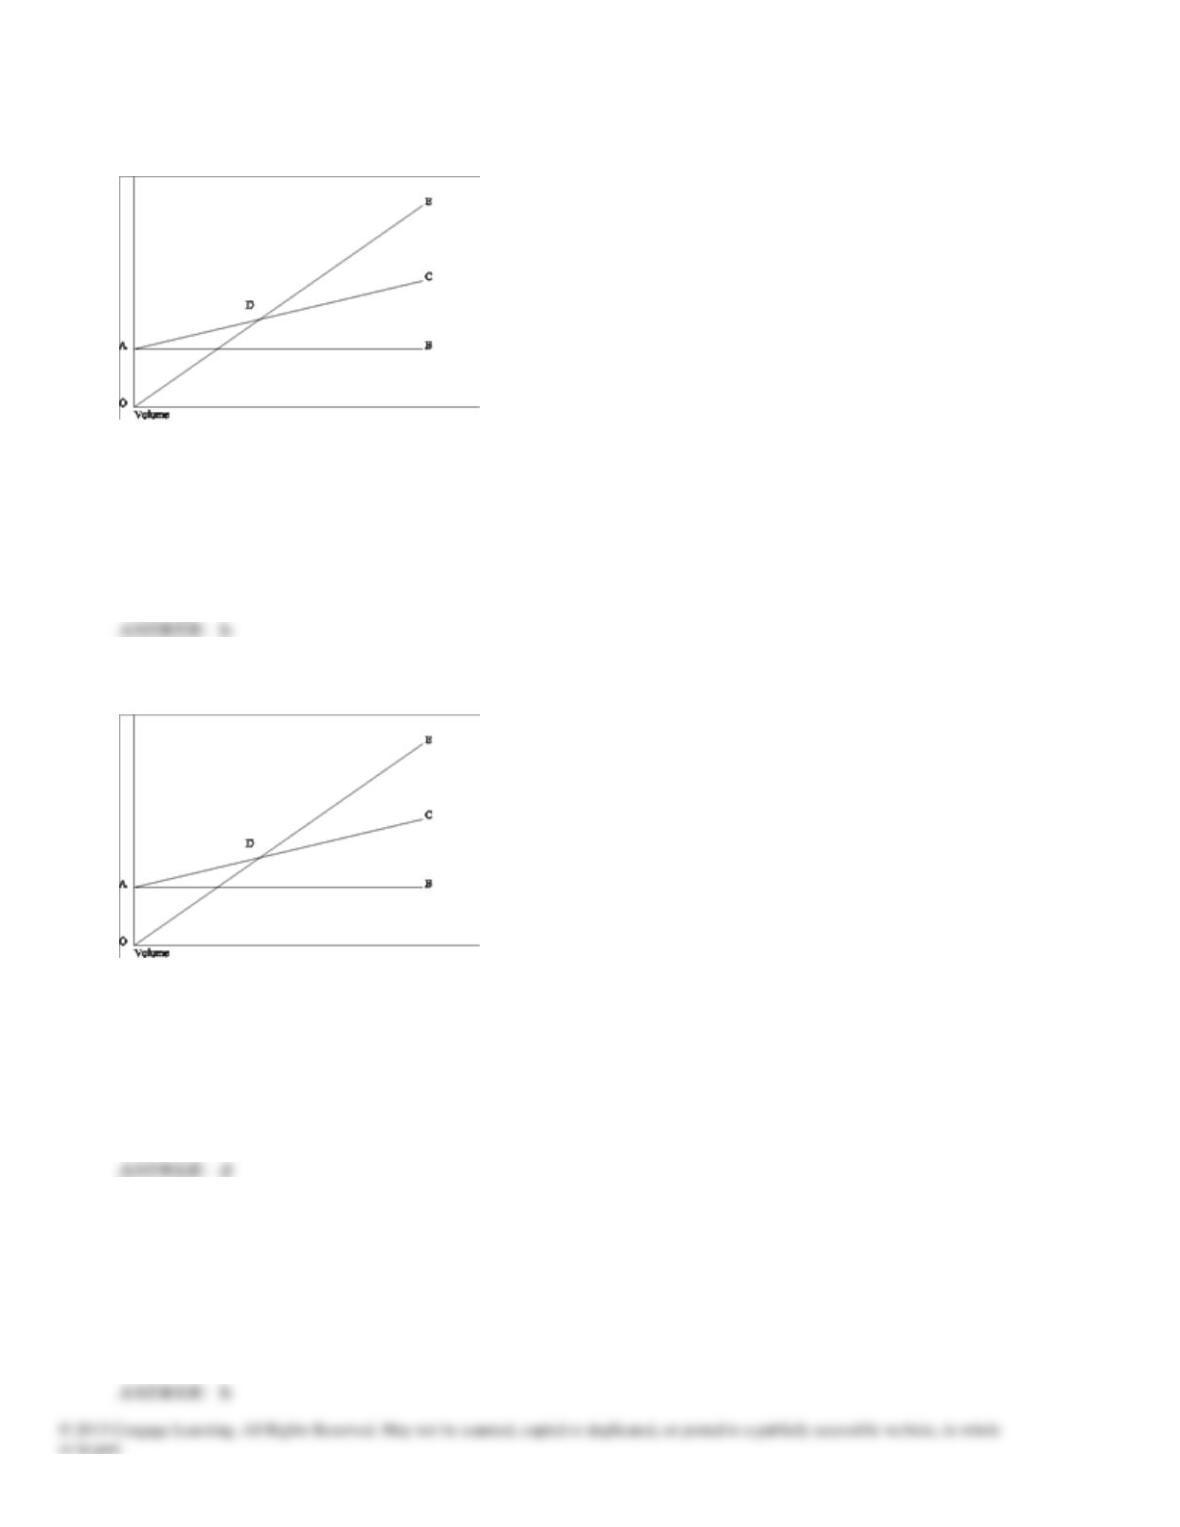
89. The following diagram is a cost-volume-profit graph for a manufacturing company:
The difference between line AB and line AC (area BAC) is the
a. contribution ratio.
b. total variable cost.
c. contribution margin per unit.
d. total fixed cost.
90. The following diagram is a cost-volume-profit graph for a manufacturing company:
The formula to determine the Y-axis value ($) at point D on the graph is
a. Fixed costs + (Variable costs per unit × Number of units).
b. ΣXY – bΣX.
c. Fixed costs/Unit contribution margin.
d. Fixed costs/Contribution margin ratio.
91. When a company sells more units than the break-even point,
a. it moves above the relevant range.
b. profits are positive.
c. there are no new variable costs incurred.
d. profits are negative.
Chapter 16: Cost-Volume-Profit Analysis
92. In a cost-volume-profit graph, the slope of the total cost line represents
a. the selling price per unit.
b. the contribution margin per unit.
c. the variable cost per unit.
d. total contribution margin.
93. On a profit-volume graph, the intersection of the profit line with the vertical axis provides a
a. profit of $1,000.
b. profit equal to zero.
c. profit equal to fixed costs.
d. loss equal to fixed costs.
94. A profit-volume graph
a. measures profit or loss on the horizontal axis.
b. illustrates total revenues, total cost, and profits at various sales volumes.
c. is not subject to the same limiting assumptions as cost-volume-profit graphs.
d. illustrates the relationship between volume and profits.
95. In a profit-volume graph, the slope of the profit line represents
a. the selling price per unit.
b. the contribution margin per unit.
c. the variable cost per unit.
d. total contribution margin.
96. Cost-volume-profit models assume that
a. the sales mix may vary among multiple products.
b. unit selling prices are constant.
c. inventories are dynamic and subject to change.
d. the total cost function is quadratic.
Chapter 16: Cost-Volume-Profit Analysis
97. Which of the following assumptions does NOT pertain to cost-profit-volume analysis?
a. Sales price per unit remains constant.
b. The sales mix is constant.
c. Inventories in a manufacturing entity may go up or down.
d. Fixed expenses are constant at all volumes of activities within the relevant range.
98. Which of the following assumptions does NOT pertain to cost-volume-profit analysis?
a. The units produced will equal the units sold.
b. Inventories are constant.
c. All costs are classified as fixed or variable.
d. Sales mix may vary during the related period.
99. Which of the following assumptions is NOT necessary for cost-volume-profit analysis?
a. total variable costs are linear
b. total revenues increase when total costs increase
c. inventories are constant
d. the product sales mix is constant
100. Assuming all other things are the same, if there was a decrease in the break-even point, selling price per unit must
have:
a. decreased
b. increased
c. remained the same
d. increased first, then decreased
101. Assuming all other things are equal, if there was a decrease in the break-even point, fixed costs must have:
a. decreased
b. increased first, then decreased
c. increased
d. remained the same
Chapter 16: Cost-Volume-Profit Analysis
102. The income statement for Symbiosis Manufacturing Company for 2016 is as follows:
Sales (10,000 units)
$120,000
Variable expenses
72,000
Contribution margin
$ 48,000
Fixed expenses
36,000
Operating income
$12,000
If sales increase by 1,000 units, what will happen to profit?
a. increase by $1,200
b. increase by $4,800
c. increase by $7,200
d. increase by $12,000
103. The income statement for Symbiosis Manufacturing Company for 2016 is as follows:
Sales (10,000 units)
$120,000
Variable expenses
72,000
Contribution margin
$ 48,000
Fixed expenses
36,000
Operating income
$12,000
If sales increase by $60,000, what will happen to profit?
a. increase by $60,000
b. increase by $36,000
c. increase by $6,000
d. increase by $24,000
104. Using cost-volume-profit analysis, we can conclude that a 20 percent reduction in variable costs will
a. reduce the break-even sales volume by 20 percent.
b. reduce total costs by 20 percent.
c. reduce the slope of the total cost line by 20 percent.
d. not affect the break-even sales volume if there is an offsetting 20 percent increase in fixed costs.
Chapter 16: Cost-Volume-Profit Analysis
105. Assuming all other things are the same, if there was an increase in the break-even point variable cost per unit must
have:
a. increased first, then decreased
b. increased
c. remained the same
d. depends on the circumstances
106. A decrease in the sales price in the basic cost-volume-profit model would
a. require a recomputation of the gross profit per unit.
b. be offset by an increase in unit costs.
c. decrease the break-even volume.
d. increase the break-even volume.
107. The DesMaris Company had the following income statement for the month of November 2016:
DesMaris Company
Income Statement
For the Month of November 2016
Sales ($60 × 10,000)
$600,000
Cost of goods sold:
Direct materials ($12 × 10,000)
$120,000
Direct labor ($9 × 10,000)
90,000
Variable factory overhead ($7.50 × 10,000)
75,000
Fixed factory overhead
120,000
405,000
Gross profit
$195,000
Selling and administrative expenses:
Variable ($1.50 × 10,000)
$15,000
Fixed
90,000
105,000
Operating income
$90,000
If the monthly sales volume increases by 450 units, DesMaris Company’s monthly profits will increase by
a. $13,500.00.
b. $1,282.50.
c. $9,450.00.
d. $14,175.00.
Chapter 16: Cost-Volume-Profit Analysis
108. Nonesuch Company sells only one product at a regular price of $7.50 per unit. Variable expenses are 60 percent of
sales and fixed expenses are $30,000. Management has decided to decrease the selling price to $6.00 in hopes of
increasing its volume of sales.
What sales dollar level is needed to obtain a before-tax profit of $60,000 when the selling price is $6.00 per unit?
a. $90,000
b.$120,00
c.$72,000
d.$360,000
109. Nonesuch Company sells only one product at a regular price of $7.50 per unit. Variable expenses are 60 percent of
sales and fixed expenses are $30,000. Management has decided to decrease the selling price to $6.00 in hopes of
increasing its volume of sales.
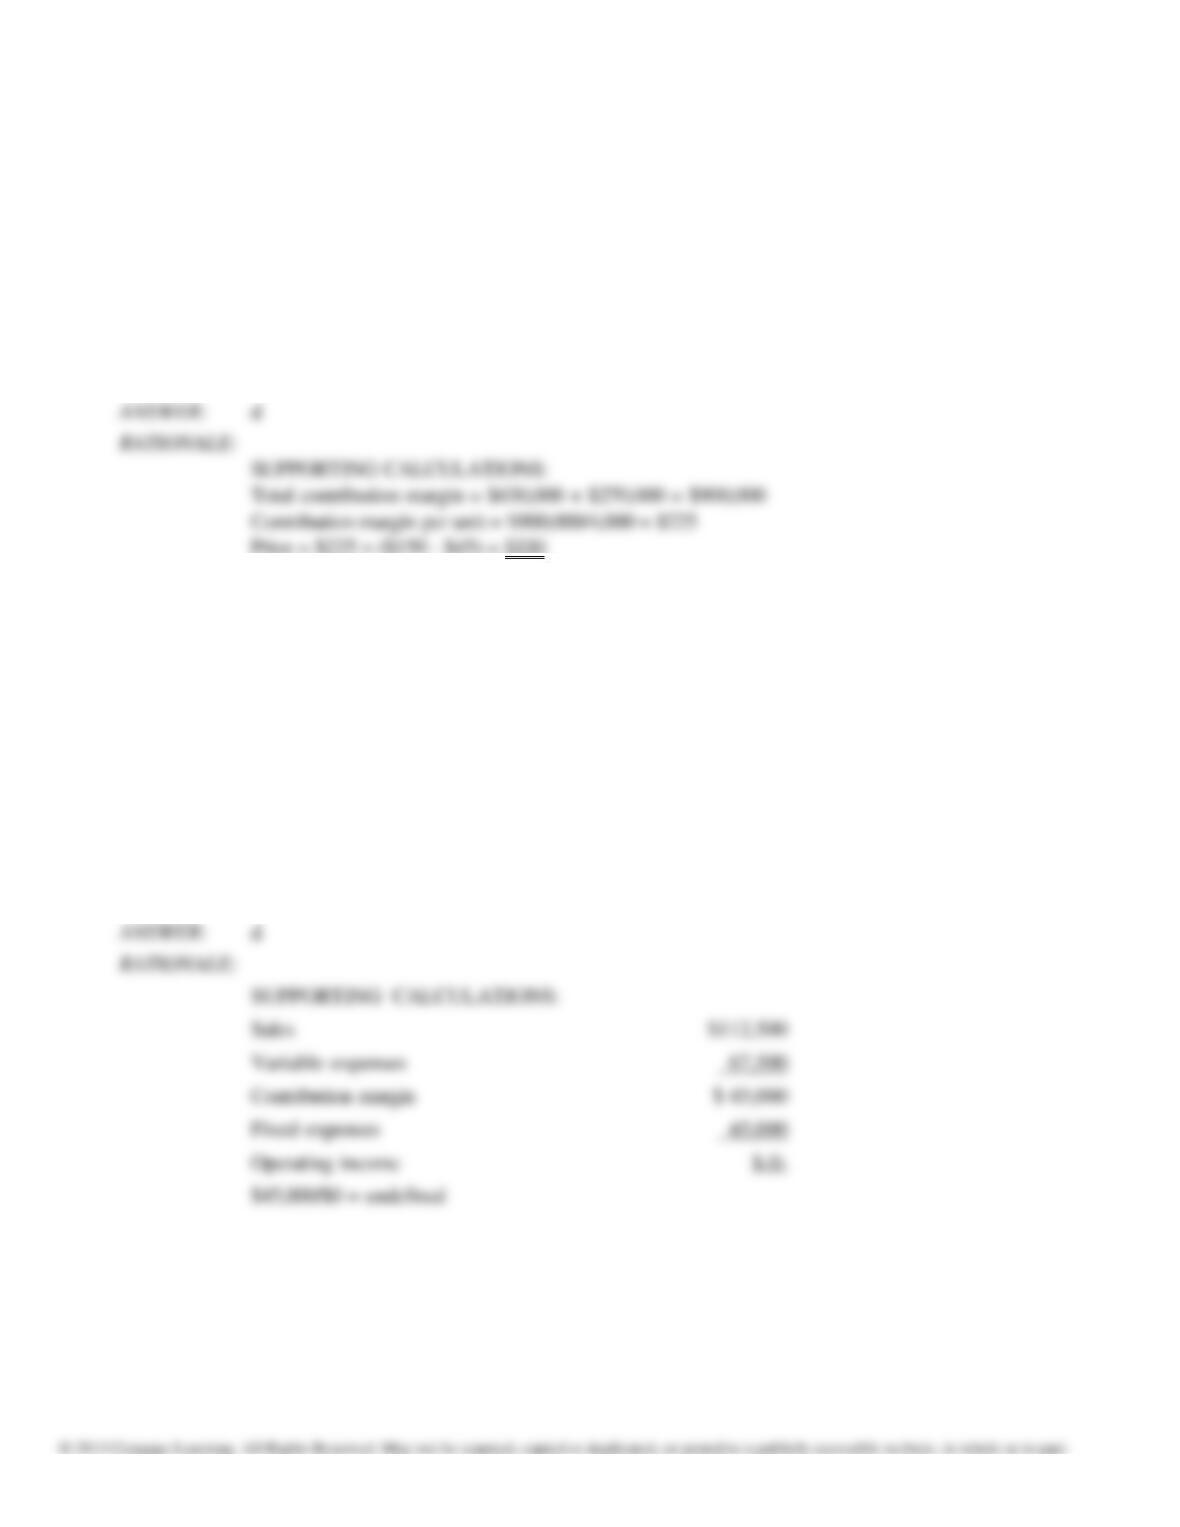
What is the new break-even point in units for Nonesuch Company when the selling price is $6.00?
a. 10,000 units
b. 20,000 units
c. 4,000 units
d. 6,667 units
Chapter 16: Cost-Volume-Profit Analysis
110. Jamie Quinn, a sole proprietor, has the following projected figures for next year:
Selling price per unit
$150.00
Contribution margin per unit
$45.00
Total fixed costs
$630,000
What selling price per unit is needed to obtain a before-tax profit of $270,000 at a volume of 4,000 units?
a. $150.00
b. $105.00
c. $225.00
d. $330.00
111. The Mildmanner Corporation has the following data for 2016:
Selling price per unit
$15
Variable cost per unit
$9
Fixed costs
$45,000
Units sold
10,000 units
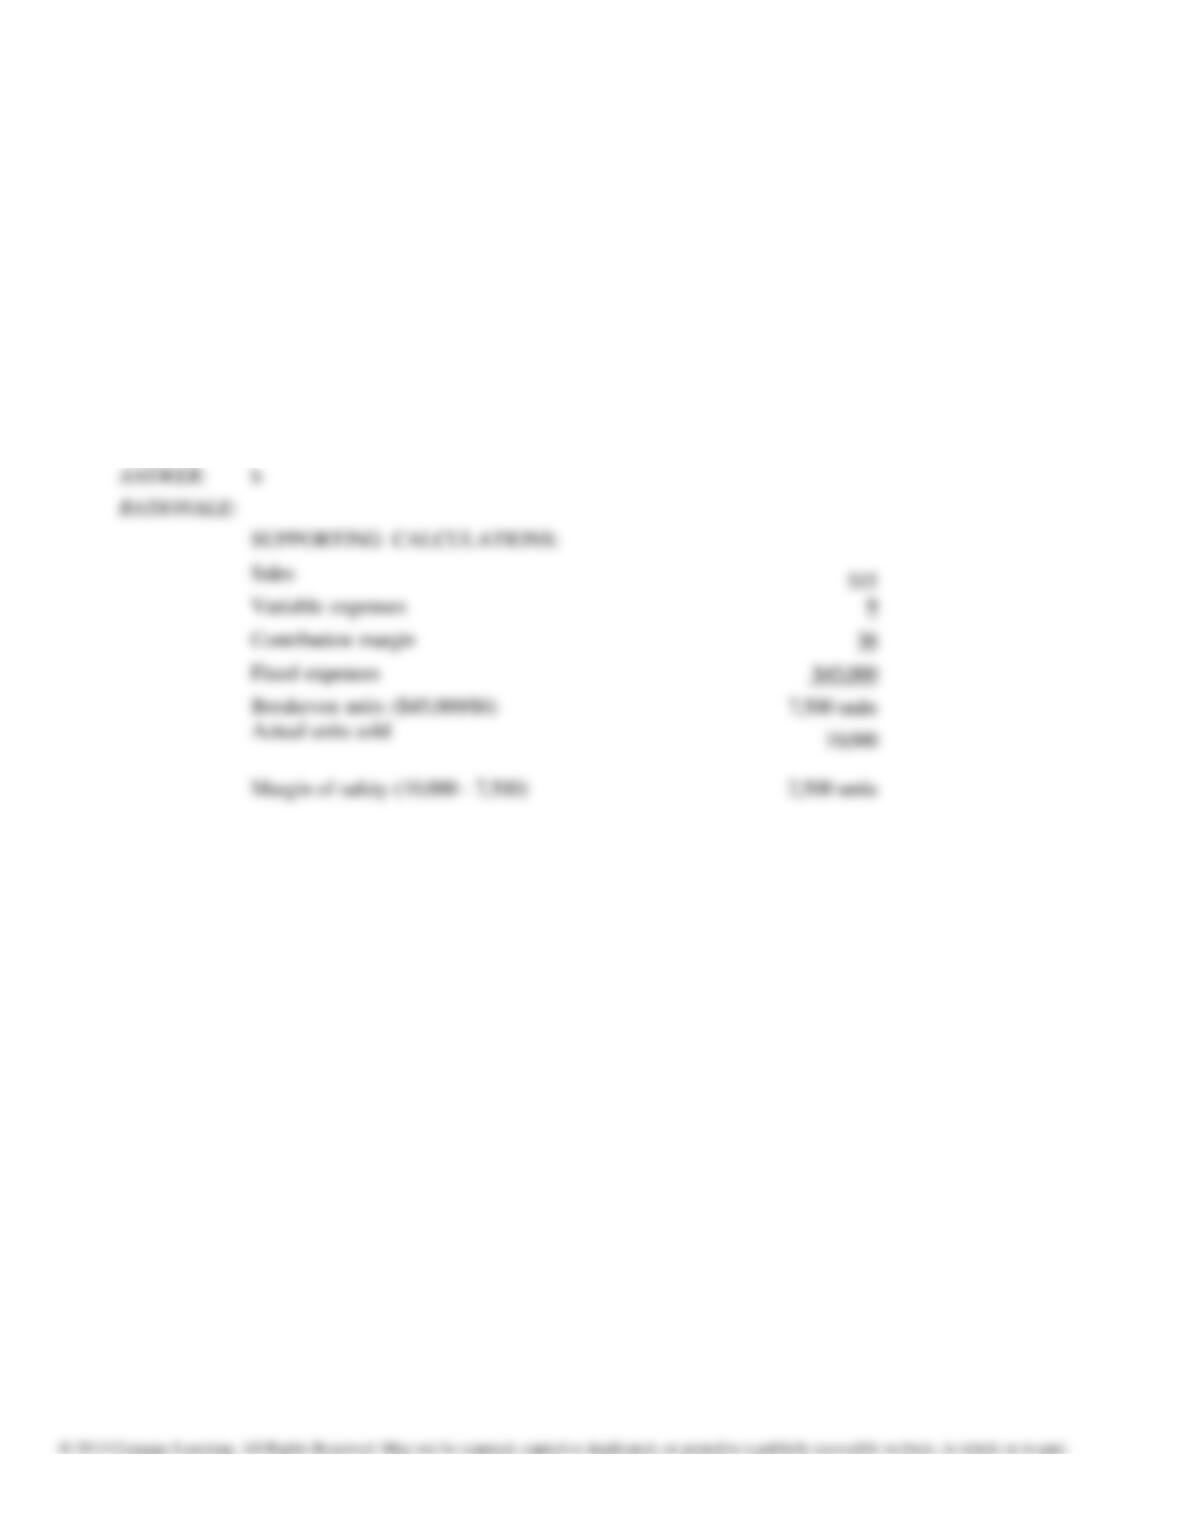
If sales decrease to 7,500 units in 2017, Mildmanner’s operating leverage will be
a. 0.25.
b. 2.00.
c. 4.00.
d. undefined.
Chapter 16: Cost-Volume-Profit Analysis
112. The Mildmanner Corporation has the following data for 2016:
Selling price per unit
$15
Variable cost per unit
$9
Fixed costs
$45,000
Units sold
10,000 units
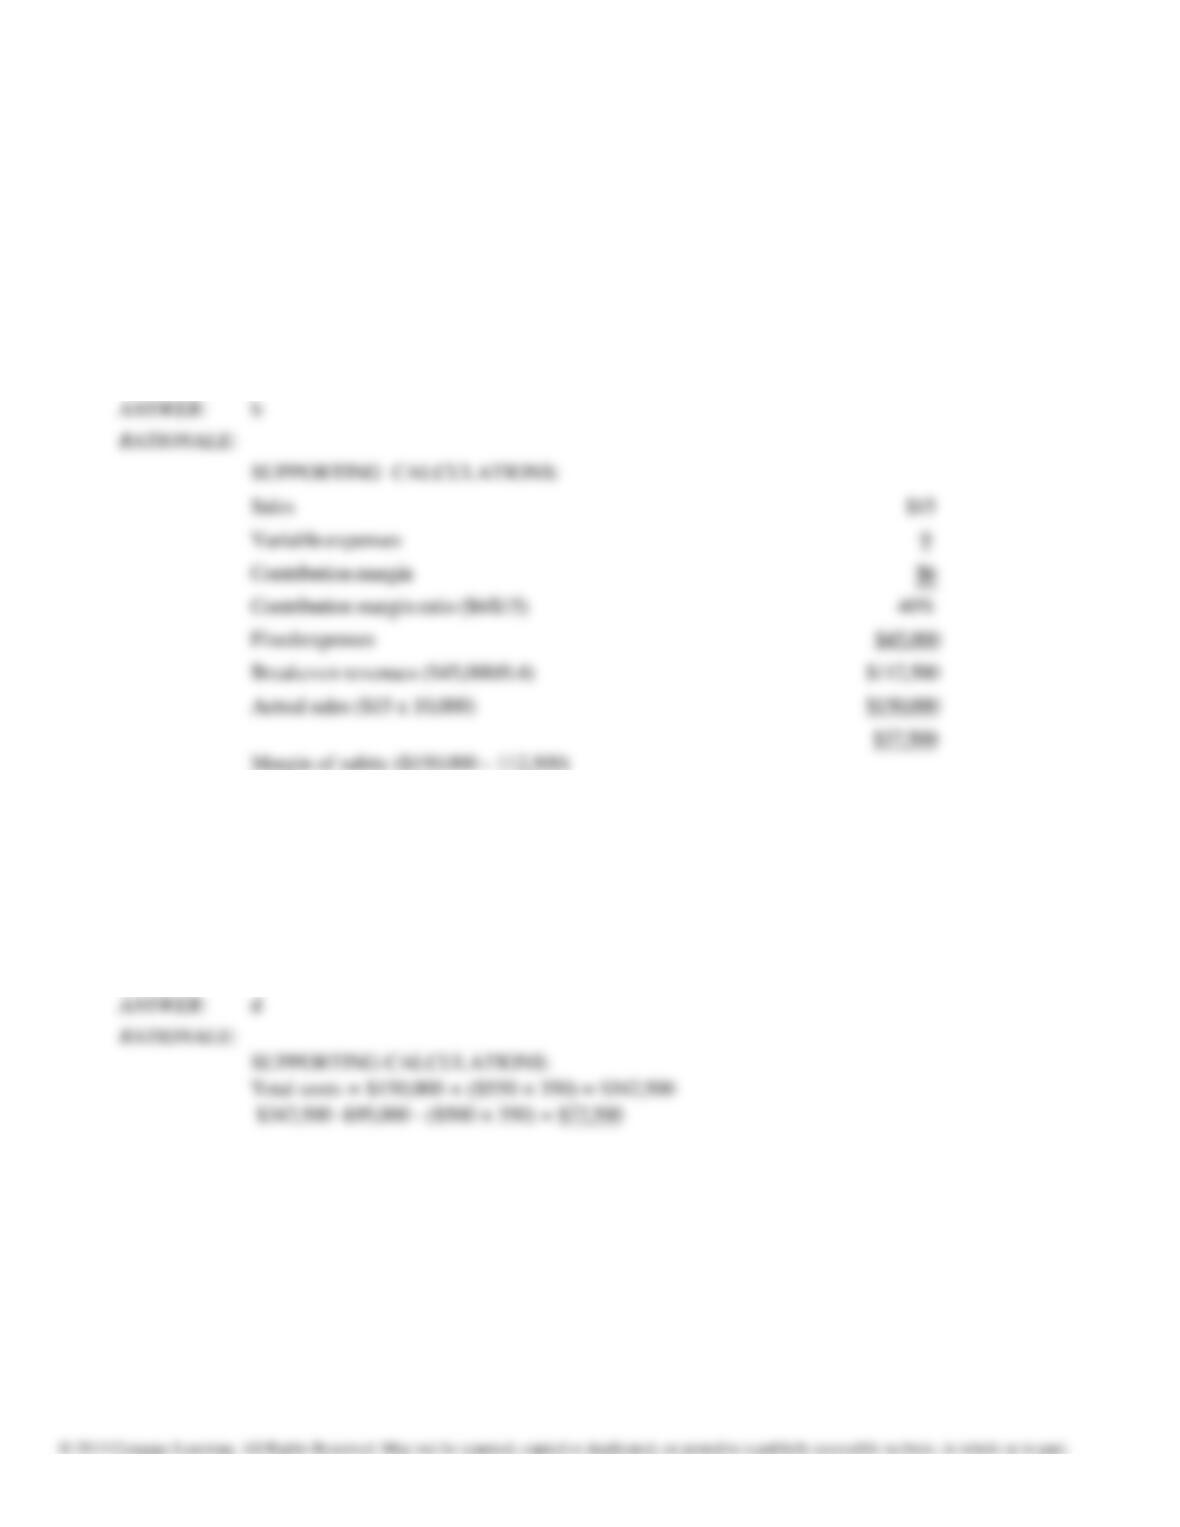
The margin of safety in units will be (round to the nearest whole unit)
a. 667.
b. 2,500.
c. 4,000.
d. 7,500.
Chapter 16: Cost-Volume-Profit Analysis
113. The Mildmanner Corporation has the following data for 2016:
Selling price per unit
$15
Variable cost per unit
$9
Fixed costs
$45,000
Units sold
10,000 units
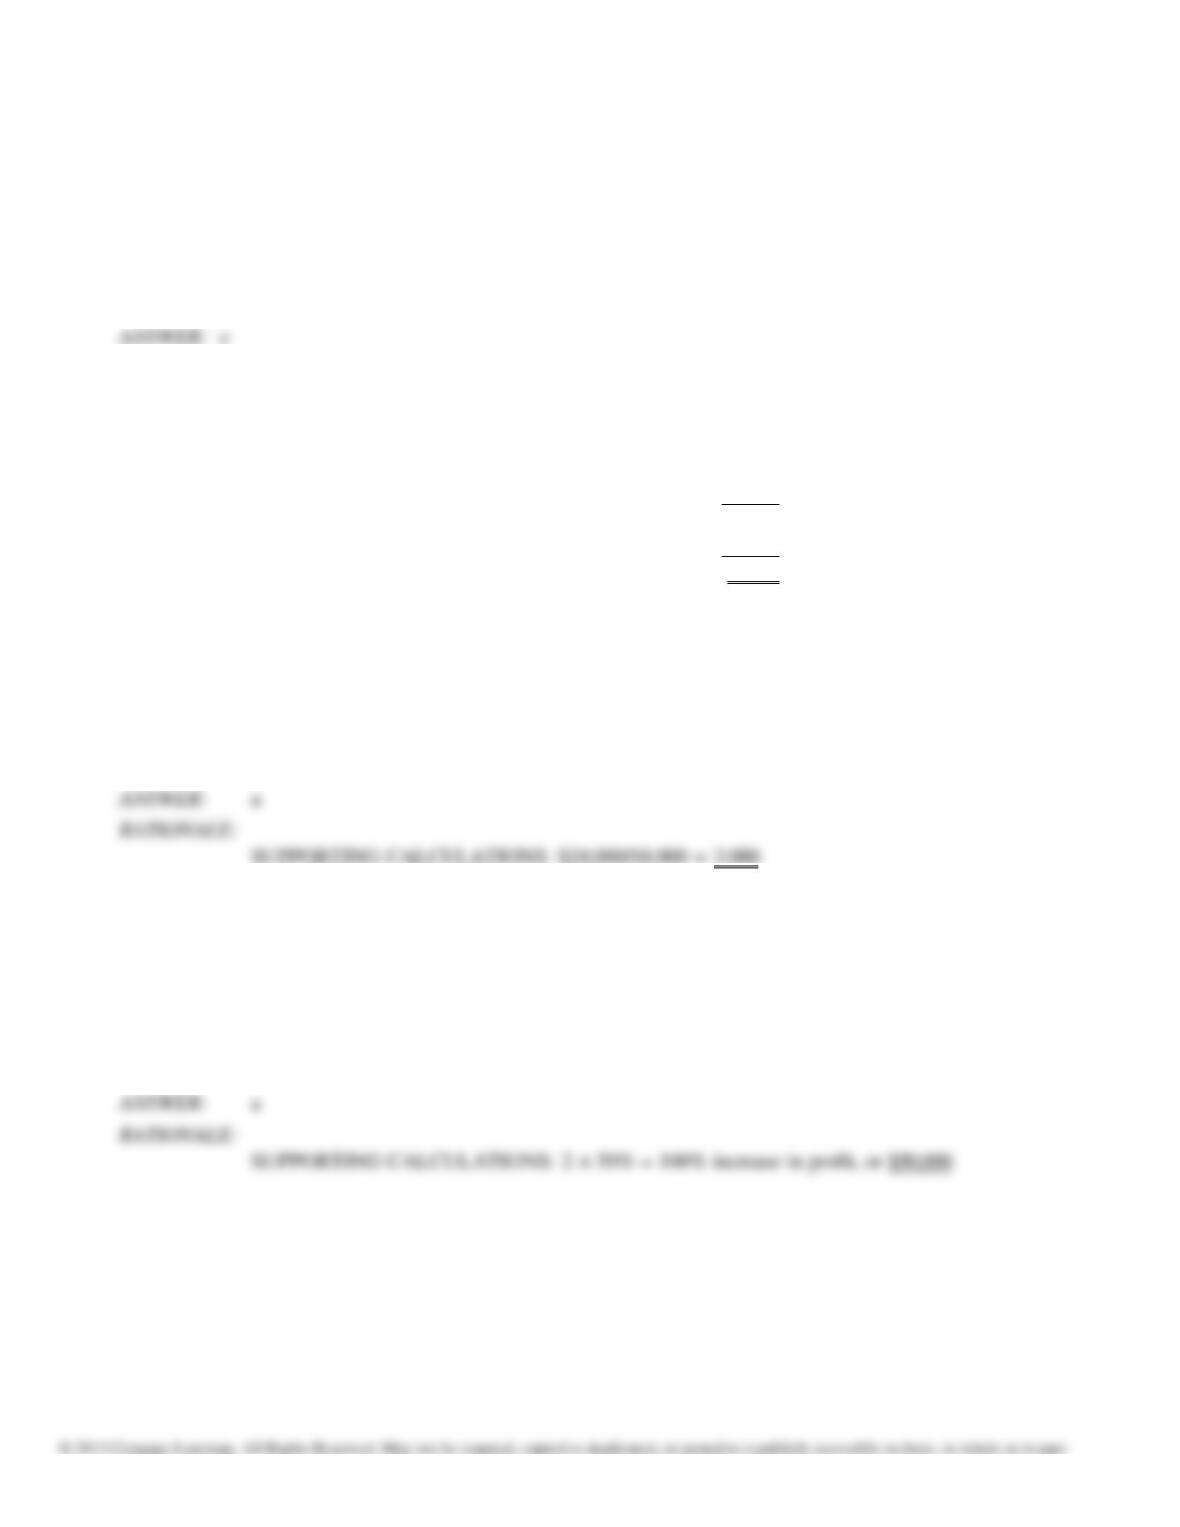
The margin of safety expressed in sales revenue will be
a. $75,000.
b. $37,500.
c. $45,000.
d. $112,500
114. Camp Funskies has annual fixed operating costs of $150,000 and variable costs of $550 per camper. Total fees
charged to campers amount to $500 each. The camp expects 350 campers next summer. Projected government
grants are $95,000. How much must Camp Funskies raise from other sources to break even?
a. $45,000
b. $37,500
c. $97,500
d. $72,500
Chapter 16: Cost-Volume-Profit Analysis
115. Assuming all other things are the same, if there was an increase in the break–even point, contribution margin per
unit must have:
a. remained the same
b. increased first, then decreased
c. decreased
d. increased
116. Julius Corporation had the following income statement for 2016:
Sales
$80,000
Variable expenses
56,000
Contribution margin
$24,000
Fixed expenses
16,000
Operating income
$8,000
What is the degree of operating leverage for Julius Corporation for 2016?
a. 3.000
b. 2.000
c. 0.333
d. 2.333
117. The Solemn Company has an operating leverage of 2. Sales for 2016 are $100,000 with a contribution margin of
$50,000. Sales are expected to be $150,000 in 2017. Operating income for 2017 can be expected to increase by
what amount over 2016?
a. $50,000
b. $25,000
c. 200%
d. 40%
Chapter 16: Cost-Volume-Profit Analysis
118. Cain Company and Abel Corporation have the following income statements for 2016:
Cain Company
Abel Corporation
Sales
$50,000
$50,000
Variable expenses
10,000
25,000
Contribution margin
$40,000
$25,000
Fixed expenses
25,000
10,000
Operating income
$15,000
$15,000
What is the degree of operating leverage for Cain Company for 2016?
a. 2.667
b. 0.375
c. 1.667
d. 1.250
119. The margin of safety is
a. the number of units that need to be sold to achieve a profit target.
b. the amount of units expected to be sold above the break-even level.
c. the sales dollars needed to cover fixed costs.
d. the use of fixed costs to extract higher percentage changes in profits as sales volume changes.
120. A very high degree of operating leverage indicates a firm
a. has high fixed costs.
b. has a high net income.
c. has high variable costs.
d. is operating close to its break-even point.