Monopolistic Competition 3981
83. Of the following market structures, which are considered imperfectly competitive?
I. Perfect competition
II. Monopoly
III. Monopolistic competition
IV. Oligopoly
a. III only
b. II and III
c. III and IV
d. II, III, and IV
84. Which market structure would likely have the highest concentration ratio?
a. Monopoly
b. Oligopoly
c. Monopolistic competition
d. Perfect competition
3982 Monopolistic Competition
85. Which of the following market structures is considered a differentiated products market?
a. Perfect competition
b. Monopolistic competition
c. Monopoly
d. Both a and b are differentiated products markets.
86. In perfect competition as well as in monopolistic competition,
a. marginal revenue is equal to price for each firm.
b. profit is positive in a long–run equilibrium for each firm.
c. entry and exit by firms are restricted.
d. there are many firms in a single market.
87. In monopolistic competition as well as in monopoly,
a. price exceeds marginal revenue for each firm.
b. profit is zero in a long–run equilibrium for each firm.
c. entry and exit by firms are unrestricted.
d. there are at most a few firms in each market.
Monopolistic Competition 3983
88. Which of the following is most likely sold in a monopolistically competitive market?
a. sports drinks
b. cable TV programming
c. a share of McDonald’s stock
d. sunglasses
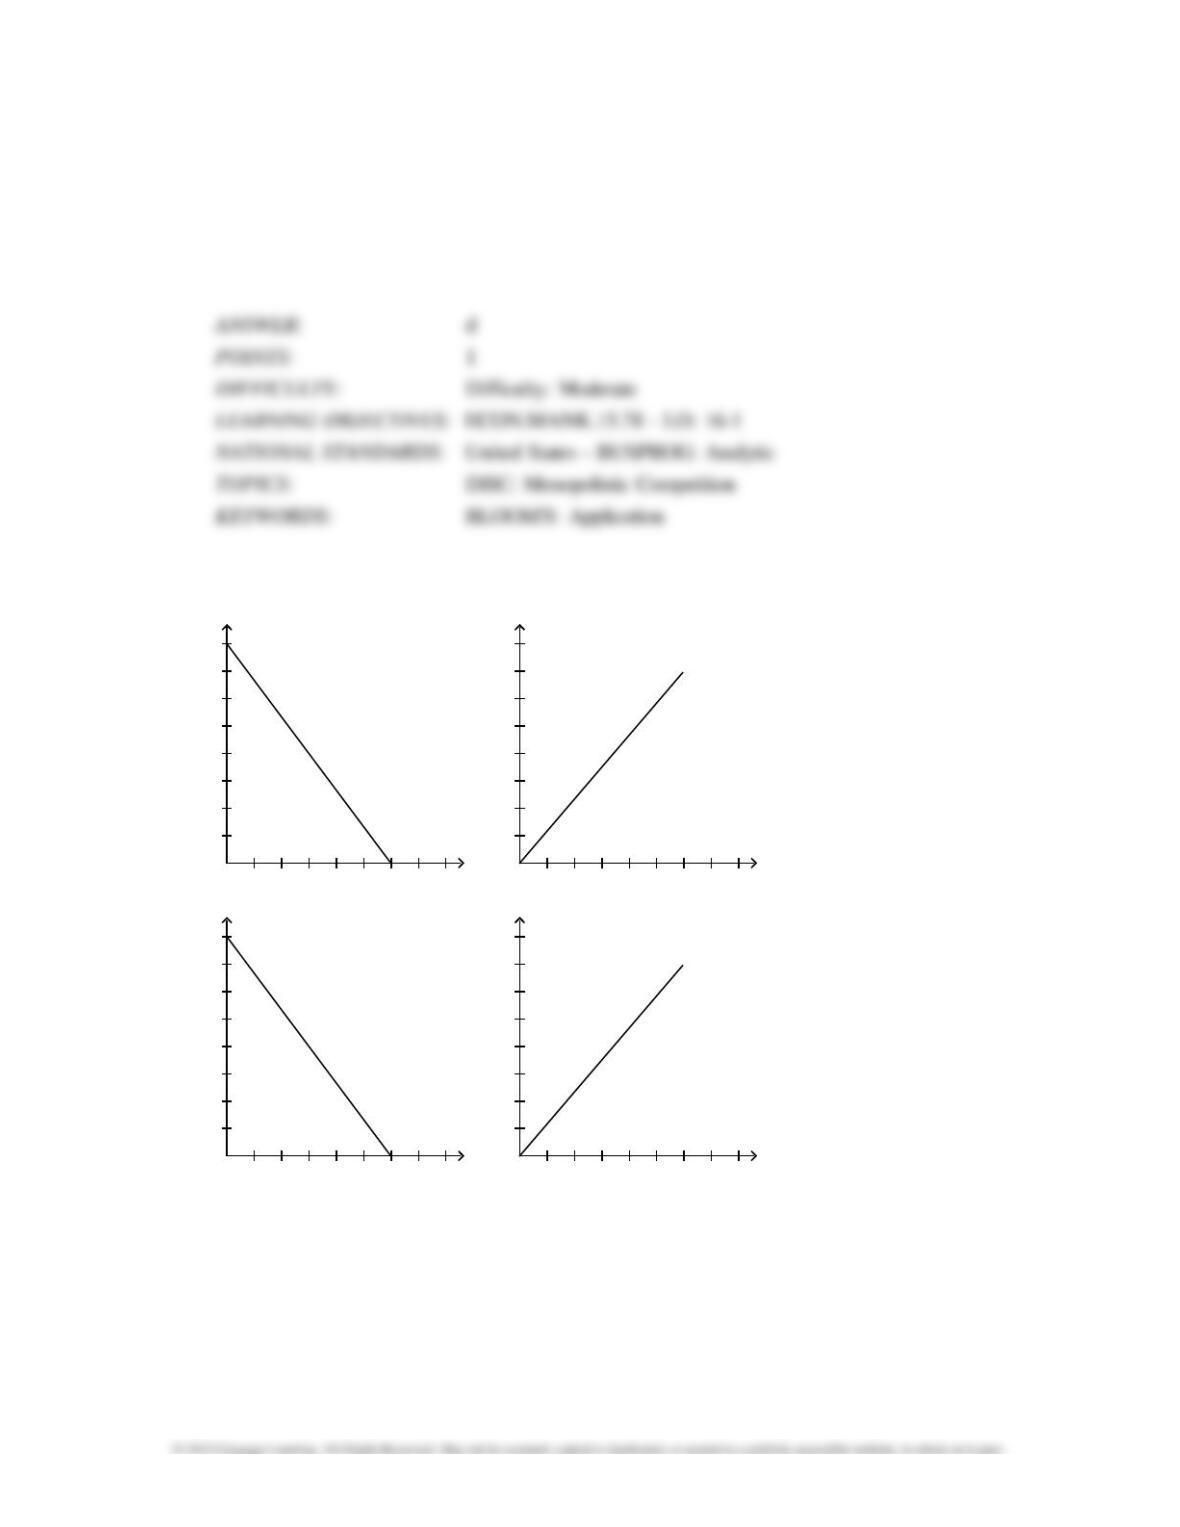
Figure 16-1
Panel C
Quantity
Price
Panel D
Quantity
Price
Panel C
Quantity
Price
Panel D
Quantity
Price

3984 Monopolistic Competition
89. Refer to Figure 16–1. Which of the graphs illustrates the demand curve most likely faced by a
firm in a monopolistically competitive market?
a. Panel A
b. Panel B
c. Panel C
d. Panel D
90. Refer to Figure 16–1. Which of the graphs illustrates a relatively elastic, though not perfectly
elastic, demand curve consistent with a market that has many substitute products?
a. Panel A
b. Panel B
c. Panel C
d. Panel D
Monopolistic Competition 3985
91. Refer to Figure 16-1. Which of the following sets of explanations best describes the
differences between the graphs above?
a. Panel A: monopolistically competitive firm’s demand curve
Panel B: monopoly firm’s demand curve Panel C: oligopoly firm’s demand curve
Panel D: perfectly competitive firm’s demand curve
b. Panel A: oligopoly firm’s demand curve
Panel B: perfectly competitive firm’s demand curve
Panel C: monopolistically competitive firm’s demand curve
Panel D: supply curve
c. Panel A: perfectly competitive firm’s demand curve
Panel B: monopolistically competitive firm’s demand curve Panel C: monopoly firm’s demand
curve
Panel D: supply curve
d. Panel A: monopolistically competitive firm’s demand curve Panel B: monopoly firm’s demand
curve
Panel C: perfectly competitive firm’s demand curve
Panel D: supply curve
Multiple Choice – Section 02: Competition with Differentiated Products
1. A downward-sloping demand curve
a. is a feature of all monopolistically competitive firms.
b. means that the firm in question will never experience a zero profit.
c. causes marginal revenue to exceed price.
d. prohibits firms from earning positive economic profits in the long run.
3986 Monopolistic Competition
2. Each firm in a monopolistically competitive industry faces a downward–sloping demand curve
because
a. there are many other sellers in the market.
b. there are very few other sellers in the market.
c. the firm’s product is different from those offered by other firms in the market.
d. the firm faces the threat of entry into the market by new firms.
3. For a monopolistically competitive firm,
a. marginal revenue and price are the same.
b. average revenue and price are the same.
c. at the profit-maximizing quantity of output, price equals marginal cost.
d. at the profit-maximizing quantity of output, price equals the minimum of average total cost.

Monopolistic Competition 3987
4. For a monopolistically competitive firm, at the profit–maximizing quantity of output,
a. price exceeds marginal cost.
b. marginal revenue exceeds marginal cost.
c. marginal cost exceeds average revenue.
d. price equals marginal revenue.
5. Product differentiation causes the seller of a good to face what type of demand curve?
a. downward sloping
b. vertical
c. horizontal
d. Any of the above could be correct since product differentiation does not affect the shape of the
demand curve.

3988 Monopolistic Competition
6. A firm in a monopolistically competitive market faces a
a. downward-sloping demand curve because the firm’s product is different from those offered by
other firms.
b. downward-sloping demand curve because there are only a few firms in the market.
c. horizontal demand curve because there are many firms in the market.
d. horizontal demand curve because firms can enter the market without restriction.
7. In the short run, a firm in a monopolistically competitive market operates much like a
a. firm in a perfectly competitive market.
b. firm in an oligopoly.
c. monopolist.
d. monopsonist.
Monopolistic Competition 3989
8. Each firm in a monopolistically competitive market
a. earns both short-run and long-run profits.
b. faces a downward-sloping demand curve.
c. cannot earn economic profit in the short run.
d. sets price equal to marginal cost.
9. In a monopolistically competitive industry, firms set price
a. equal to marginal cost since each firm is a price taker.
b. below marginal cost since each firm is a price taker.
c. above marginal cost since each firm is a price setter.
d. always a fraction of marginal cost since each firm is a price setter.

3990 Monopolistic Competition
10. A profit-maximizing firm in a monopolistically competitive market differs from a firm in a perfectly
competitive market because the firm in the monopolistically competitive market
a. chooses its profit–maximizing quantity where marginal revenue equals marginal cost.
b. sells its product in a highly-concentrated market.
c. faces a downward-sloping demand curve for its product.
d. can earn profits in the long run.
11. A monopolistically competitive firm chooses
a. the quantity of output to produce, but the market determines price.
b. the price, but competition in the market determines the quantity.
c. price, but output is determined by a cartel production quota.
d. the quantity of output to produce and the price at which it will sell its output.

Monopolistic Competition 3991
12. Product differentiation in monopolistically competitive markets ensures that, for profit-maximizing
firms,
a. marginal revenue will equal average total cost.
b. price will exceed marginal cost.
c. marginal cost will exceed average revenue.
d. average variable cost will be declining.
13. In a monopolistically competitive industry, a firm’s demand curve also represent its
a. marginal revenue.
b. marginal cost.
c. average revenue.
d. profit.
3992 Monopolistic Competition
14. A firm in a monopolistically competitive market is similar to a monopoly in the sense that
(i) they both face downward-sloping demand curves.
(ii) they both charge a price that exceeds marginal cost.
(iii) free entry and exit determines the long–run equilibrium.
a. (i) only
b. (ii) only
c. (i) and (ii) only
d. (i), (ii), and (iii) only
15. A monopolistically competitive firm‘s choice of output level is virtually identical to the choice made
by
a. a perfectly competitive firm.
b. a duopolist.
c. a monopolist.
d. an oligopolist.
Monopolistic Competition 3993
16. To maximize its profit, a monopolistically competitive firm
a. takes the price as given and chooses its quantity, just as a competitive firm does.
b. takes the price as given and chooses its quantity, just as a colluding oligopolist does.
c. chooses its quantity and price, just as a competitive firm does.
d. chooses its quantity and price, just as a monopoly does.
17. Because monopolistically competitive firms produce differentiated products, each firm
a. faces a demand curve that is horizontal.
b. faces a demand curve that is vertical.
c. has no control over product price.
d. has some control over product price.
3994 Monopolistic Competition
18. A monopolistically competitive firm chooses its
a. price and quantity just as a monopoly does.
b. quantity but faces a horizontal demand curve just as a competitive firm does.
c. price but can sell any quantity at the market price just as an oligopoly does.
d. price and quantity based on the decisions of the other firms in the industry just as an oligopoly
does.
19. When a monopolistically competitive firm raises its price,
a. quantity demanded falls to zero.
b. quantity demanded declines but not to zero.
c. the market supply curve shifts outward.
d. quantity demanded remains constant.
Monopolistic Competition 3995
20. A monopolistically competitive firm chooses the quantity to produce where
a. price equals marginal cost.
b. demand equals marginal cost.
c. marginal revenue equals marginal cost.
d. Both a and c are correct.
21. The profit-maximizing rule for a firm in a monopolistically competitive market is to always select
the quantity at which
a. marginal revenue is equal to marginal cost.
b. average total cost is equal to marginal revenue.
c. average total cost is equal to price.
d. average revenue exceeds average total cost.
3996 Monopolistic Competition
22. A profit-maximizing firm in a monopolistically competitive market is characterized by which of the
following?
a. average revenue exceeds marginal revenue
b. marginal revenue exceeds average revenue
c. average revenue is equal to marginal revenue
d. revenue is always maximized along with profit
23. A profit-maximizing firm in a monopolistically competitive market is characterized by which of the
following?
a. average revenue exceeds marginal revenue
b. marginal revenue equals marginal cost
c. price exceeds marginal cost
d. All of the above are correct.
Monopolistic Competition 3997
24. A profit-maximizing firm in a monopolistically competitive market is characterized by which of the
following?
a. marginal cost exceeds marginal revenue
b. average revenue equals marginal cost
c. price exceeds marginal cost
d. All of the above are correct.
25. To maximize its profit, a monopolistically competitive firm chooses its level of output by looking
for the level of output at which
a. price equals marginal cost.
b. marginal revenue equals marginal cost.
c. average total cost is minimized.
d. All of the above are correct.
3998 Monopolistic Competition
26. A monopolistically competitive firm faces the following demand schedule for its product:
Price ($)
30
27
24
21
18
15
12
9
6
3
Quantity
3
6
9
12
15
18
21
24
27
30
The firm has total fixed costs of $9 and a constant marginal cost of $3 per unit. The firm will
maximize profit with
a. 9 units of output.
b. 15 units of output.
c. 21 units of output.
d. 30 units of output.
27. A monopolistically competitive firm faces the following demand curve for its product:
Price ($)
40
36
32
28
24
20
16
12
8
4
Quantity
4
10
16
22
28
34
40
46
52
58
The firm has total fixed costs of $100 and a constant marginal cost of $25 per unit. The firm will
maximize profit with the production of
a. 4 units of output.
b. 10 units of output.
c. 16 units of output.
d. 22 units of output.
Monopolistic Competition 3999
28. A monopolistically competitive firm has the following cost structure:
Output
10
20
30
40
50
60
70
Total Cost($)
800
875
1,025
1,250
1,550
1,925
2,375
The firm faces the following demand curve:
Price ($)
50
42
34
26
18
10
2
Quantity
10
20
30
40
50
60
70
To maximize profit (or minimize losses), the firm will produce
a. 20 units.
b. 30 units.
c. 40 units.
d. 50 units.
4000 Monopolistic Competition
29. A monopolistically competitive firm has the following cost structure:
Output
1
2
3
4
5
6
7
Total Cost($)
30
32
36
42
50
63
77
The firm faces the following demand curve:
Price ($)
20
18
15
12
9
7
4
Quantity
1
2
3
4
5
6
7
If the government forces this firm to produce at its efficient scale, it will
a. produce 3 units and make $9.
b. produce 4 units and make $6.
c. produce 5 units and lose $5.
d. produce 7 units and lose $49.
30. A monopolistically competitive firm is currently producing 20 units of output. At this level of output
the firm is charging a price equal to $20, has marginal revenue equal to $12, has marginal cost
equal to $12, and has average total cost equal to $18. From this information we can infer that
a. the firm is currently maximizing its profit.
b. the profits of the firm are negative.
c. firms are likely to leave this market in the long run.
d. All of the above are correct.